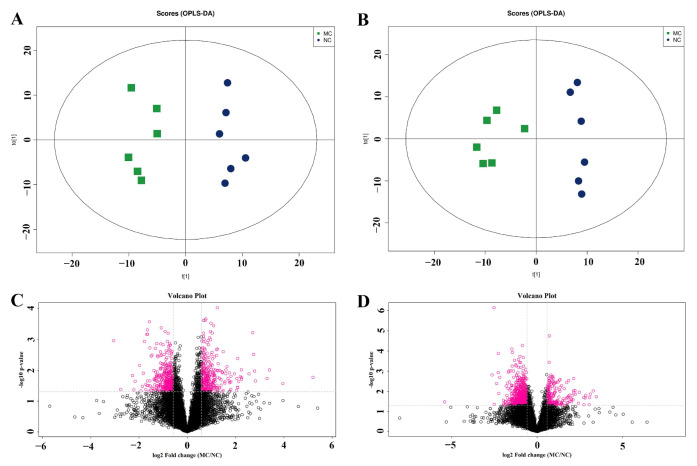
Figure 3.
Distinct metabolomic profile in Alzheimer’s disease (AD) mice. Score scatter plot of orthogonal partial least squares discriminant analysis (OPLS-DA) for model control (MC) and negative control (NC) groups in positive (A: R2X = 0.397, R2Y = 0.996, Q2 = 0.623) and negative (B: R2X = 0.415, R2Y = 0.994, Q2 = 0.571) ion modes. Analysis of differential metabolites between MC and NC mice in positive (C) and negative (D) ion modes. MC: model control, AD mice; NC: negative control, conventional mice.

