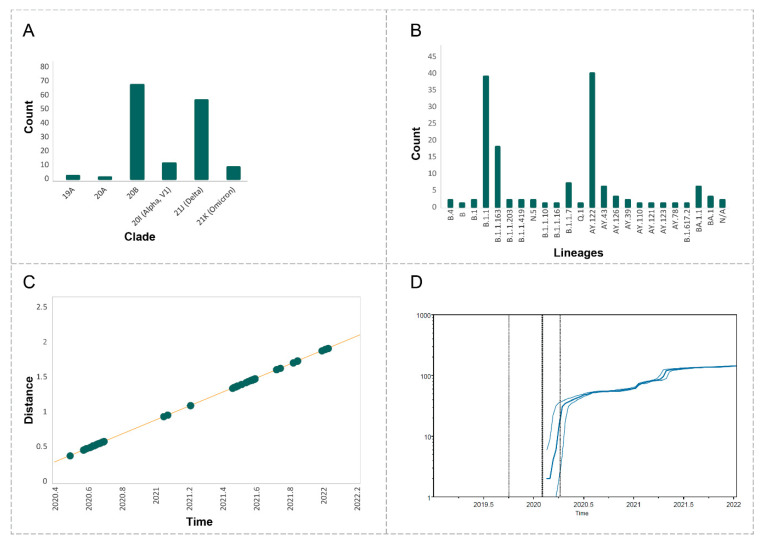
Figure 2.
(A) Distribution of SARS-CoV-2 lineages according to Nextstrain clade nomenclature. (B) Distribution of SARS-CoV-2 lineages according to PANGO lineages nomenclature. (C) Root-to-tip regression analyses using TempEst. The plot represents linear regression of root-to-tip genetic distance within the ML phylogeny against sampling time. (D) “Lineage through time” plot of the phylogenetic tree of Armenian samples. The solid thick line represents the log median of ancestral lineages present at each time interval. Thin lines represent 95% confidence intervals for the number of lineages.

