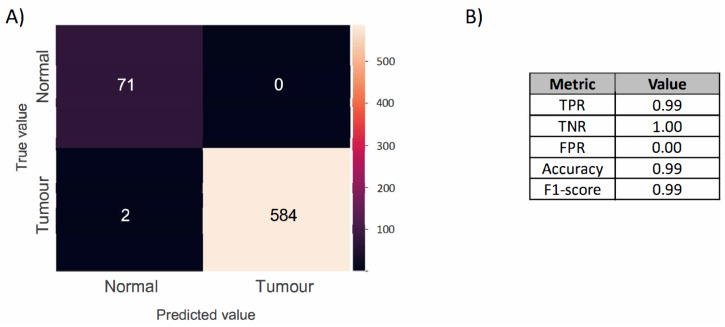
Figure 6.
(A) Confusion matrix of the MSI-based LR classification model produced by the cross-validating normal and cancerous FFPE samples, comparing the predicted label (x-axis) with the true label (y-axis), with true positives appearing along the matrix diagonal. (B) Model performance. The table reports the true positive rate (TPR), true negative rate (TNR), false positive rate (FPR), accuracy, and F1-score.

