Figure 5.
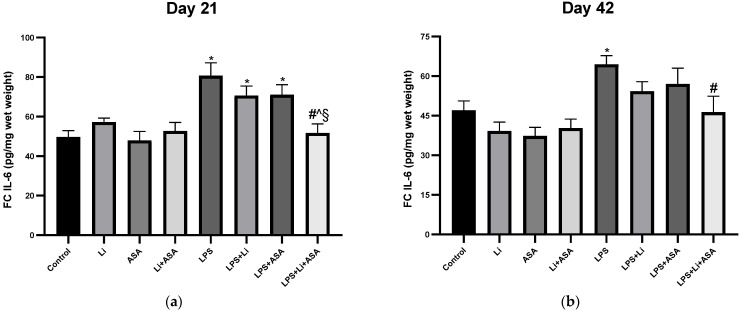
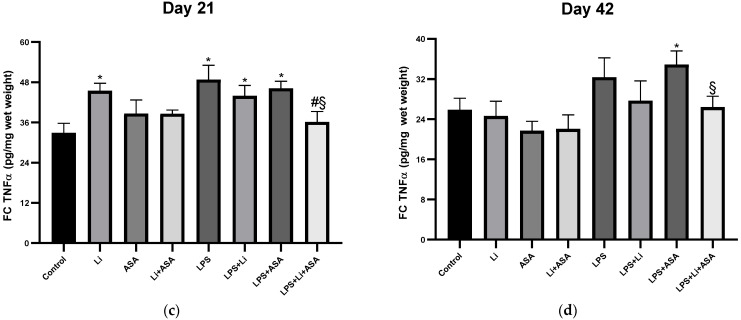
Effects of Li and aspirin co-administration on frontal cortex levels of IL-6 and TNF-α. Rats were fed regular food (control) or Li-containing food (0.1%) for 42 days. Low-dose aspirin (1 mg/kg, ip) was given alone or together with Li. On days 21 (a,c) and 42 (b,d) of the treatment protocol, 2 h before sacrifice, LPS (1 mg/kg) was administered as described under Materials and Methods. Determination of IL-6 and TNF-α was done using specific ELISA kits. Results are means ± SEM of a representative experiment out of two demonstrating a similar pattern, with eight rats/group. (a) FC IL-6 levels on day 21: One-way ANOVA, F = 7.199, p < 0.0001. Post-hoc Fisher’s LSD test: Control vs. LPS, LPS + Li and LPS + ASA, p < 0.002; Control vs. LPS + Li + ASA, NS; LPS vs. LPS + Li and LPS + ASA, NS; LPS vs. LPS + Li + ASA, p < 0.0001; LPS + Li vs. LPS + ASA, NS; LPS + Li vs. LPS + Li + ASA, p = 0.005; LPS + ASA vs. LPS + Li + ASA, p = 0.004. (b) FC IL-6 levels on day 42: One-way ANOVA, F = 5.131, p < 0.0001. Post-hoc Fisher’s LSD test: Control vs. LPS, p = 0.005; Control vs. LPS + Li, LPS + ASA and LPS + Li + ASA, NS; LPS vs. LPS + Li and LPS + ASA, NS; LPS vs. LPS + Li + ASA, p = 0.0037; LPS + Li vs. LPS + ASA and LPS + Li + ASA NS; LPS + ASA vs. LPS + Li + ASA, NS. (c) FC TNF-α levels on day 21: One-way ANOVA, F = 3.323, p = 0.005. Post-hoc Fisher’s LSD test: Control vs. Li, LPS, LPS + Li and LPS + ASA, p < 0.013; Control vs. LPS + Li + ASA, NS; LPS vs. LPS + Li, LPS + ASA, NS; LPS vs. LPS + Li + ASA, p = 0.0047; LPS + Li vs. LPS + ASA and LPS + Li + ASA, NS; LPS + ASA vs. LPS + Li + ASA, p = 0.023. (d) FC TNF-α on day 42: One-way ANOVA, F = 2.559, p = 0.023. Post-hoc Fisher’s LSD test: Control vs. LPS, LPS + Li, NS; Control vs. LPS + ASA, p = 0.032; Control vs. LPS + Li + ASA, NS; LPS vs. LPS + Li, p = 0.262; LPS vs. LPS + ASA, LPS + Li + ASA, NS; LPS + Li vs. LPS + ASA and LPS + Li + ASA, NS; LPS + ASA vs. LPS + Li + ASA, p = 0.043. Asterisks and symbols denote the following: * p < 0.05 vs. Control, # p < 0.05 vs. LPS; ^ p < 0.05 vs. LPS + Li; § p < 0.05 vs. LPS + ASA Abbreviations: ASA—acetylsalicylic acid, Li—lithium, LPS—lipopolysaccharide, NS—nonsignificant.


