Abstract
Human leptin is a 16-kDa (146-amino-acid) protein that is secreted from adipocytes and influences body weight homeostasis. In order to obtain high-level production of leptin, the human obese gene coding for leptin was expressed in Escherichia coli BL21(DE3) under the strong inducible T7 promoter. The recombinant leptin was produced as inclusion bodies in E. coli, and the recombinant leptin content was as high as 54% of the total protein content. For production of recombinant human leptin in large amounts, pH-stat fed-batch cultures were grown. Expression of leptin was induced at three different cell optical densities at 600 nm (OD600), 30, 90, and 140. When cells were induced at an OD600 of 90, the amount of leptin produced was 9.7 g/liter (37% of the total protein). After simple purification steps consisting of inclusion body isolation, denaturation and refolding, and anion-exchange chromatography, 144.9 mg of leptin that was more than 90% pure was obtained from a 50-ml culture, and the recovery yield was 41.1%.
Obesity is one of the major causes of important public health problems, such as hyperlipidemia, hypertension, coronary artery disease, and type II diabetes (7). In 1994, the obese gene coding for leptin was identified in genetically ob/ob mutant mice, and the predicted amino acid sequence encoded by the human obese gene exhibited 84% identity with the predicted amino acid sequence encoded by the mouse obese gene (27). Human leptin is a 16,025-Da (146-amino-acid) protein that is secreted from adipocytes (3). Decreases in food intake, energy expenditure, and body weight were observed when leptin was administered to ob/ob mutant mice that produced a defective leptin (2, 9, 17, 18). Therefore, it has been proposed that leptin is one of the satiety factors. The functions of leptin in regulating appetite and metabolism, as well as the possibility of using leptin as a therapeutic agent, are currently under intense investigation. It has been suggested that the effective dose is 0.1 to 10 mg/kg of body weight (6, 16, 24, 26), which means that large quantities of very pure and biologically active leptin are needed. So far, the most efficient leptin production has been described by Varnerin et al. (23), who were able to obtain 1.7 g of leptin from a 600-liter batch fermentation.
Escherichia coli has been the most commonly used host for production of various proteins (12). In E. coli, recombinant proteins can be produced either as soluble forms or as insoluble forms (inclusion bodies). Although complicated and costly denaturation and refolding processes are often necessary, many recombinant proteins have been produced in the form of inclusion bodies.
In this paper, we describe the development of an expression vector for leptin and optimization of induction as related to cell optical density during high-cell-density cultivation of recombinant E. coli for the production of gram quantities of recombinant human leptin. We also describe simple procedures for purification of leptin.
MATERIALS AND METHODS
Bacterial strains and plasmids.
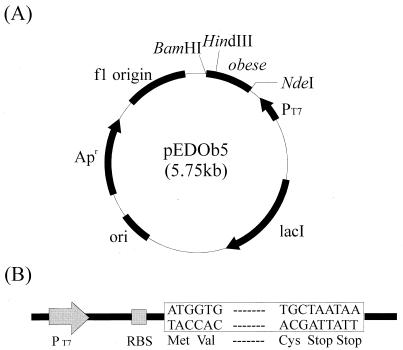
The bacterial strains and plasmids used in this study are shown in Table 1. E. coli XL1-Blue was used as a host strain for cloning and maintenance of plasmids. E. coli BL21(DE3) was used as a host strain for expression of the obese gene. A λ phage construct containing the cDNA of the human obese gene was kindly provided by J. Friedman (27). The obese gene from λ phage was first subcloned into pUC19 at the EcoRI site (pUCOb). For expression of the mature obese gene, pEDOb5 (Fig. 1) was constructed by cloning the obese gene into pET21c as follows. Forward primer 5′-GGCTAGCCATATGGTGCCCATCCAAAAAGTC-3′ was designed to contain an NdeI site (underlined nucleotides) immediately upstream of the codon for valine (GTG), which is the first amino acid of mature leptin. In this way, the initiator methionine could be introduced for expression of leptin in E. coli. Reverse primer 5′-GCCGGATCCTTATTAGCACCCAGGGCTGAGG-3′ was designed to contain a BamHI site (underlined nucleotides) and tandem TAA stop codons immediately after the final cysteine codon (TGC). A PCR was performed with a model MP TP3000 PCR thermal cycler (Takara Shuzo Co., Shiga, Japan) by using the High Fidelity PCR system (Boehringer, Mannheim, Germany). The PCR product was digested with NdeI and BamHI before it was cloned into the same restriction enzyme sites in pET21c. The obese gene was expressed from the strong T7 promoter by induction with isopropyl-β-d-thiogalactopyranoside (IPTG) (Sigma Chemical Co., St. Louis, Mo.). All DNA manipulations, including restriction digestion, ligation, and agarose gel electrophoresis, were carried out as described by Sambrook et al. (19).
TABLE 1.
Bacterial strains and plasmids used in this study
| Strain or plasmid | Relevant characteristics | Reference or source |
|---|---|---|
| E. coli strains | ||
| XL1-Blue | supE44 hsdR17 recA1 endA1 gyrA96 thi relA1 lac F′(proAB+ lacIqlacZΔM15 Tn10(Tetr)) | Stratagenea |
| BL21(DE3) | F−ompT hsdSB (rB− mB−) gal dcm (DE3) | Novagenb |
| Plasmids | ||
| pUC19 | 2.7 kb, Apr | New England Biolabsc |
| pET21c | 5.3 kb, T7 promoter, Apr | Novagen |
| pUCOb | 3.6 kb, human obese gene, Apr | This study |
| pEDOb5 | 5.75 kb, human obese gene, T7 promoter, Apr | This study |
Stratagene Cloning Systems, La Jolla, Calif.
Novagen, Inc., Madison, Wis.
New England Biolabs, Inc., Beverly, Mass.
FIG. 1.
(A) Schematic diagram of plasmid pEDOb5. The PCR product (length, 438 bp) which encodes mature human leptin was digested with NdeI and BamHI and then cloned into pET21c at the same restriction sites. (B) Diagram illustrating the main features of pEDOb5. Expression of the human obese gene is controlled by the T7 promoter (PT7). A tandem repeat of the stop codon follows the human obese gene. RBS, ribosome binding site.
Production of recombinant leptin.
Luria-Bertani (LB) medium (10 g of tryptone per liter, 5 g of yeast extract per liter, 5 g of NaCl per liter) was used for flask cultures. Cells were cultivated in 250-ml flasks containing 50 ml of LB medium supplemented with 50 μg of ampicillin per ml in a shaking incubator at 37°C and 200 rpm. At an optical density at 600 nm (OD600) of 0.7, IPTG was added to a final concentration of 1.0 mM. Cells were cultivated for another 4 h and then were harvested by centrifugation at 6,000 × g for 10 min at 4°C. The cells were disrupted by sonication (Branson Ultrasonics Co., Danbury, Conn.) for 1 min at 40% output. After centrifugation at 10,000 × g for 10 min at 4°C, the supernatant fluid (soluble protein fraction) was saved, and the pellet (inclusion body fraction) was resuspended in 10 mM Tris-HCl buffer (pH 8.0).
R/2 medium (pH 6.8) was used for fed-batch cultures (13). This medium contains (per liter) 2 g of (NH4)2HPO4, 6.75 g of KH2PO4, 0.85 g of citric acid, 0.7 g of MgSO4 · 7H2O, and 5 ml of a trace metal solution that contains (per liter of 5 M HCl) 10 g of FeSO4 · 7H2O, 2.25 g of ZnSO4 · 7H2O, 1 g of CuSO4 · 5H2O, 0.5 g of MnSO4 · 5H2O, 0.23 g of Na2B4O7 · 10H2O, 2 g of CaCl2 · 2H2O, and 0.1 g of (NH4)6MO7O24. Glucose (20 g/liter) was used as a carbon source. A seed culture was prepared in a 1-liter flask containing 200 ml of R/2 medium. Fed-batch cultures were grown in a 6.6-liter jar fermentor (Bioflo 3000; New Brunswick Scientific Co., Edison, N.J.) containing 1.8 liters of R/2 medium. Except for periods when the pH increased due to glucose depletion, the pH was kept at 6.8 by adding 28% (vol/vol) ammonia water. The dissolved oxygen concentration was kept at 40% of air saturation by automatically increasing the agitation speed to 1,000 rpm and by changing the percentage of pure oxygen. A nutrient feeding solution was added by using the pH-stat (with high limit) feeding strategy (21). The feeding solution contained 800 g of glucose per liter and 20 g of MgSO4 · 7H2O per liter. When the pH rose to a value greater than its set point (pH 6.8) by 0.08 U due to the depletion of glucose, the appropriate volume of the feeding solution was automatically added to increase the glucose concentration in the culture broth to 0.7 g/liter. Expression of the obese gene was induced by adding IPTG to a final concentration of 1 mM.
Purification of human leptin.
Cells were harvested from 50 ml of culture by centrifugation at 6,000 × g for 10 min at 4°C. The cells were resuspended in 50 ml of resuspension buffer (50 mM Tris-HCl, 0.1 M NaCl, 1 mM EDTA; pH 8.0) and were disrupted by sonication for 30 min at 50% output. Inclusion bodies were separated from the cell lysate by centrifugation at 14,000 × g for 30 min at 4°C. The pellet was washed twice with 1% (vol/vol) Triton X-100 and once with double-distilled water to remove the contaminants. The pellet was resuspended in 50 ml of denaturation buffer containing 8 M urea in 50 mM Tris-HCl (pH 7.5). The suspension was gently shaken for 4 h at room temperature. After centrifugation at 14,000 × g for 30 min at 18°C to remove the undissolved material, the urea in the supernatant was diluted by slow infusion over a 12-h period of 1.5 liters of phosphate-buffered saline (4.3 mM Na2HPO4, 1.4 mM KH2PO4, 137 mM NaCl, 2.7 mM KCl; pH 7.4) containing 2 mM reduced glutathione and 0.2 mM oxidized glutathione. The solution was stirred for an additional 10 h at room temperature. The protein solution was concentrated to a volume of 50 ml by ultrafiltration by using an ultrafiltration cell (Amicon, Beverly, Mass.) and a type YM3 ultrafiltration membrane (molecular weight cutoff, 3,000; Millipore, Bedford, Mass.). Finally, human leptin was purified by anion-exchange column chromatography with a BioLogic HR system (Bio-Rad, Hercules, Calif.). The concentrated protein solution was loaded onto an anion-exchange column (Bio-Scale Q2; Bio-Rad) that had been preequilibrated with 50 mM Tris-HCl (pH 7.5), and then the protein was eluted with a linear 0 to 1.0 M NaCl gradient in the same buffer at a rate of 90 ml/h. The protein concentration in each fraction was monitored with a UV detector (Bio-Rad). The NaCl was removed by dialysis (molecular weight cutoff, 3,500; Spectrum Laboratories, Inc., Laguna Hills, Calif.) against 2 liters of phosphate-buffered saline for 24 h with three buffer exchanges.
Analysis of oxidation state.
To determine whether a putative disulfide bond between the two cysteines in leptin was present, the purified leptin was treated with 5 mM dithiothreitol (DTT) for 1 h at room temperature and then was lyophilized with a Speed-Vac concentrator (Savant Co., New York, N.Y.). The lyophilized sample was resuspended in sodium dodecyl sulfate-polyacrylamide gel electrophoresis (SDS-PAGE) sample buffer without a reducing agent. A control sample was prepared by the same method without the DTT treatment. Both protein samples were analyzed by SDS-PAGE.
Analytical methods.
During fed-batch cultivation, cell growth was monitored by measuring the OD600. Cell dry weight was determined as described previously (14). Protein samples were analyzed by electrophoresis on SDS-PAGE gels containing 12% (wt/vol) polyacrylamide as described by Laemmli (11). The gels were stained with Coomassie brilliant blue R-250 (Bio-Rad). The protein bands on the SDS-PAGE gels were quantified by densitometry (ImagerMaster; Pharmacia Biotech, Uppsala, Sweden). The amount of soluble protein was determined with a protein assay kit (Bio-Rad) by using bovine serum albumin as the standard. The purity of leptin was analyzed by SDS-PAGE and by using a human leptin enzyme-linked immunosorbent assay (ELISA) kit (Diagnostic Systems Laboratory Inc., Webster, Tex.). The molecular mass of purified leptin was determined by matrix-assisted laser desorption-ionization mass spectrometry (PerSeptive Biosystems, Framingham, Mass.). The endotoxin level of the purified protein solution was determined by using the Limulus amebocyte lysate gel clot method (Cape Cod Inc., Falmouth, Mass.).
RESULTS
Expression of the human obese gene in E. coli.
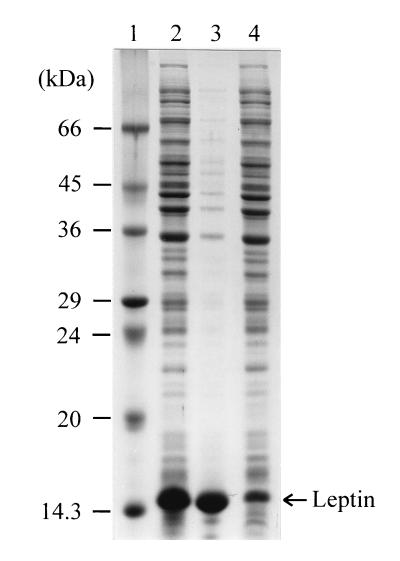
The mature obese gene was amplified from pUCOb by PCR and was subcloned into the pET21c expression vector (Fig. 1). The PCR product was digested with NdeI and BamHI and was cloned into pET21c digested with the same restriction enzymes. When this was done, the first amino acid residue of mature human leptin, Val, directly followed Met. The resulting plasmid, pEDOb5, was used to transform E. coli BL21(DE3). Cells were grown in LB medium and were induced with 1 mM IPTG at an OD600 of 0.7. More than 90% of the recombinant human leptin produced was produced as inclusion bodies, and the leptin level was as high as 54% ± 1.3% of the total protein content (Fig. 2).
FIG. 2.
SDS-PAGE analysis of leptin produced by a flask culture. Each fraction corresponds to 10 μl of protein homogenate. Lane 1, molecular mass standards; lane 2, total proteins; lane 3, inclusion body fraction; lane 4, soluble protein fraction.
Fed-batch cultivation.
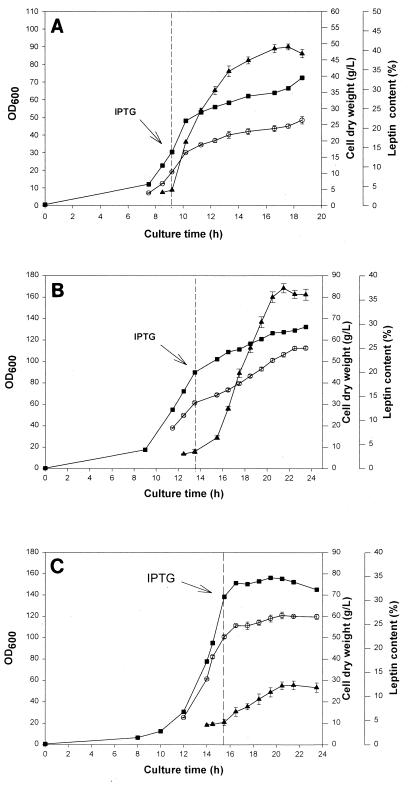
pH-stat fed-batch cultures of E. coli BL21(DE3) harboring pEDOb5 were grown as described above. To examine the effect of cell density at the time of induction on production of leptin, cells were induced with IPTG at OD600 values of 30, 90, and 140. Figure 3 shows the time profiles for cell density (OD600), cell dry weight, and leptin content expressed as a percentage of the total protein content. When cells were induced at the low cell density (OD600, 30), the fraction of leptin in the total protein increased for 8 h after induction and then decreased slightly (Fig. 3A). The cell dry weight and the maximal leptin content were 24 ± 0.5 g/liter and 41% ± 1.8% of the total protein, respectively. When cells were induced at the intermediate cell density (OD600, 90), the fraction of leptin again increased for 8 h after induction and then decreased. The cell dry weight and the maximal leptin content were 52 ± 0.6 g/liter and 37% ± 1.2% of the total protein, respectively (Fig. 3B). The concentration of leptin was as high as 9.7 g/liter at this point. Therefore, the concentration of leptin obtained when cells were induced at an OD600 of 90 was about twice the concentration of leptin obtained when cells were induced at an OD600 of 30. When cells were induced at the highest cell density tested (OD600, 140), the fraction of leptin increased for 6 h after induction and then decreased. The maximal dry weight and the maximal leptin content were 60.5 ± 1.4 g/liter and 12.3% ± 1.2% of the total protein, respectively (Fig. 3C). Therefore, recombinant leptin was most efficiently produced when cells were induced at the intermediate cell density.
FIG. 3.
Time profiles for cell density (OD600) (■), cell dry weight (○), and leptin content (▴) during fed-batch cultivation with induction at the low cell density (A), the intermediate cell density (B), and the high cell density (C). The dashed lines indicate the time of induction.
Purification of recombinant leptin.
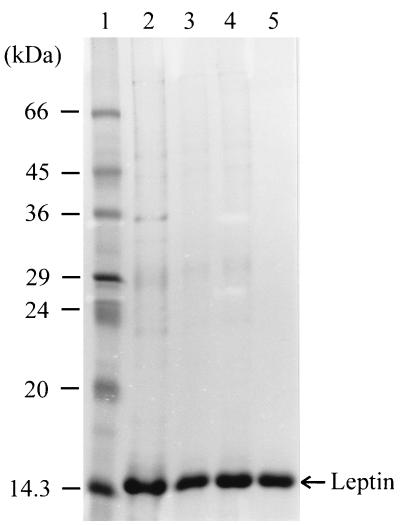
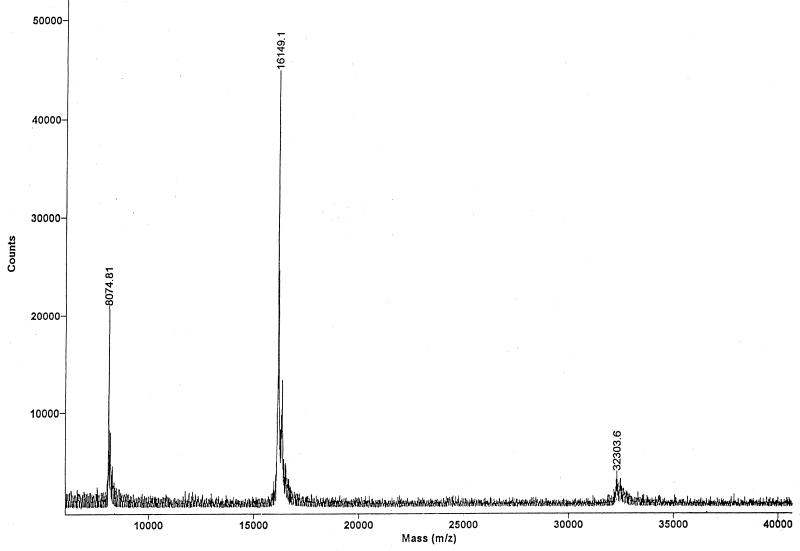
Recombinant leptin was purified from 50 ml of culture broth obtained from a fed-batch culture induced at the intermediate cell density as described above. The results are summarized in Table 2. The final amount and the recovery yield of purified leptin were 144.9 mg and 41.1%, respectively. The purity of the leptin as determined by SDS-PAGE was greater than 95% (Fig. 4), and the purity of the leptin as determined with the ELISA kit was 90%. The apparent molecular mass of human leptin as determined by SDS-PAGE was ca. 15 kDa, which was less than the previously reported value, 16,025 Da. However, a mass spectrum analysis of the recombinant leptin showed that the molecular mass was 16,149.1 Da, which is consistent with the size of human leptin plus an additional Met (Fig. 5). Abnormal mobility of leptin on SDS-PAGE gels has also been observed previously (6, 23). The mass spectrum analysis also showed that the monomeric form of leptin was dominant, which suggested that the recombinant leptin was very pure. Small quantities of dimeric leptin (molecular mass, 32,303.6 Da) were present. Before the refolded proteins were loaded onto the column, the endotoxin level was more than ca. 20,000 endotoxin units (EU)/ml. After anion-exchange chromatography, the endotoxin level had decreased to 225 EU/ml.
TABLE 2.
Protein recovery in a representative experiment: extraction and solubilization from inclusion bodiesa
| Purification step | Vol (ml) | Concn of protein (mg/ml)b | Amt of total protein (mg) | Amt of leptin (mg) | % Recovery | Purity (%) |
|---|---|---|---|---|---|---|
| 8 M urea denaturation | 50 | 8.2 | 410 | 352.6 | 100 | 87c |
| Dilution and refolding | 1,500 | 0.21 | 315 | 274.1 | 77.7 | 88c |
| Elution on Q2 column | 87 | 1.85 | 161 | 144.9 | 41.1 | 90d |
A 50-ml fed-batch culture was induced at the intermediate cell density.
Concentrations were determined with the Bio-Rad protein assay kit.
Determined by densitometric scanning of SDS-PAGE gels.
Determined with the ELISA kit.
FIG. 4.
SDS-PAGE analysis of samples from each purification step. Lane 1, molecular mass standards; lane 2, inclusion body fraction after washing with double-distilled H2O; lane 3, supernatant after denaturation and centrifugation; lane 4, refolded leptin after dialysis; lane 5, sample after anion-exchange chromatography.
FIG. 5.
Mass spectrum of purified recombinant human leptin. The matrix-assisted laser desorption-ionization mass spectrum is dominated by a single component (leptin, the second peak) with a measured molecular mass of 16,149.1. The first peak (8,074.81) represents the doubly protonated form of the protein arising from the matrix-assisted laser desorption-ionization mass spectrometric process. The third peak (32,303.6) represents a leptin dimer.
Oxidation state of recombinant leptin.
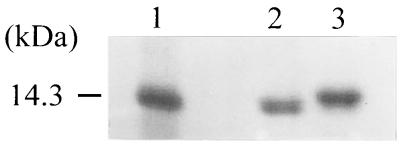
Leptin contains two cysteine residues (Cys-96 and Cys-146) that form a disulfide bond in the active form (8). To determine whether there was a disulfide bond in purified leptin, the redox state of leptin was analyzed. When leptin was reduced by treating it with 5 mM DTT, the position of the leptin band on an SDS-PAGE gel shifted upward compared with the position of the nonreduced leptin band (Fig. 6). Therefore, we concluded that the two Cys residues in the refolded recombinant human leptin are linked by a disulfide bond.
FIG. 6.
Electrophoretic analysis of the redox state of leptin after treatment with a reducing agent (5 mM DTT). Lane 1, molecular mass standards; lane 2, leptin not treated with DTT; lane 3, DTT-treated leptin.
DISCUSSION
A primary goal of fermentation research is cost-effective production of desired products. Fed-batch cultivation has most often been used for production of various recombinant proteins at high concentrations with high productivities (12). There are several nutrient-feeding strategies that are available, and the pH-stat strategy was employed in this study for the following reasons. In order to prevent excessive feeding of glucose, which is known to cause acetate production, a predetermined amount of the nutrient feeding solution was added only when the glucose concentration dropped to zero (indicated by an increase in the pH) (21). It is well-known that production of recombinant proteins can be significantly affected by the nutrient feeding strategies employed for fed-batch cultivation (12). In order to find the optimal nutrient feeding strategy, detailed studies on the effects of preinduction (4, 20) and postinduction (25) feeding strategies on cell growth and product formation need to be carried out. However, this can be labor-intensive and time-consuming. An alternative is to use the pH-stat nutrient feeding strategy. Even though this strategy may not be optimal, it generally results in good production of recombinant proteins (25). Formation of recombinant proteins is also affected by the time of induction (5, 10). IPTG induction at the intermediate cell density (OD600, 90) resulted in the best production of recombinant leptin, whose concentration was as high as 9.7 g/liter. In all cultures the cell growth rate decreased after induction. In particular, induction at the high cell density resulted in a considerable decrease in the growth rate (0.4 to 0.04 h−1). When cells were induced at the low or intermediate cell density, the growth rate decreased much less than the growth rate decreased when cells were induced at the high cell density. The specific leptin productivity was highest (25.7 mg of leptin per g [dry weight] of cells per h) when cells were induced at the low cell density. However, the volumetric leptin productivity was highest (1.2 g of leptin per liter per h) when cells were induced at the intermediate cell density even though the specific productivity (23.1 mg of leptin per g [dry weight] of cells per h) was slightly lower than the specific productivity obtained when cells were induced at the low cell density.
For efficient expression of the human obese gene in E. coli, several groups of workers have used a modified gene (1, 6). Fawzi et al. (6) used a synthetic obese gene in which 86 nucleotides were substituted based on the E. coli high-frequency codon database and the first amino acid, Val, was replaced by Pro. The concentration of leptin produced as inclusion bodies by this construct was only 100 to 120 mg/liter. In this study, we used the original human obese gene without any nucleotide changes. Even though the codon usage was not optimally designed for expression in E. coli, a much higher level of leptin (54% of the total protein; ca. 180 mg/liter) was produced in a flask culture. Therefore, we concluded that substitution of nucleotides based on E. coli preferable codon usage was not required for efficient expression of the human obese gene. This finding should be important because changing nucleotides based on E. coli codon usage has become a common practice for efficient production of heterologous proteins in E. coli. Obviously, there seem to be other factors that have more important effects on the synthesis of heterologous proteins in E. coli.
Production of a recombinant protein in the inclusion body form has several advantages, such as resistance to proteolytic degradation and simple primary recovery from the total protein. However, complicated and costly denaturation and refolding processes are often required to obtain a biological active protein from inclusion bodies, and during these processes the protein yield decreases significantly. However, the simple recovery steps used in this study resulted in purification of 144.9 mg of biologically active leptin from 50 ml of culture (recovery yield, 41.1%). In the case of the fed-batch fermentation with induction at the intermediate cell density, a total of 27.2 g of leptin was produced in 2.8 liters of culture broth (final volume of the culture), and 8.1 g of biologically active leptin was obtained after purification.
It has been reported that leptin refolded from inclusion bodies produced in E. coli is less potent than leptin secreted from eukaryotic cells (6, 23, 26). Furthermore, the biological potency of leptin varies significantly (about 20- to 100-fold) depending on the refolding method employed. Even though we did not determine the biological potency of our purified leptin by injecting it into ob/ob mice, we obtained several pieces of evidence which suggest that most of the refolded leptin was biologically active. First, the mass spectrum analysis showed that most of the purified leptin was in the monomeric form (Fig. 5). Second, we found that the disulfide bond between Cys-96 and Cys-146 in human leptin was correctly formed (Fig. 6). Third, the purity was high (about 90%), as determined by the ELISA analysis. Varnerin et al. (23) showed that a radioimmunoassay can also be used to measure leptin activity. There was a strong correlation (r2 = 0.96) between the results obtained with the human leptin ELISA kit (Diagnostic Systems Laboratory) and the results obtained with a human leptin radioimmunoassay kit (Linco Research Laboratory, St. Charles, Mo.). Therefore, we assumed that the recombinant human leptin obtained in this work had a potency equivalent to the potency of material produced by mammalian systems.
Because an endotoxin causes fever if it is introduced into the bloodstream of a human or another animal, endotoxin detection and removal are required for safe parenteral administration of products produced by recombinant E. coli. According to the Food and Drug Administration guidelines, the upper limit for endotoxin levels is 5.0 EU/kg of body weight per injection. During the purification steps in this study, especially during anion-exchange chromatography, most of the endotoxin was removed (20,000 to 225 EU/ml). To remove the remaining endotoxin, common procedures, such as ultrafiltration (22) or affinity chromatography (15), could be used.
In this report, we describe the production of large quantities of recombinant human leptin by fed-batch fermentation and efficient purification of this leptin. The high-level expression of leptin without the use of E. coli preferable codon usage, the production of a high concentration of leptin when cells are induced at an intermediate cell density during fed-batch cultivation, and the simple refolding of leptin which contains one disulfide bond should be useful for development of strategies for efficient production of other recombinant proteins in E. coli.
ACKNOWLEDGMENTS
We thank J. M. Friedman for providing the phage construct containing the human obese gene.
This work was supported by the BioProcess Engineering Research Center (KOSEF).
REFERENCES
- 1.Altmann S W, Timans J C, Rock F L, Bazan J F, Kastelein R A. Expression and purification of a synthetic human obese gene product. Protein Express Purif. 1995;6:722–726. doi: 10.1006/prep.1995.0002. [DOI] [PubMed] [Google Scholar]
- 2.Campfield L A, Smith F J, Guisez Y, Devos R, Burn P. Recombinant mouse OB protein: evidence for a peripheral signal linking adiposity and central neutral networks. Science. 1995;269:546–549. doi: 10.1126/science.7624778. [DOI] [PubMed] [Google Scholar]
- 3.Cohen S L, Halaas J L, Friedman J M, Chait B T, Bennett L, Chang D, Hecht R, Collins F. Human leptin characterization. Nature. 1996;382:589. doi: 10.1038/382589a0. [DOI] [PubMed] [Google Scholar]
- 4.Curless C, Pope J, Tsai L. Effect of preinduction specific growth rate on recombinant alpha consensus interferon synthesis in Escherichia coli. Biotechnol Prog. 1990;6:149–152. doi: 10.1021/bp00002a009. [DOI] [PubMed] [Google Scholar]
- 5.Fass R, van de Walle M, Shiloach A, Joslyn A, Kaufman J, Shiloach J. Use of high density cultures of Escherichia coli for high level production of recombinant Pseudomonas aeruginosa exotoxin A. Appl Microbiol Biotechnol. 1991;36:65–69. doi: 10.1007/BF00164700. [DOI] [PubMed] [Google Scholar]
- 6.Fawzi A B, Zhang H, van Heek M, Graziano M P. Purification of milligram quantities of human leptin from recombinant E. coli. Horm Metab Res. 1996;28:694–697. doi: 10.1055/s-2007-979880. [DOI] [PubMed] [Google Scholar]
- 7.Froguel P, Hager J. Human diabetes and obesity: tracking down the genes. Trends Biotechnol. 1995;13:52–55. doi: 10.1016/S0167-7799(00)88905-2. [DOI] [PubMed] [Google Scholar]
- 8.Giese K, Fantl W J, Vitt C, Stephans J C, Cousens L, Wachowicz M, Williams L T. Reduction of food intake and weight gain by the ob protein requires a specific secondary structure and is reversible. Mol Med. 1996;2:50–58. [PMC free article] [PubMed] [Google Scholar]
- 9.Halaas J L, Gajiwala K S, Maffei M, Cohen S L, Chait B T, Rabinowitz D, Lallone R L, Burley S K, Friedman J M. Weight-reducing effects of the plasma protein encoded by the ob gene. Science. 1995;269:543–546. doi: 10.1126/science.7624777. [DOI] [PubMed] [Google Scholar]
- 10.Hellmuth K, Korz D J, Sanders E A, Deckwer W D. Effect of growth rate on stability and gene expression of recombinant plasmids during continuous and high cell density cultivation of Escherichia coli TG1. J Biotechnol. 1994;32:289–298. doi: 10.1016/0168-1656(94)90215-1. [DOI] [PubMed] [Google Scholar]
- 11.Laemmli U K. Cleavage of structural proteins during the assembly of the head of bacteriophage T4. Nature. 1970;227:680–685. doi: 10.1038/227680a0. [DOI] [PubMed] [Google Scholar]
- 12.Lee S Y. High cell-density culture of Escherichia coli. Trends Biotechnol. 1996;14:98–105. doi: 10.1016/0167-7799(96)80930-9. [DOI] [PubMed] [Google Scholar]
- 13.Lee S Y, Chang H N. High cell density cultivation of Escherichia coli W using sucrose as a carbon source. Biotechnol Lett. 1993;15:971–974. [Google Scholar]
- 14.Lee S Y, Chang H N. Effect of complex nitrogen source on the synthesis and accumulation of poly(3-hydroxybutyric acid) by recombinant Escherichia coli in flask and fed-batch cultures. J Environ Polym Degrad. 1994;2:169–176. [Google Scholar]
- 15.Matsumae H, Minobe S, Kindan K, Watanabe T, Sato T, Tosa T. Specific removal of endotoxin from protein solutions by immobilized histidine. Biotechnol Appl Biochem. 1990;12:129–140. [PubMed] [Google Scholar]
- 16.Morsy M A, Gu M C, Zhao J Z, Holder D J, Rogers I T, Pouch W J, Motzel S L, Klein H J, Gupta S K, Liang X, Tota M R, Rosenblum C I, Caskey C T. Leptin gene therapy and daily protein administration: a comparative study in the ob/ob mouse. Gene Ther. 1998;5:8–18. doi: 10.1038/sj.gt.3300565. [DOI] [PubMed] [Google Scholar]
- 17.Pelleymounter M A, Cullen M J, Baker M B, Hecht R, Winters D, Boone T, Collins F. Effects of the obese gene product on body weight regulation in ob/ob mice. Science. 1995;269:540–543. doi: 10.1126/science.7624776. [DOI] [PubMed] [Google Scholar]
- 18.Rentsch J, Levens N, Chiesi M. Recombinant ob-gene product reduces food intake in fasted mice. Biochem Biophys Res Commun. 1995;214:131–136. doi: 10.1006/bbrc.1995.2266. [DOI] [PubMed] [Google Scholar]
- 19.Sambrook J, Fritsch E F, Maniatis T. Molecular cloning: a laboratory manual. 2nd ed. Cold Spring Harbor, N.Y: Cold Spring Harbor Laboratory Press; 1989. [Google Scholar]
- 20.Shin C S, Hong M S, Bae C S, Lee J. Enhanced production of human mini-proinsulin in fed-batch cultures at high cell density of Escherichia coli BL21(DE3)[pET-3aT2M2] Biotechnol Prog. 1997;13:249–257. doi: 10.1021/bp970018m. [DOI] [PubMed] [Google Scholar]
- 21.Suzuki T, Yamane T, Shimizu S. Phenomenological background and some preliminary trials of automated substrate supply in pH-stat modal fed-batch culture using a setpoint of high limit. J Ferment Bioeng. 1990;69:292–297. [Google Scholar]
- 22.Sweadner K J, Forte M, Nelsen L L. Filtration removal of endotoxin (pyrogen) in solution in different stages of aggregation. Appl Environ Microbiol. 1977;34:382–385. doi: 10.1128/aem.34.4.382-385.1977. [DOI] [PMC free article] [PubMed] [Google Scholar]
- 23.Varnerin J P, Smith T, Rosenblum C I, Vongs A, Murphy B A, Nunes C, Mellin T N, King J J, Burgess B W, Junker B, Chou M, Hey P, Frazier E, MacIntyre D E, van der Ploeg L H T, Tota M R. Production of leptin in Escherichia coli: a comparison of methods. Protein Expr Purif. 1998;14:335–342. doi: 10.1006/prep.1998.0978. [DOI] [PubMed] [Google Scholar]
- 24.Weigle D S, Bukowski T R, Foster D C, Holderman S, Kramer J M, Lasser G, Lofton-Day C E, Prunkard D E, Raymond C, Kuijper J L. Recombinant ob protein reduces feeding and body weight in the ob/ob mouse. J Clin Invest. 1995;96:2065–2070. doi: 10.1172/JCI118254. [DOI] [PMC free article] [PubMed] [Google Scholar]
- 25.Wong H H, Kim Y C, Lee S Y, Chang H N. Effect of post-induction nutrient feeding strategies on the production of bioadhesive protein in Escherichia coli. Biotechnol Bioeng. 1998;60:271–276. doi: 10.1002/(sici)1097-0290(19981105)60:3<271::aid-bit1>3.0.co;2-e. [DOI] [PubMed] [Google Scholar]
- 26.Zamorano P L, De Sevilla L, Mahesh V B, Brann D W. Production and refolding of recombinant leptin. BioTechniques. 1997;23:800–804. doi: 10.2144/97235bm07. [DOI] [PubMed] [Google Scholar]
- 27.Zhang Y, Proenca R, Maffei M, Barone M, Leopold L, Friedman J M. Positional cloning of the mouse ob gene and its human homologue. Nature. 1994;372:425–432. doi: 10.1038/372425a0. [DOI] [PubMed] [Google Scholar]


