Abstract
Decades of hippocampal neurophysiology research have linked the hippocampal theta rhythm to voluntary movement. A consistent observation has been a robust correlation between the amplitude (or power) and frequency of hippocampal theta and running speed. Recently, however, it has been suggested that acceleration, not running speed, is the dominating influence on theta frequency. There is an inherent interdependence among these two variables, as acceleration is the rate of change in velocity. Therefore, we investigated theta frequency and amplitude of the local-field potential recorded from the stratum pyramidale, stratum radiatum, and stratum lacunosum moleculare of the CA1 subregion, considering both speed and acceleration in tandem as animals traversed a circular task or performed continuous alternation. In male and female rats volitionally controlling their own running characteristics, we found that running speed carries nearly all of the variability in theta frequency and power, with a minute contribution from acceleration. These results contradicted a recent publication using a speed-clamping task, where acceleration and movement are compelled through the use of a bottomless car (Kropff et al., 2021a). Therefore, we reanalyzed the speed-clamping data replicating a transient increase in theta frequency during acceleration. Compared with track running rats, the speed-clamped animals exhibited lower velocities and acceleration values but still showed a stronger influence of speed on theta frequency relative to acceleration. As navigation is the integration of many sensory inputs that are not necessarily linearly related, we offer caution in making absolute claims regarding hippocampal physiology from correlates garnered from a single behavioral repertoire.
SIGNIFICANCE STATEMENT A long-standing, replicable observation has been the increase of hippocampal theta power and frequency with increasing running speed. Recently, however, an experimental approach that clamps the running speed of an animal has suggested that acceleration is the dominant influence. Therefore, we analyzed data from freely behaving rats as well as data from the speed-clamping experiment. In unrestrained behavior, speed remains the dominant behavioral correlate to theta amplitude and frequency. Positive acceleration in the speed-clamp experiment induced a transient increase in theta frequency and power. However, speed retained the dominant influence over theta frequency, changing with velocity in both acceleration and deceleration conditions.
Keywords: hippocampus, LFP, oscillation, rat, theta, vestibular system
Introduction
The hippocampal theta rhythm (∼4–12 Hz) is reported to correspond to motor output, goal seeking, working memory, and navigation (for review, see Buzsáki, 2005). Theta frequency has also been reported to change with progress on an auditory task (Aronov et al., 2017), as well as the onset of a jump (Bland et al., 2006; Lenck-Santini et al., 2008). Although theta power and frequency are widely reported as correlating with an animal's running speed (Whishaw and Vanderwolf, 1973; Arnolds et al., 1979), a recent publication has contended that theta frequency is controlled by acceleration and not speed. Briefly, rats were placed in a bottomless car that externally controlled the rate of movement. Periods of rapid car acceleration were associated with increased theta frequency, leading the authors to conclude that acceleration, not velocity, is the critical variable modulating theta frequency (Kropff et al., 2021a).
The semicircular canals and otolith organs of the inner ear detect angular and linear acceleration, respectively. These signals are then sent through the vestibulocochlear nerve and indirectly relayed to the hippocampus through parallel pathways involving the thalamus, supramammillary nucleus, and medial septum (for review, see Aitken et al., 2017a). Vestibular loss is associated with learning and memory deficits, hippocampal atrophy (Brandt et al., 2005), and reduced hippocampal theta power (Russell et al., 2006). Relatedly, stimulation of the vestibular nerve elicits a field potential in the hippocampus (Cuthbert et al., 2000). While these data suggest that vestibular input contributes to the hippocampal local field potential, the data regarding the relationship between acceleration and hippocampal theta have been equivocal. When theta power was measured while rats ran an alternation task, no relationship between acceleration and theta power was detected (Montgomery et al., 2009). Conversely, when rats ran on a treadmill (with limited optic flow and vestibular signals), the greatest change in theta power and frequency was observed when rats switched between walking and running (Kuo et al., 2011). Similarly, in presurgical epilepsy patients, hippocampal theta power is associated with the onset of movement in a virtual environment (Bush et al., 2017). When controlling for running velocity in rats, it has also been reported that deceleration accounts for a significant amount of variance in theta power (Long et al., 2014). It is difficult to make comparisons across many of these studies, however, as vestibular input is negligible in behaviors in which the subjects change velocities on a treadmill or virtually.
Both acceleration and running speed have also been shown to organize neuron spiking patterns within a theta cycle. During theta cycles in which the animal is accelerating, more CA1 pyramidal cells with spatial firing fields corresponding to locations ahead of the animal are active, known as the spatial “look ahead.” Neurons with receptive fields behind the animal are more likely to be active during cycles with deceleration (Gupta et al., 2012). The spatial “look ahead” has also been shown to increase at faster running speeds (Maurer et al., 2012).
With these considerations in mind, we analyzed local field potential data from three laminae of hippocampal CA1 during traversal of a circular track or continuous alternation in relation to the data obtained from Kropff et al. (2021b). Thus, volitional ambulation under conditions of different levels of cognitive demand could be directly compared with a task in which movement was initiated and controlled by a motorized apparatus. As acceleration is the first derivative of velocity, we considered changes in theta relative to acceleration and speed simultaneously. We found that running speed was responsible for the majority of changes in both theta frequency and amplitude, with acceleration playing a minor role. While deceleration and acceleration lead to transient reductions and increases in theta frequency and power, respectively, when the interdependence of these signals is taken into consideration, velocity remains the primary driver. This observation is evident across datasets.
Materials and Methods
Database
We are grateful for the opportunity to evaluate our data against the background of a prior publication which converges onto an opposite conclusion. Datasets from six animals used in the speed clamp experiment from the Moser laboratory (Kropff et al., 2021a) were obtained from G-Node (Kropff et al., 2021b). The raw data were stored in the Axona dacqUSB format, with each dataset containing local field potential (LFP) data from hippocampal and entorhinal tetrodes, tracked position, experimental setup, and experimental log files. Only data from hippocampal tetrodes were examined here.
Subjects and behavioral training
Five young (four to nine months; two male and three female) Fischer 344 × Brown Norway F1 hybrid rats from the National Institute on Aging colony at Charles River were used for the current experiments. After arriving at our facilities, the rats were left undisturbed for one week to acclimate to the new environment. After this time, they were handled daily by experimenters. Animals were individually housed in a colony room with a reverse 12/12 h light/dark cycle so that all shaping and testing procedures were conducted in the animals' active (dark) cycle. Rats were food restricted to 85% of their ad libitum weight. Before implantation, rats were pretrained to run for a food reward (45 mg, unflavored dustless precision pellets; BioServ; product #F0021) on a circle track 1m in diameter (Fig. 1A). After reaching a criterion of at least one lap or more per minute, rats were implanted with either a custom linear 32-channel silicon probe manufactured by NeuroNexus or a linear 64-channel silicon probe manufactured by Cambridge NeuroTech. Each recording site of the NeuroNexus probes was 177 μm2 and spaced 60 μm apart, allowing for 1.86 mm of linear coverage. Recording sites of the Cambridge NeuroTech probes were 165 μm2 spaced 50 μm apart, spanning 3.15 mm. Before surgery, probes were cleaned by soaking in a solution of 4% Contrad Detergent (Decon Contrad 70 Liquid Detergent, Fisher Scientific). Soaking was done in an oven at 55°C to accelerate the cleaning process. All procedures were conducted in accordance with the guidelines specified by the National Institutes of Health Guidelines and approved by the Institutional Animal Care and Use Committee at the University of Florida.
Figure 1.
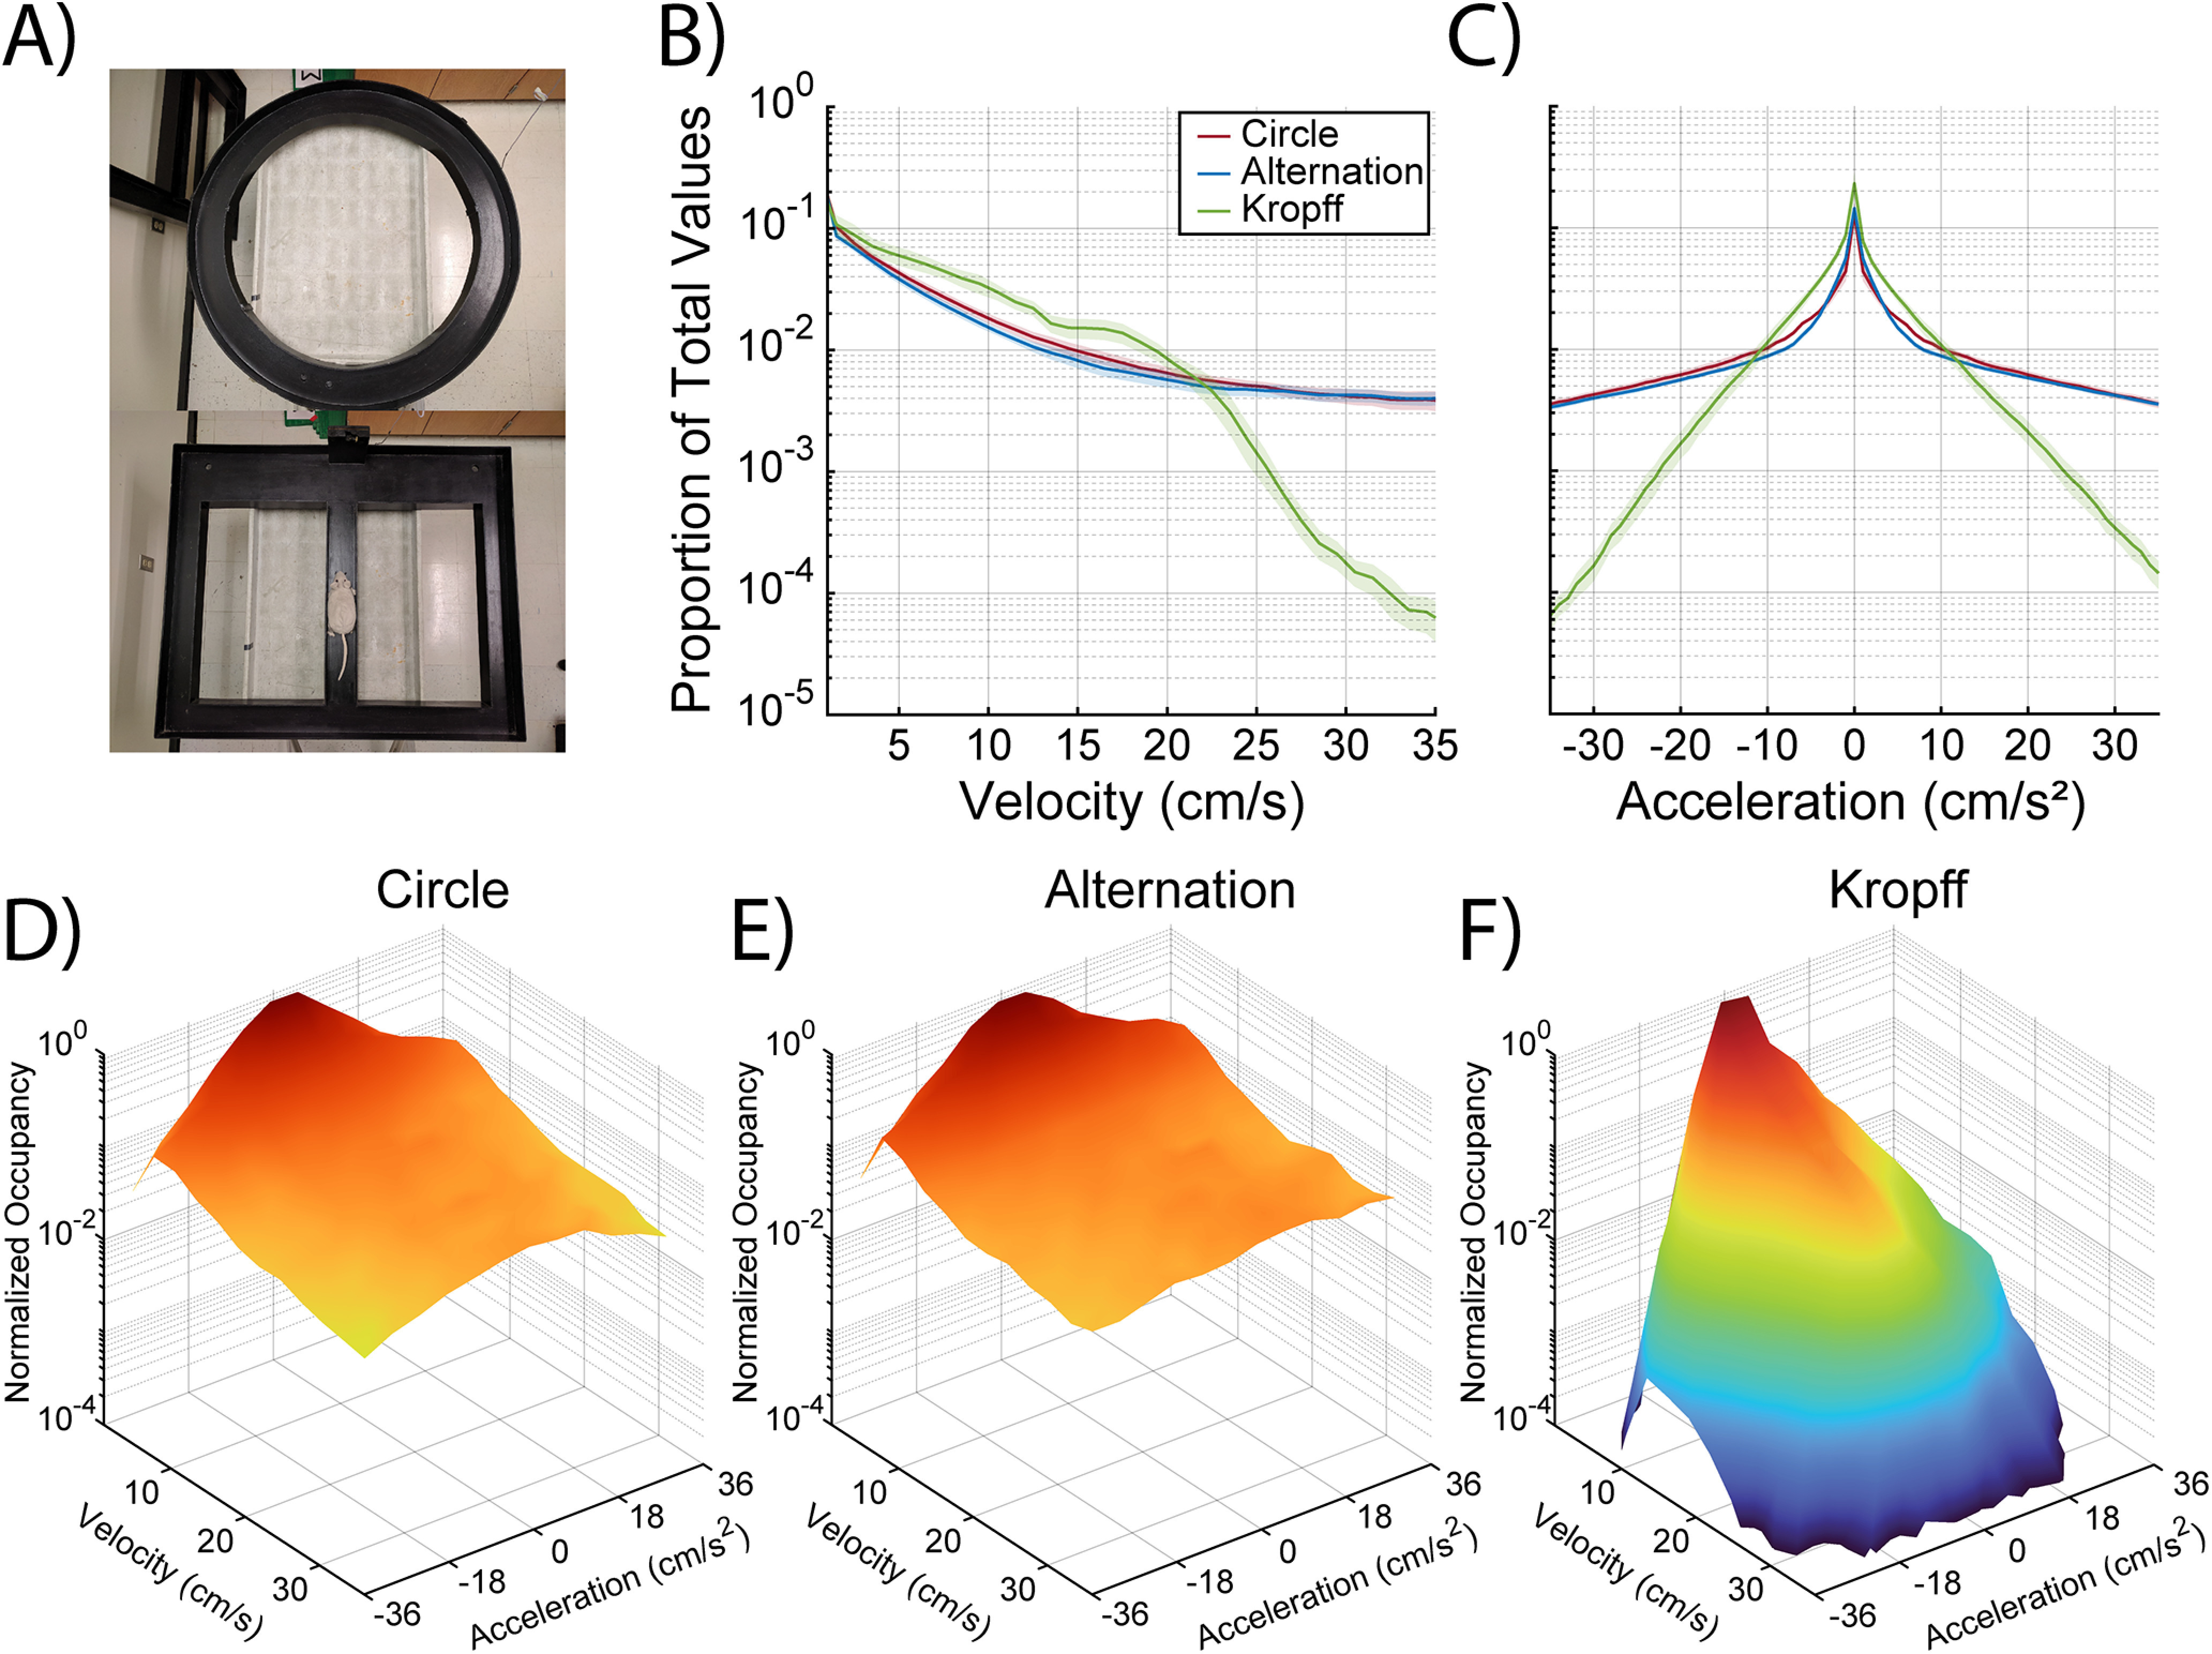
Behavioral mazes and the proportion of time spent across different velocity and acceleration values. A, Animals were trained on a circle track (top) until they completed at least 30 laps in a 25-min session. They then performed a continuous spatial alternation task (bottom). Line plots showing the proportion of time animals spent at different (B) velocities and (C) acceleration/deceleration values for both circle (red) and alternation (blue) tasks, as well as data from Kropff et al. (2021b; green) for comparison. Three-dimensional plots depicting occupancy of the full parametric space for all velocity-acceleration combinations for the (D) circle track, (E) continuous alternation task, and (F) the bottomless car task used by Kropff et al. (2021a).
Surgical procedures
All surgical procedures were conducted under general isoflurane anesthesia. Rats were placed into an induction chamber and sedated with 2.5–5% isoflurane. After verifying the loss of the righting reflex, rats were transferred to a nose cone where a sterile ocular ointment (Puralube Vet Ointment) was applied to prevent damage to the eyes. The top of the head was then carefully shaved, with extra care taken to avoid cutting whiskers. Rats were then secured into a stereotactic device with ear and incisor bars. After verifying a proper placement in the stereotactic device, a nose cone through which adjustable concentrations of isoflurane could be provided was secured around the snout to ensure sedation for the duration of the surgery. A piece of foil was taped to the end of the nose cone and cut to block light from shining directly into the rat's eyes, preventing ocular damage from excessive light exposure. Before the first incision, the site and the surrounding area was repeatedly cleaned with alternating swabs of betadine and chlorhexidine. The primary incision began just posterior to the eyes and extended slightly past the ears. Blunt dissection was used to remove the fascia attached to the skull. Bleeding was controlled via sterile saline irrigation and a battery-operated cautery pen (Bovie Medical). Stereotaxic measurements of bregma and λ were taken, and necessary adjustments were made to ensure the skull was level. After marking λ and bregma, the location of the craniotomy was determined and marked with the surgical drill or cautery. Following this, seven to eight anchor screws were placed around the target coordinates to serve as a foundation for the implant. Two of these screws were attached to a copper wire to serve as the ground and reference for the probe. The ground screw was placed over the cortex, contralateral to the implant, and the reference was placed over the cerebellum. A thin layer of adhesive luting cement (C&B Metabond; Parkell Inc.) was then applied to act as a foundation for the rest of the implant while leaving the craniotomy location uncovered. The craniotomy was completed using a 1 mm trephine drill bit. After removing the bone, the dura was carefully retracted to avoid trauma to blood vessels and the neocortex. Saline irrigation and sterile gelatin sponges (gel foam; Pharmacia & Upjohn Co) were used to mitigate bleeding.
The probe was placed in a stereotaxic holder and positioned over the craniotomy at coordinates targeting the dorsal hippocampus (AP: −3.2 mm, ML: 1.5 mm, DV: −3.7 mm from brain surface). One rat (R695) also had an identical probe implanted targeting the medial entorhinal cortex (0.5 mm anterior to the transverse sinus, ML: −4.6 mm, DV: −5.78 mm from brain surface, angled 15° posterior). However, this implant was unrelated to the current experiment, and analysis of the data collected will not be discussed here. After lowering the probe into position, the craniotomy was sealed using a bio-compatible silicone adhesive, SILASTIC (Kwik-Sil; World Precision Instruments). Dental acrylic [Grip Cement Industrial Grade, 675571 (powder) 675572 (solvent); Dentsply Caulk] was used to secure the implant to the surrounding anchor screws. A small bowl of copper mesh was constructed around the implant and secured with dental acrylic to provide physical and electrostatic discharge protection. The ground and reference wires were soldered to their respective wires attached to the probe. The ground wires were soldered to the copper mesh, while the reference wire was electrically isolated using dental acrylic.
After verifying the stability of the implant, the rats were given 10 ml of sterile saline via subcutaneous injection, as well as 1 ml/kg of a non-steroidal anti-inflammatory drug (Metacam; Boehringer Ingelheim Vetmedica). After surgery, the rats were placed under constant observation until fully ambulatory and capable of eating. Twenty-four hours after surgery, animals received a second dose of Metacam. No data were collected in the 5 d following surgery to allow the animals to recover while monitoring for any signs of behavioral abnormalities. During this period, the rats were also given oral antibiotics (Sulfamethoxazole/Trimethoprim Oral Suspension at 200 mg/40 mg per 5 ml; Aurobindo Pharma USA), which was mixed into their food daily.
Neurophysiology
Following the recovery period, rats were re-run on the circle track until normal ambulatory behavior resumed, as indicated by completing at least 30 laps in 25 min. After performing at this level for three consecutive days, the animals were moved to a spatial alternation task on a digital-8 maze (Fig. 1A). Here, rats needed to continuously alternate turning left and right after running down the center arm of the maze to receive a food reward. Electrophysiology data were recorded using a Tucker Davis Technologies Neurophysiology System with an acquisition rate of ∼24 kHz (PZ5, WS8, RV2, and RZ2). Position data were recorded by tracking red and green LEDs on the headstage at ∼30 fps with a 0.27-cm/pixel resolution. Each recording session consisted of a 25-min run period between two 25-min periods of rest in a ceramic flower pot. After data acquisition, the current source density (CSD) was used to identify the stratum pyramidale, stratum radiatum, and stratum lacunosum moleculare. CSDs were generated by calculating the second spatial derivative of both theta and ripple averaged LFP (Sheremet et al., 2019 see their Fig. 1).
Analyses and statistics
All analyses were performed in MATLAB (MathWorks) using custom-written code and libraries. Raw neurophysiology data were downsampled from ∼24 to ∼2 kHz. The analysis methods used in the current experiments have previously been described in detail (Sheremet et al., 2016, 2019) and are based on standard techniques for spectral and time series analysis (Priestley, 1981; Papoulis and Pillai, 2002). LED position data were converted into centimeters, and any gaps in position data were interpolated using the MATLAB function INPAINTN (Garcia, 2010). Initial smoothing of position data was accomplished by convolving x and y points with a Gaussian window of 0.5 s. The velocity of each rat was calculated by dividing the linear distance between adjacent points by the difference between timestamps associated with those points. Velocity was interpolated to match the ∼2-kHz sampling rate of the LFP data. Acceleration was calculated as the derivative of the velocity values. Analyses involving velocity were restricted to velocity values between 1 and 35 cm/s, while the acceleration was examined over a range of ±35 cm/s2. Both ranges were divided into 13 linearly spaced bins. These ranges were chosen to ensure sufficient and consistent sampling across the velocity and acceleration ranges for both behavioral tasks (Fig. 1B,C). It should be noted that the 3D representation of LFP power and frequency against acceleration and velocity comes with the assumption that the bin sizes we selected are approximately equal in terms of their relative contributions. LFP power and theta frequency were binned into ∼3 cm/s by ∼6 cm/s2 (12 × 12 bin matrix) to calculate the local slope. These bin sizes were generated with the time spent at each acceleration and velocity being considered (Fig. 1). Altering or distorting these box dimensions may result in different calculated slopes, weighing the respective contribution of acceleration to speed. All statistical analyses were conducted with the averages for each rat being the sample size across the different hippocampal laminae to determine the degrees of freedom and tested for significance using SPSS Statistics version 27 or MATLAB. Note, that depending on variables and datasets included in each analysis, the degrees of freedom can vary and are detailed in Results.
Publicly sourced datasets
Data obtained from G-Node were processed in the same manner as previously mentioned, with the exception that no downsampling from the native 4.8-kHz sampling rate was performed. While we present power and frequency relationships of theta in these datasets, the Kropff et al. (2021b) database offers pooled data for all hippocampal electrodes in the absence of layer localization. Theta frequency was calculated using a short-time Fourier transform. Using tracked position to determine the onset of positive or negative acceleration, average frequency and power traces were aligned using the first theta peak before acceleration onset as the zero position. The average frequency and power traces were aligned to the start points of positive and negative acceleration epochs lasting at least 0.75 s. Velocity, acceleration, power, and frequency values were averaged across datasets for an individual animal before final averaging or analysis to prevent possible inflation of power because of the number of recording sessions included (Aarts et al., 2014).
Results
The running velocity of an animal (McNaughton et al., 1983; Maurer et al., 2005), and more recently, acceleration (Long et al., 2014; Bush et al., 2017; Kropff et al., 2021a) have been reported to modulate the hippocampal theta rhythm. We, therefore, investigated the respective contribution of each component by analyzing the change in the LFP power and frequency as a function of velocity and acceleration across different CA1 lamina (stratum pyramidale, stratum radiatum, and stratum lacunosum moleculare) while rats alternated between left and right turns on a digital-8 maze (alternation condition) or traversed a circular track (circle condition). The latter behavior adds an angular acceleration component that is not as prominent during linear movement on the digital-8 maze, while the continuous alternation on the 8-maze adds additional cognitive load associated with spatial working memory. Note that different CA1 layers were examined as these correspond to distinct afferent inputs (Amaral and Witter, 1995). The synapses in the pyramidal cell layer are predominantly from basket cells, and the stratum radiatum is the layer that corresponds to CA3 input, while the stratum lacunosum moleculare receives input from the entorhinal cortex as well as vestibular input relayed through the thalamus (Amaral and Witter, 1995; Aitken et al., 2017b).
Figure 1B,C shows the average log-linear occupancy histograms across different velocity (Fig. 1B) and acceleration (Fig. 1C) values while rats alternated (blue lines) or traversed the circle track (red lines). Data from Kropff et al. (2021b) are shown in green for comparison. Figure 1D–F combines the velocity and acceleration histograms into a 3D plot comparing our data (Fig. 1D,E) to that of Kropff et al. (2021b; Fig. 1F). There was sampling in the velocity (1–35 cm/s), and acceleration/deceleration ranges (±36 cm/s2) analyzed across all tasks in the present manuscript. Notably, higher velocities (>25 cm/s) and accelerations (larger than ±15 cm/s2) were relatively under sampled in the bottomless car task compared with the other two tasks.
Figure 2 shows the power spectral density of the hippocampal CA1 LFP as a function of velocity (first two columns) and acceleration/deceleration (last three columns) during circle track running for the different CA1 laminae: stratum pyramidale (PYR; Fig. 2A–E), stratum radiatum (RAD; Fig. 2F–J), and stratum lacunosum moleculare (LM; Fig. 2K–O). Note that both power and frequency increase with velocity in the theta frequency range at faster running velocities. The modulation by velocity is also observed in the theta harmonics, as previously observed (Sheremet et al., 2016). The first-order, second-order, and third-order theta harmonics were present across acceleration values, and there was a slight tendency for theta power and frequency to increase with greater amounts of acceleration. However, the sensitivity of the power spectrum to acceleration did not appear to match what is observed with velocity. Figure 3 shows the same power spectral density plots across CA1 lamina for velocity and acceleration but during the continuous alternation task. Regardless of the task, the patterns of the data appear qualitatively similar.
Figure 2.
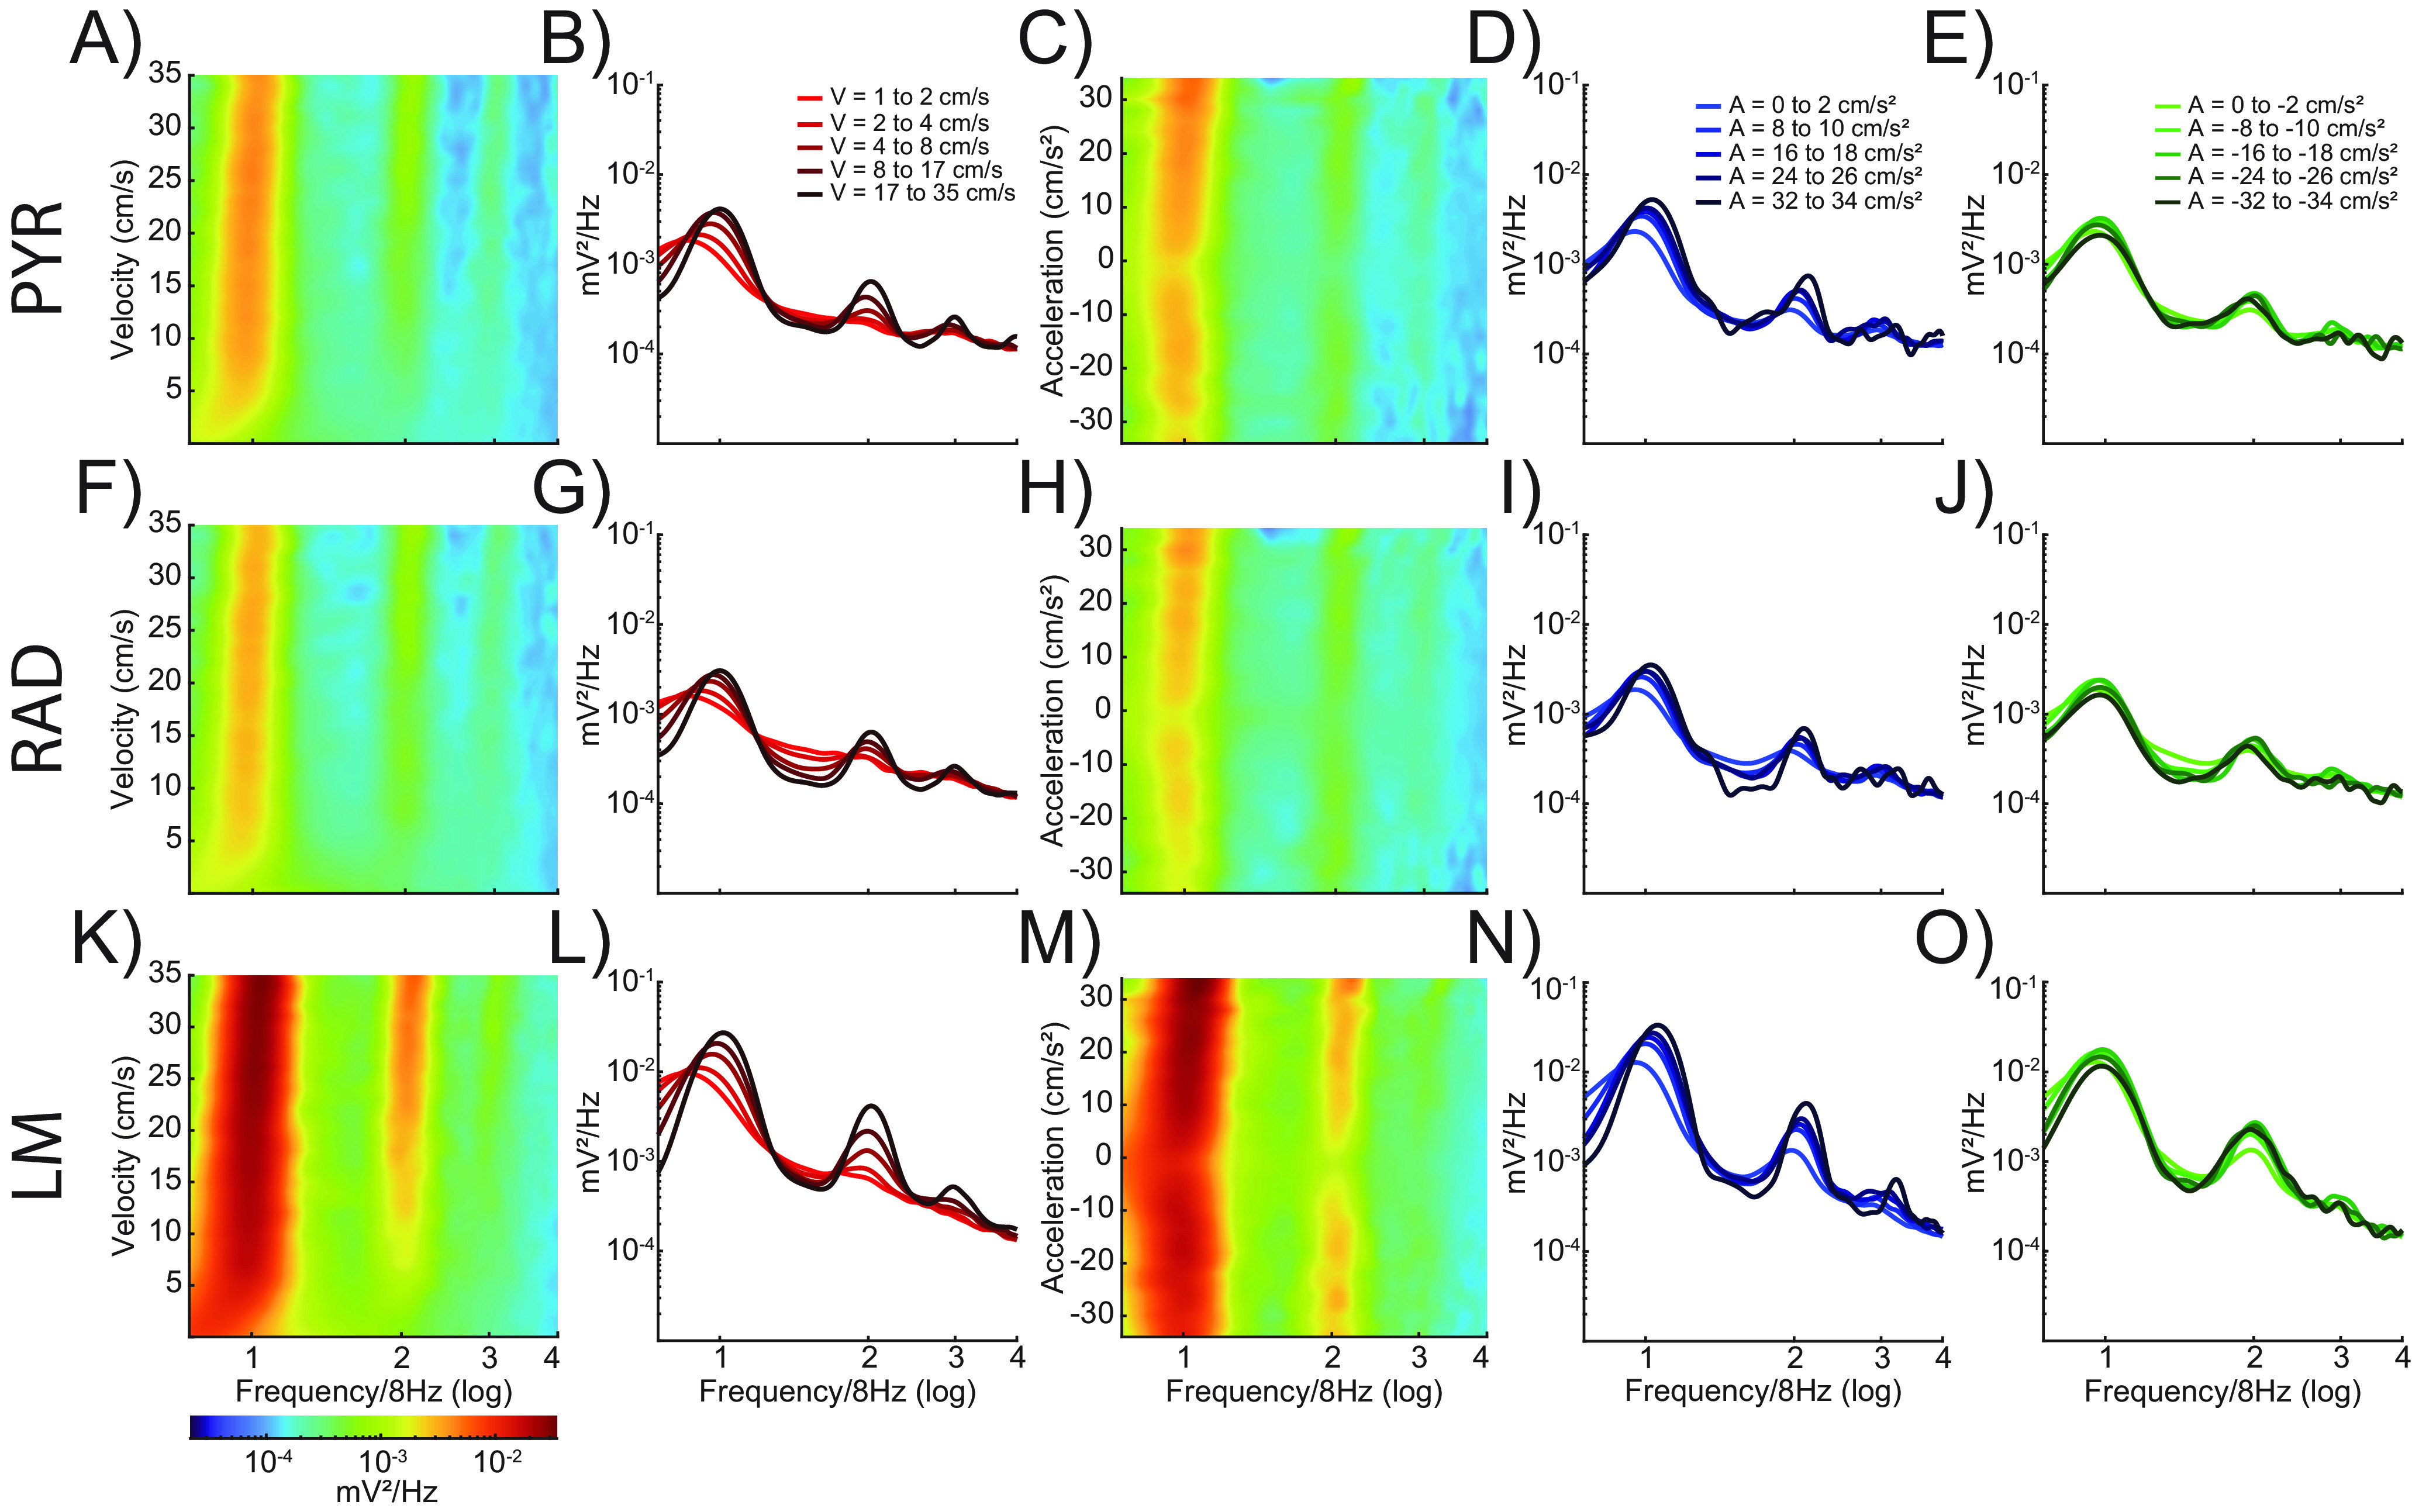
Power spectral density by velocity and acceleration across CA1 lamina during circle track running. Power spectral density as a function of velocity (columns 1 and 2) and acceleration (columns 3–5) on the circle track. Spectrogram plots showing LFP power as a function of velocity or acceleration and frequency for three CA1 laminae (stratum pyramidale, A–E; stratum radiatum, F–J; stratum lacunosum moleculare, K–O). Warmer colors indicate higher power. Line plots show power versus frequency at five different values for velocity (B, G, L), positive acceleration (D, I, N), and negative acceleration (E, J, O). Increasing magnitude of velocity or acceleration is shown as changes in color intensity, with lighter lines corresponding to lower velocities or accelerations and darker lines indicating higher values. Theta power and frequency increase as a function of both velocity and acceleration; however, the change is much greater and more consistent with respect to velocity.
Figure 3.
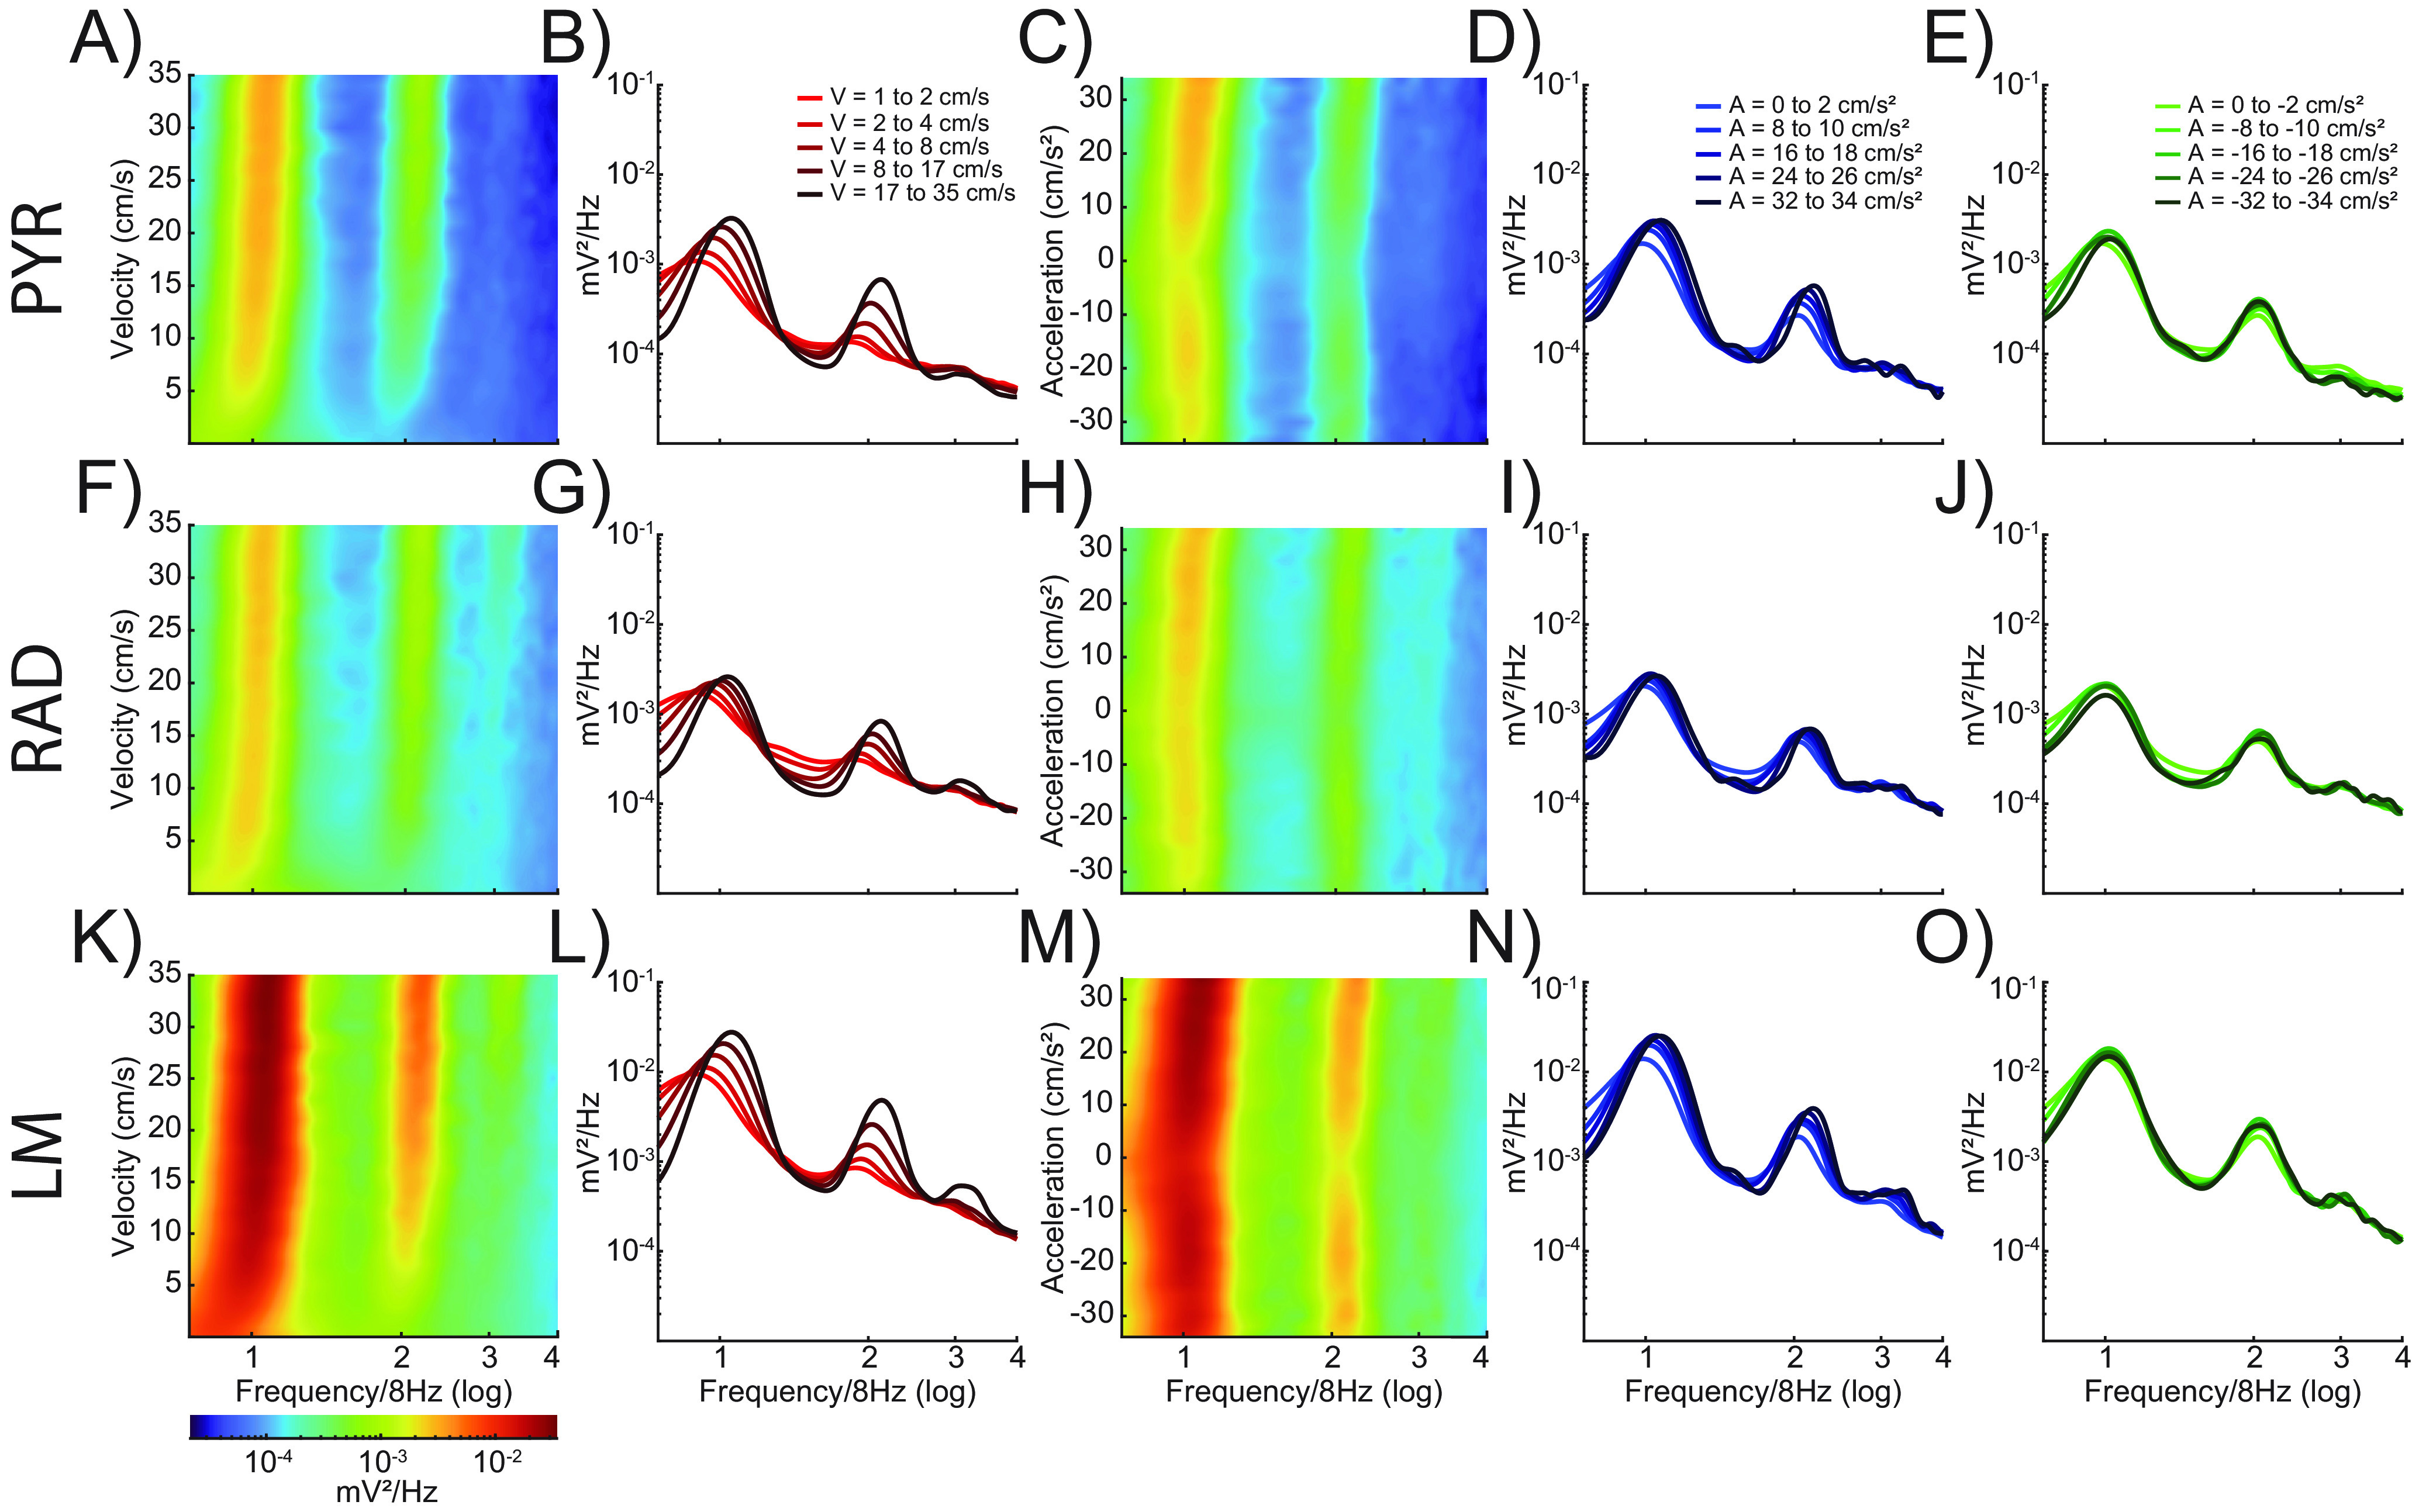
Power spectral density by velocity and acceleration across CA1 lamina during the continuous alternation task. Power spectral density as a function of velocity (columns 1 and 2) and acceleration (columns 3–5) on the circle track. Spectrogram plots showing LFP power as a function of velocity or acceleration and frequency for three CA1 laminae (stratum pyramidale, A–E; stratum radiatum, F–J; stratum lacunosum moleculare, K–O). Warmer colors indicate higher power. Line plots show power versus frequency at five different values for velocity (B, G, L), positive acceleration (D, I, N), and negative acceleration (E, J, O). Increasing magnitude of velocity or acceleration is shown as changes in color intensity, with lighter lines corresponding to lower velocities or accelerations and darker lines indicating higher values. Theta power and frequency increase as a function of both velocity and acceleration; however, the change is much greater and more consistent with respect to velocity.
It is conceivable that the power-velocity and power-acceleration relationships could vary between conditions with and without an angular acceleration component or with and without cognitive load. To explore this possibility, we examined the power-velocity and power-acceleration correlations across track running conditions. Figure 4 shows shaded error line plots of power versus velocity (Fig. 4A–D), frequency versus velocity (Fig. 4E–H), power versus acceleration (Fig. 4I–L), and frequency versus acceleration (Fig. 4M–P) during the circle track running (red) and alternation (blue) conditions for three hippocampal laminae, as well as data from Kropff et al. (2021b; laminae unknown; green). The slopes and the R2 values for the velocity-power, acceleration-power, velocity-frequency, and acceleration-frequency relationships were compared across laminae and track running conditions using ANOVA with the factors of laminae (PYR, RAD, and LM) and task condition (circle track vs alternation) for acceleration and deceleration separately. There was no significant difference in the power-velocity relationship between circle track and alternation running conditions in either the R2 values (F(1,24) = 1.32, p = 0.62) or the slope (F(1,24) = 0.02, p = 0.97). There was also no significant difference in the power-acceleration relationship between tasks with either the R2 values (F(1,24) = 0.002, p = 0.97) or the slope (F(1,24) = 0.01, p = 0.92). The lack of an effect of task was also evident for the deceleration-power relationship (R2: F(1,24) = 0.58, p = 0.57; slope: F(1,24) = 4.04, p = 0.06). This suggests that despite differences in angular acceleration and cognitive load between tasks, theta power was modulated similarly across tasks.
Figure 4.
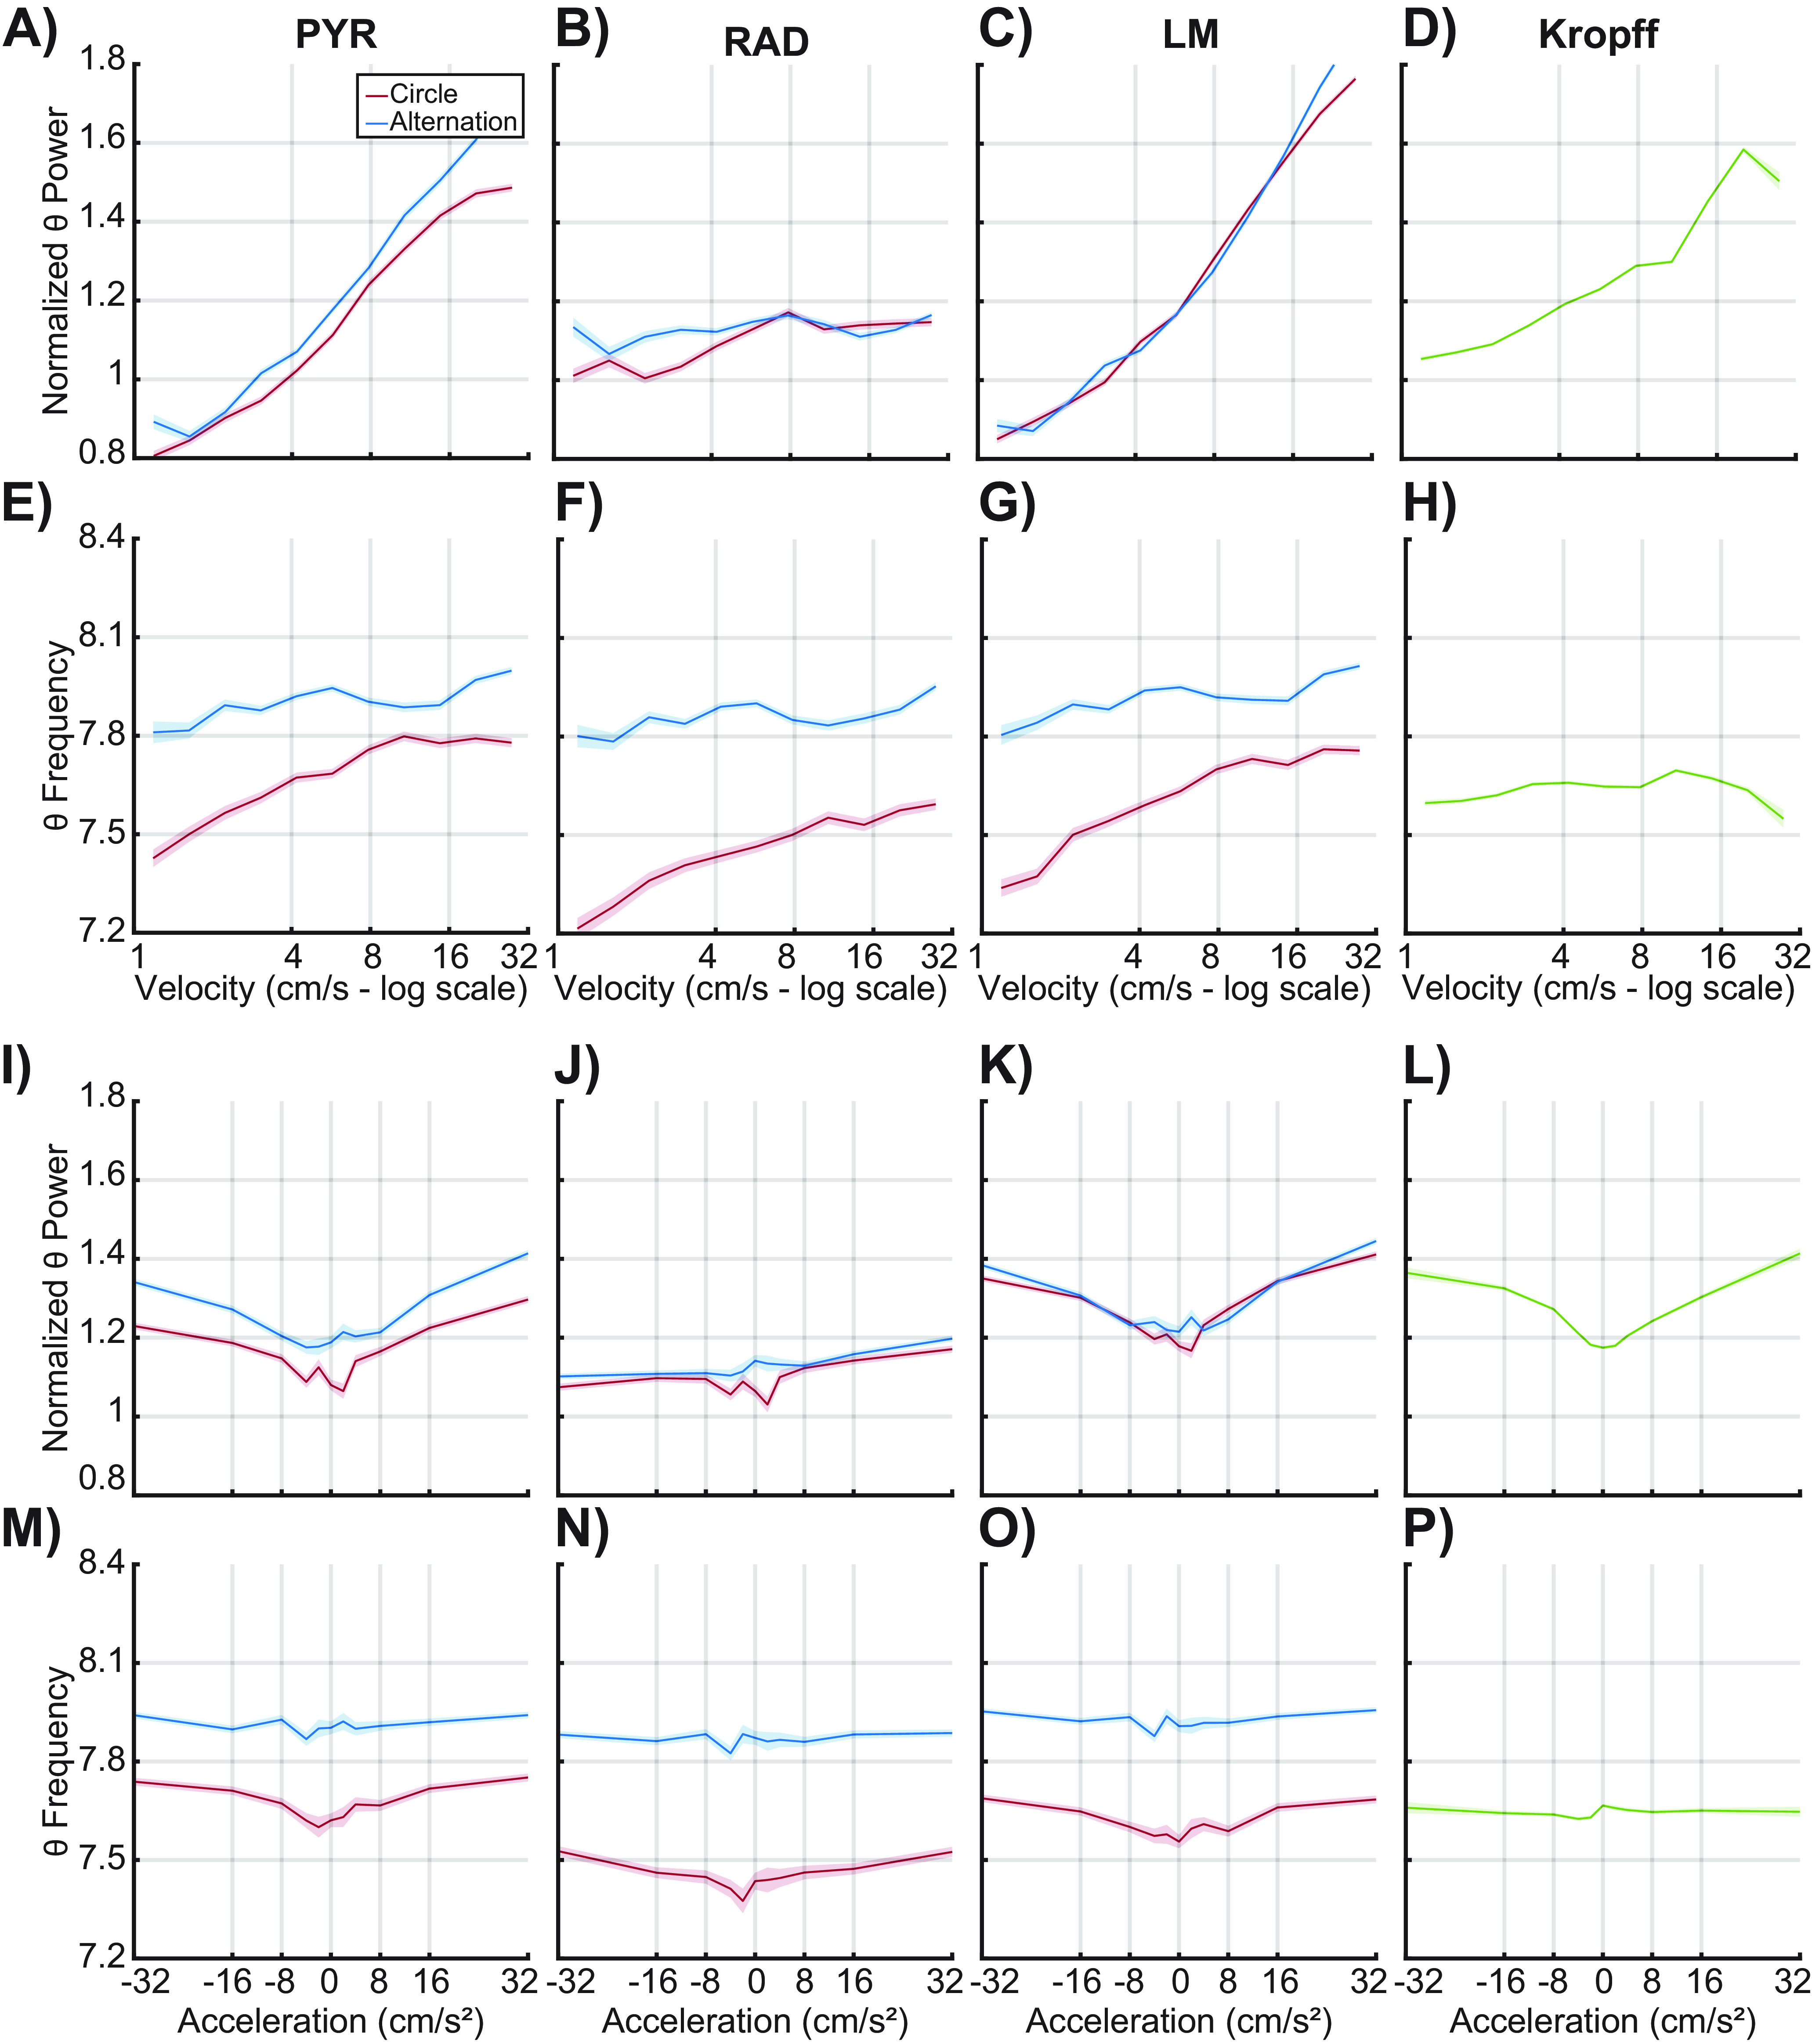
Normalized theta power of CA1 LFP by velocity and acceleration. Average of normalized theta power by velocity and acceleration for three CA1 laminae (stratum pyramidale, A, E, I, M; stratum radiatum, B, F, J, N; stratum lacunosum moleculare, C, G, K, O) as well as hippocampal data from Kropff et al. (2021b) for comparison (D, H, L, P). Dark lines correspond to the average of each velocity bin, while the shaded areas represent the standard error of the mean. The data from each behavioral condition is shown (circle: red, alternation: blue). There was no statistical difference found between the two conditions (see text). Logarithmically spaced bins were used to highlight the log-linear relationship between LFP theta power and velocity. Note that the velocity axes are log-scaled, while the acceleration axes are scaled linearly to show both positive and negative acceleration values.
When the R2 and slopes for theta power modulation were examined across layers, however, there were significant differences in both the R2 values (F(2,24) = 17.04, p < 0.001, effect size = 0.60) and slopes (F(2,24) = 17.42, p < 0.001, effect size = 0.59) for the velocity-power relationship. This was because of the weaker velocity-power relationships in the radiatum compared with the pyramidal cell and lacunosum moleculare layers (p < 0.05 for both comparison). For acceleration, there was also a significant effect of layer on the power-acceleration relationship for the slope (F(2,24) = 4.44, p = 0.02, effect size = 0.27) but not the R2 (F(2,24) = 0.71, p = 0.50) values. Finally, there was not a significant effect of layer for the deceleration-power relationship for either R2 (F(2,24) = 0.58, p = 0.57) or slope (F(2,24) = 0.12, p = 0.89). The interaction between layer and task did not reach statistical significance for any power comparison (p > 0.2 for all comparisons).
In contrast to power, there was a significant effect of task on theta frequency modulation by velocity. As evident in Figure 4E–G,M–O, theta frequency was higher during the continuous alternation than circle track running. While task order cannot be ruled out as contributing to this, it is also conceivable that higher cognitive load required during alternation resulted in higher theta frequency for a given running speed. Although the slopes of the theta frequency by velocity relationship did not significantly vary between tasks (F(1,24) = 1.02, p = 0.31), the R2 values were significantly higher during alternations compared with circle track running (F(1,24) = 6.70, p = 0.02, effect size = 0.22). This observation suggests that the running speed accounts for significantly more variance in theta frequency during the continuous alternation task compared with circle track running. The velocity-frequency relationship did not significantly differ across layers, nor did CA1 laminae significantly interact with task type (p > 0.1 for all comparisons).
As discussed above, velocity and acceleration modulation of theta power varies across CA1 laminae. Thus, the influence of velocity and acceleration on theta power could not be directly compared across datasets because of the unknown recording location in Kropff et al. (2021b) with respect to CA1 laminae. The modulation of theta frequency by velocity, acceleration, or deceleration, however, was directly compared by adding rats from the Kropff data and increasing the sample size. Across all datasets, the slopes (F(2,26) = 159.03, p < 0.001, effect size = 0.92) and the R2 (F(2,26) = 146.22, p < 0.001, effect size = 0.92) values were significantly greater for the velocity-frequency relationship compared with the acceleration/deceleration-frequency relationship. While these analyses suggest that velocity explains more variance in both theta power and frequency across tasks and datasets, this analysis does not fully account for the interdependence of velocity and acceleration. Another approach to explore the extent to which acceleration and speed are related to theta would be to implement multiple linear regression. However, as acceleration is the derivative of speed, their interdependence introduces multicollinearity and violates the assumptions of multiple linear regression analysis. Therefore, we quantified changes in LFP power, accounting for the speed and acceleration in tandem (rather than independently).
3D plots of these variables were generated to create a surface that defines the interaction between velocity and acceleration for the stratum pyramidale (PYR; Fig. 5A), stratum radiatum (RAD; Fig. 5B), and the stratum lacunosum moleculare (LM; Fig. 5C). Because theta power did not differ between the circle track and alternation tasks, data from these two conditions were combined. The white arrows in Figures 5D–F show the instantaneous slope for each point on the surface of the corresponding 3D plot for the respective CA1 lamina. The arrows' direction indicates the approximate contributions of velocity versus acceleration at that location on the 3D plot. A completely horizontal arrow (0°) indicates a power slope influenced entirely by velocity. Conversely, a vertical arrow (±90°) would indicate a slope influenced only by acceleration. The length of each vector indicates the strength of this relationship. Using this metric, we calculated the approximate contributions of velocity and positive and negative acceleration on the slope of the LFP power, and these are summarized for each CA1 layer in the polar plots shown in Figure 5G–I. Data are shown individually by rat, with the average indicated by the large black arrow. Two observations are evident from these plots. First, in the stratum pyramidale and lacunosum moleculare, the slope of all vectors is closer to 0° than 90°, indicating a greater relative influence of velocity on LFP power than acceleration. Second, there is no consistent relationship between velocity and acceleration and LFP power in the stratum radiatum, where CA3 input terminates. This is evident by the relatively small vector magnitudes (<0.008) for both the positive and negative accelerations. Consistent with this observation, vector magnitude significantly differed across the three CA1 layers for both acceleration (F(2,24) = 7.96, p = 0.002, effect size = 0.40), and deceleration (F(2,24) = 8.77, p = 0.001, effect size = 0.42). Post hoc analysis indicated that the magnitude was significantly greater for the stratum lacunosum moleculare compared with the pyramidale and radiatum (p < 0.05 for all comparisons, Tukey). When acceleration and deceleration where included in the same statistical model (df = 48), the magnitude was not significantly different between positive and negative acceleration (F(1,48) = 0.21, p = 0.65), and this was true for all layers as indicated by the lack of a significant interaction effect between acceleration and layer (F(2,48) = 0.42, p = 0.96). Because the stratum radiatum did not show a significant vector magnitude, this layer was excluded in the comparison of vector angles, which decreased the degrees of freedom. The vector degree for theta power did not significantly differ between positive and negative acceleration (F(1,32) = 2.24, p = 0.14). Moreover, the vector angle did not significantly differ between the stratum pyramidale and the lacunosum moleculare (F(1,32) = 2.56, p = 0.12), and there was not a significant layer by acceleration interaction (F(1,32) = 0.39, p = 0.55). Overall, these observations suggest velocity modulates theta power to a greater extent than acceleration and deceleration in both the pyramidal cell and lacunosum moleculare layers.
Figure 5.
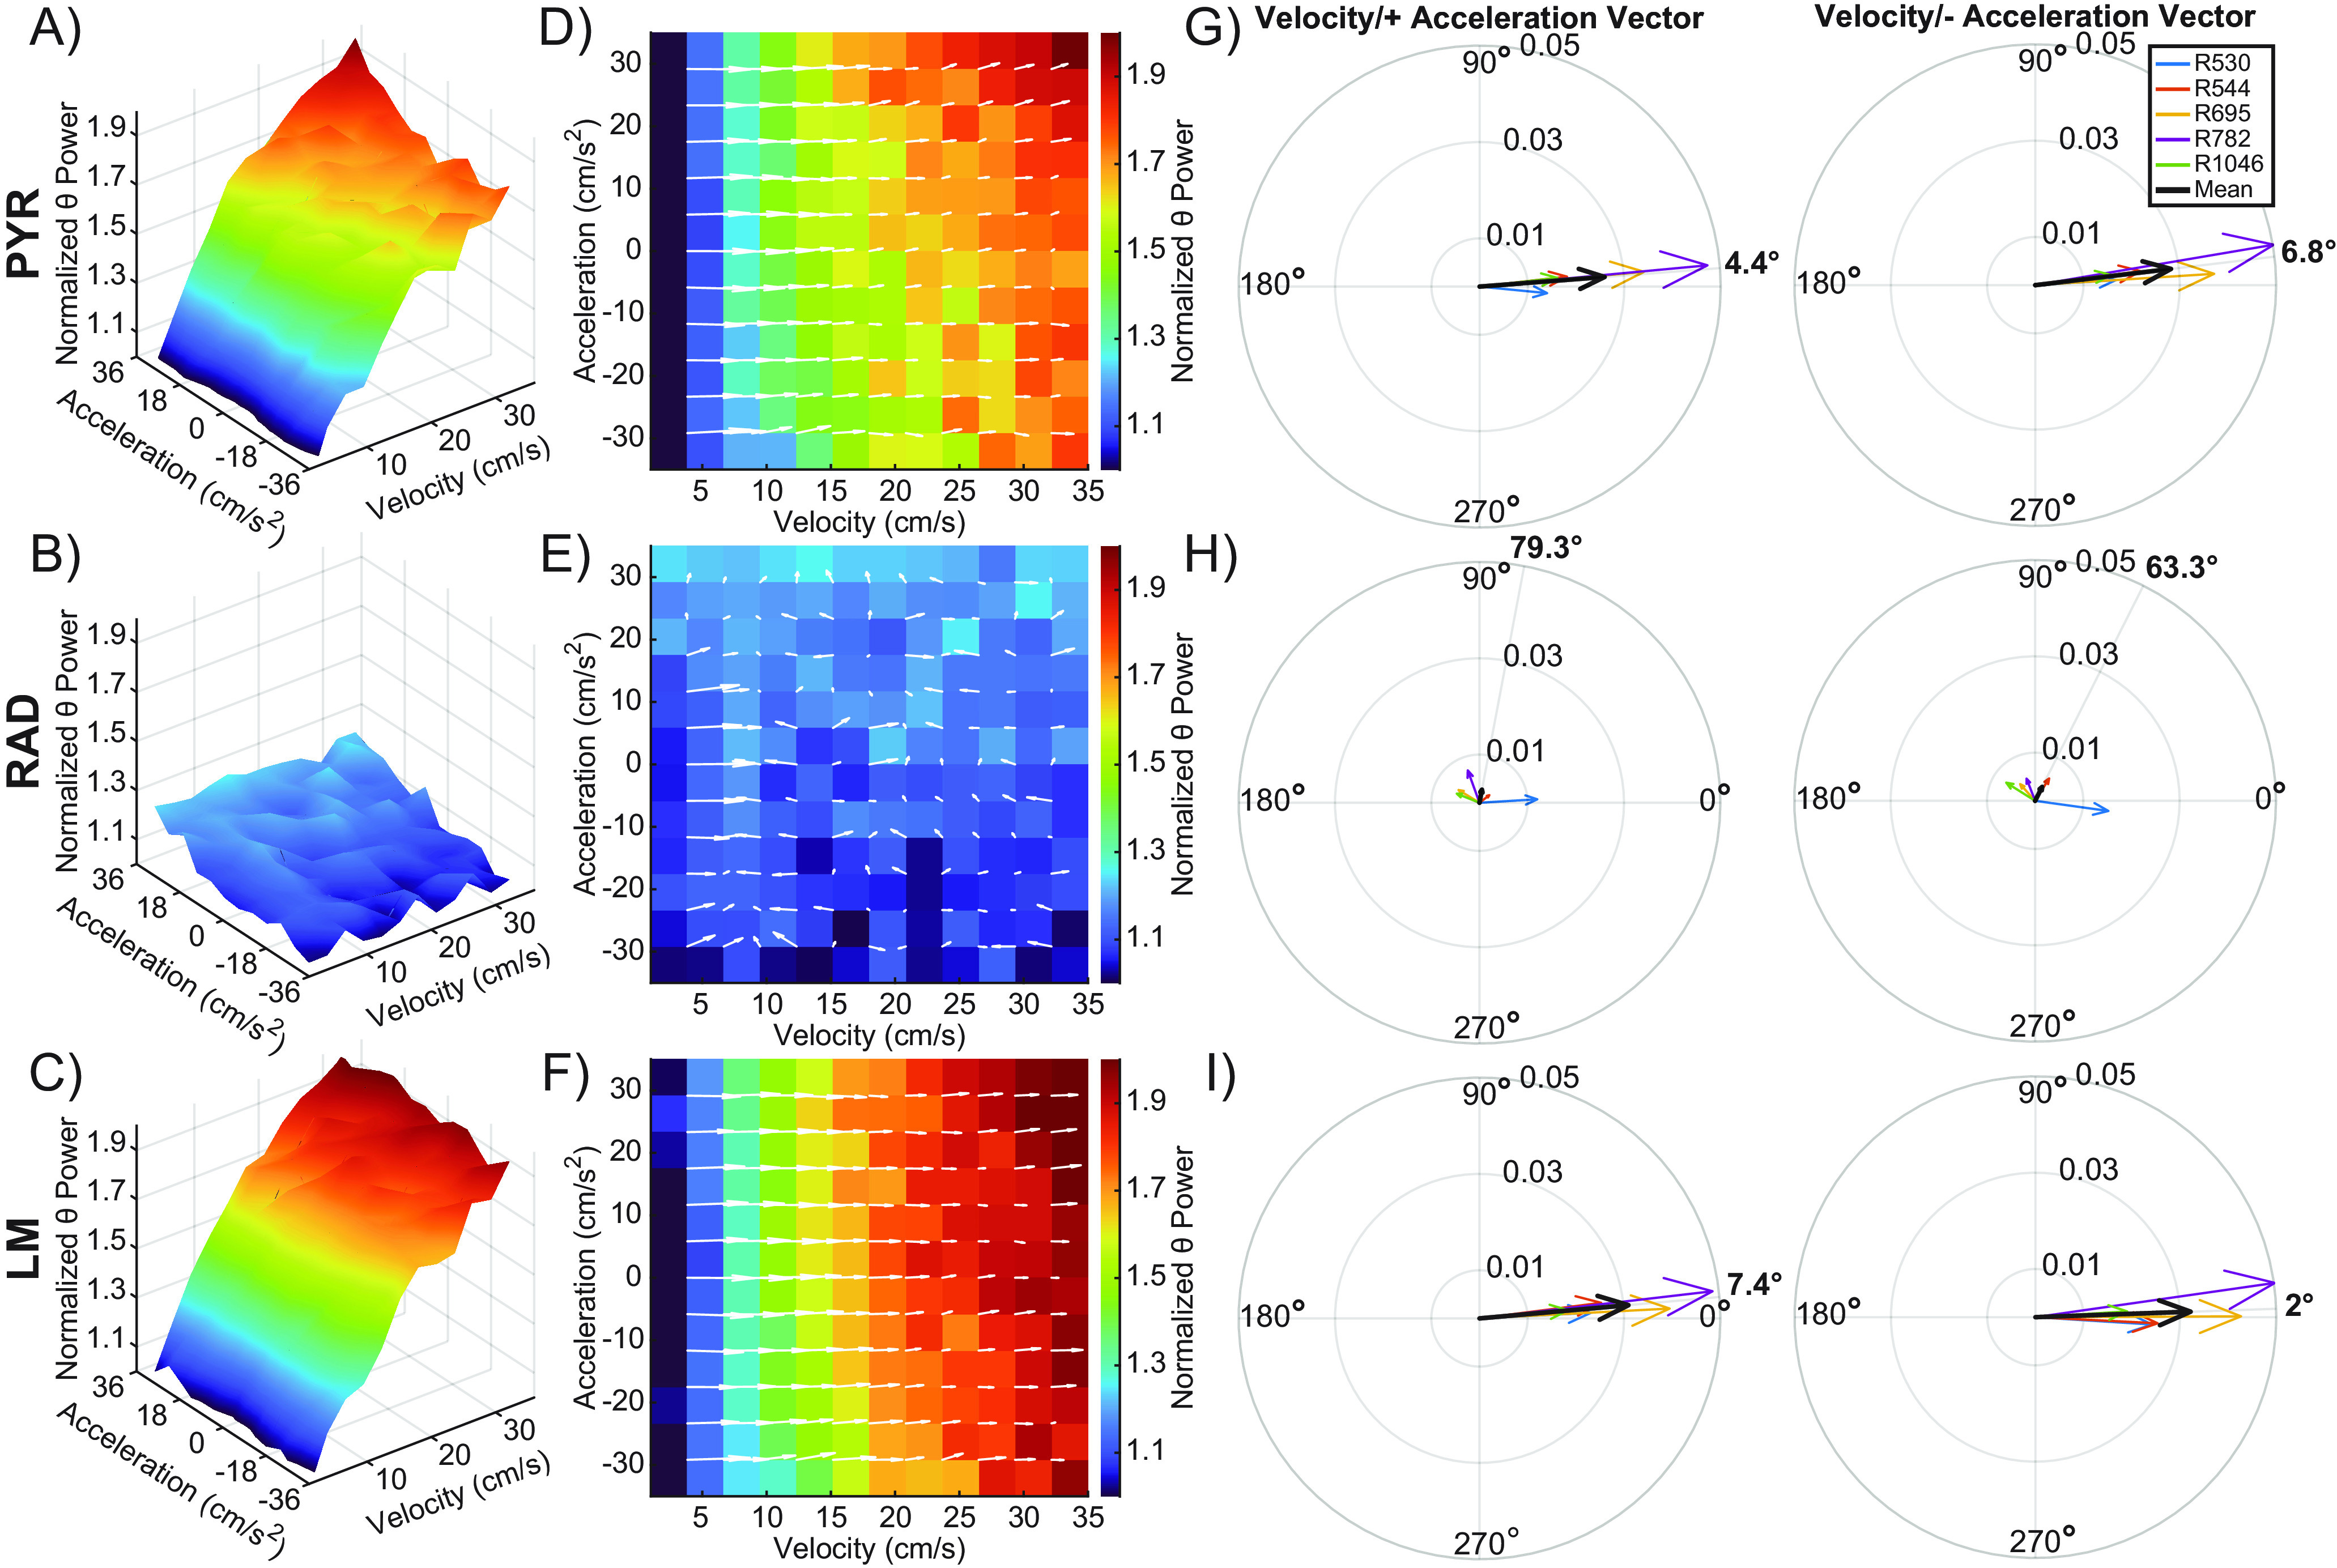
Velocity and acceleration modulation of theta power. A–C, 3D plots showing the interaction between velocity, acceleration, and normalized theta power for the stratum pyramidale (PYR; A), stratum radiatum (RAD; B), and the stratum lacunosum moleculare (LM; C) across all animals. A robust linear regression was fit to a plot of theta power versus velocity for LFP data from three hippocampal layers of each rat. The y-intercept given by the model was used to normalize theta power. D–F, 2D figures representing the top-down view of the 3D surface. Overlaid white arrows show the direction and magnitude of the local slope. G–I, Compass plots showing the average of the slope vectors (white arrows) from plots D–F. An average vector was generated for both the positive and negative acceleration halves of each plot. The average of each animal is shown in various colors, with the cohort mean shown in black. The angle of the cohort means are shown in bold outside of each compass plot. Note that vector angles close to 0° indicate that theta power was primarily modulated by velocity. As the vector angle increases toward 90°, acceleration makes more of a contribution.
We also explored the relationship between theta frequency and both velocity and acceleration through the implementation of calculating a 3D surface (Figs. 6A–C, 7A–C) along with deriving the local slope values for each layer (Figs. 6D–F, 7D–F), as we did for power. Because there was an effect of task (circle track vs alternation) on theta frequency, these plots were made separately for the two different behavioral conditions. Figure 6 depicts the data from circle track running, while Figure 7 shows the data from continuous alternations. Again, contributions of velocity and positive/negative acceleration on the slope of theta frequency were calculated for each CA1 layer, including the task variable. Vector magnitude for the influence of velocity and acceleration on theta frequency did not significantly differ across the three CA1 layers (F(2,48) = 1.58, p = 0.22), nor did this significantly vary across tasks (F(2,48) = 0.02, p = 0.91). The vector magnitude was also comparable between positive and negative acceleration (F(1,48) = 2.35, p = 0.13), and this was true for all layers as indicated by the lack of a significant interaction effect between acceleration and layer (F(2,48) = 0.22, p = 0.80). The vector degree also did not significantly vary by CA1 layer (F(2,48) = 0.60, p = 0.55), suggesting that velocity made a larger contribution than acceleration to theta frequency across all CA1 lamina. However, the vector angle did significantly differ between tasks (F(2,48) = 11.95, p < 0.01, effect size = 0.20), with the angle being modestly larger during circle track running compared with alternation. This observation suggests that during circle track running, there is a tendency for acceleration to contribute more to the modulation of theta frequency than during alternation. This is conceivably because of the angular acceleration signal from the semicircular canals that may be prominent when running in a circle but not during linear acceleration. Interestingly, the vector degree was significantly greater for negative acceleration compared with positive acceleration (F(2,48) = 28.89, p < 0.001, effect size = 0.38), indicating that deceleration played a larger role in modulating theta frequency than acceleration. This observation was consistent across all layers, as indicated by the lack of a significant interaction effect between acceleration and layer (F(2,48) = 0.01, p = 0.90).
Figure 6.
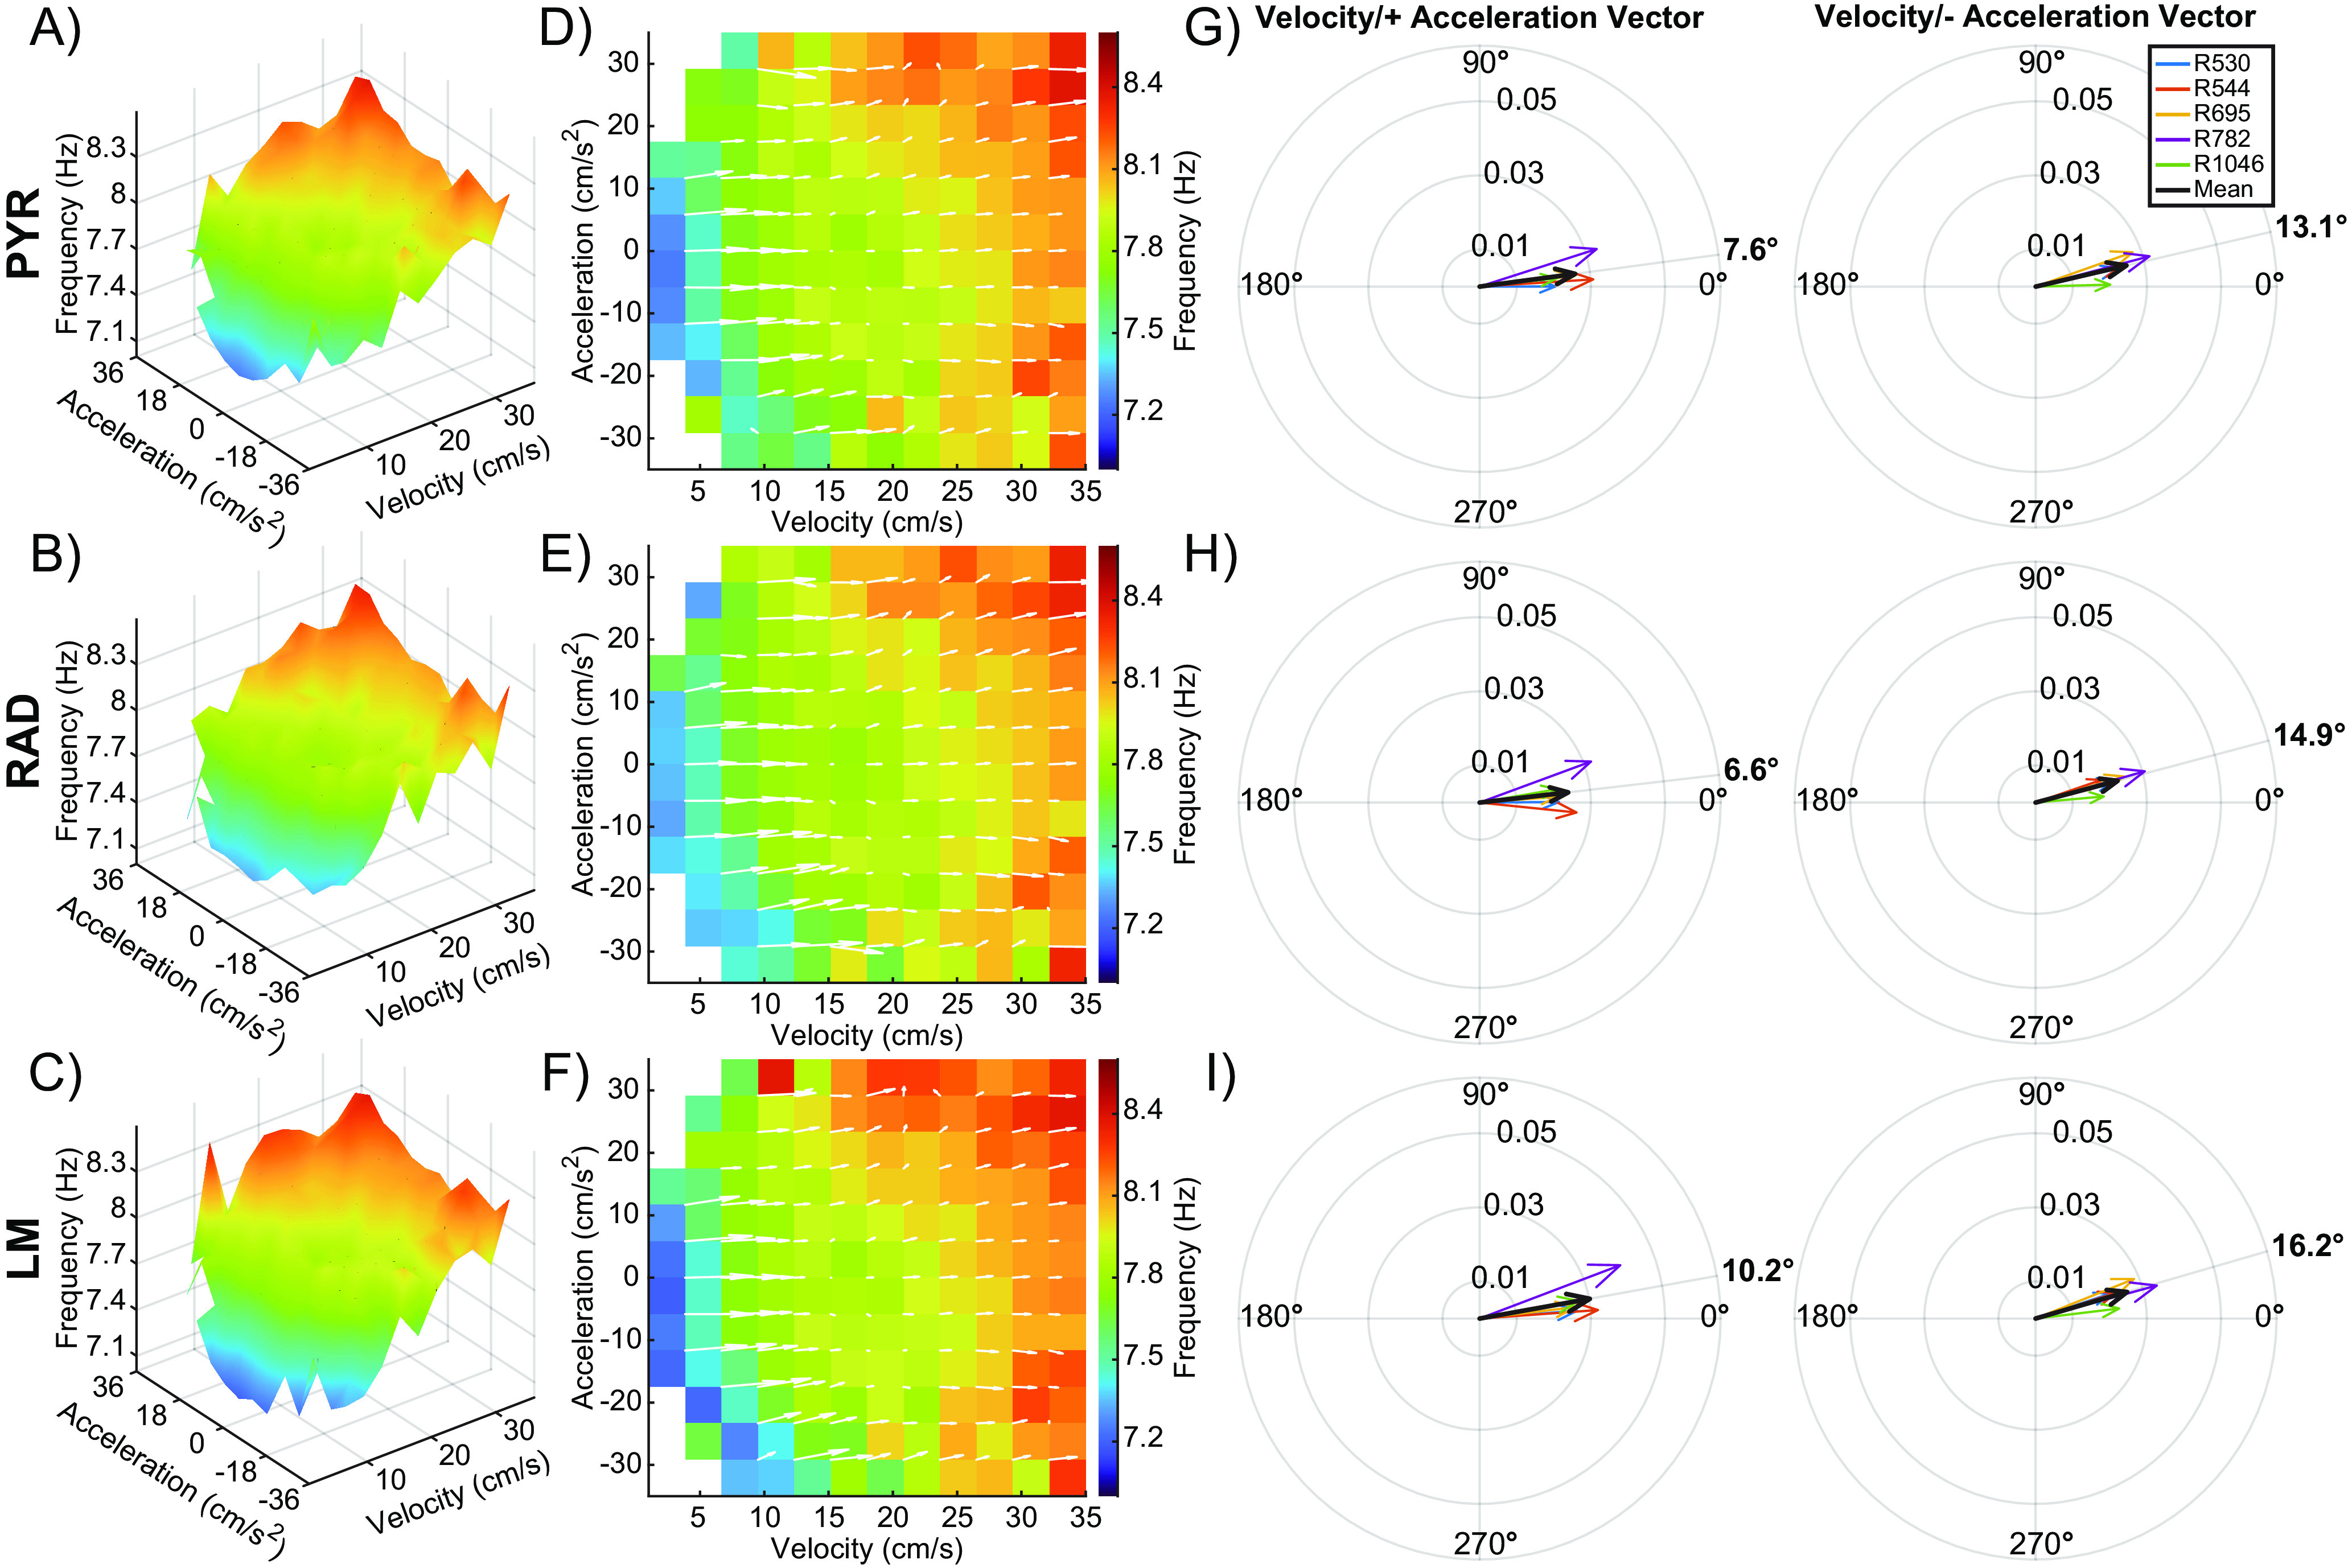
Velocity and acceleration modulation of theta frequency during the circle task. A–C, Note that this figure is the same as Figure 5, but for a theta frequency rather than power. 3D plots showing the interaction between velocity, acceleration, and theta frequency for the stratum pyramidale (PYR; A), stratum radiatum (RAD; B), and the stratum lacunosum moleculare (LM; C) across all animals. D–F, 2D figures representing the top-down view of the 3D surface. Overlaid white arrows show the direction and magnitude of the local slope for each possible velocity and acceleration bin combination. G–I, Compass plots showing the average of the slope vectors (white arrows) from plots D–F. An average vector was generated for both the positive and negative acceleration halves of each plot. The average of each animal is shown in various colors, with the cohort mean shown in black. The angle of the cohort means are shown in bold outside of each compass plot. Note that vector angles close to 0° indicate that LFP frequency was primarily modulated by velocity. As the vector angle increases toward 90°, acceleration makes more of a contribution.
Figure 7.
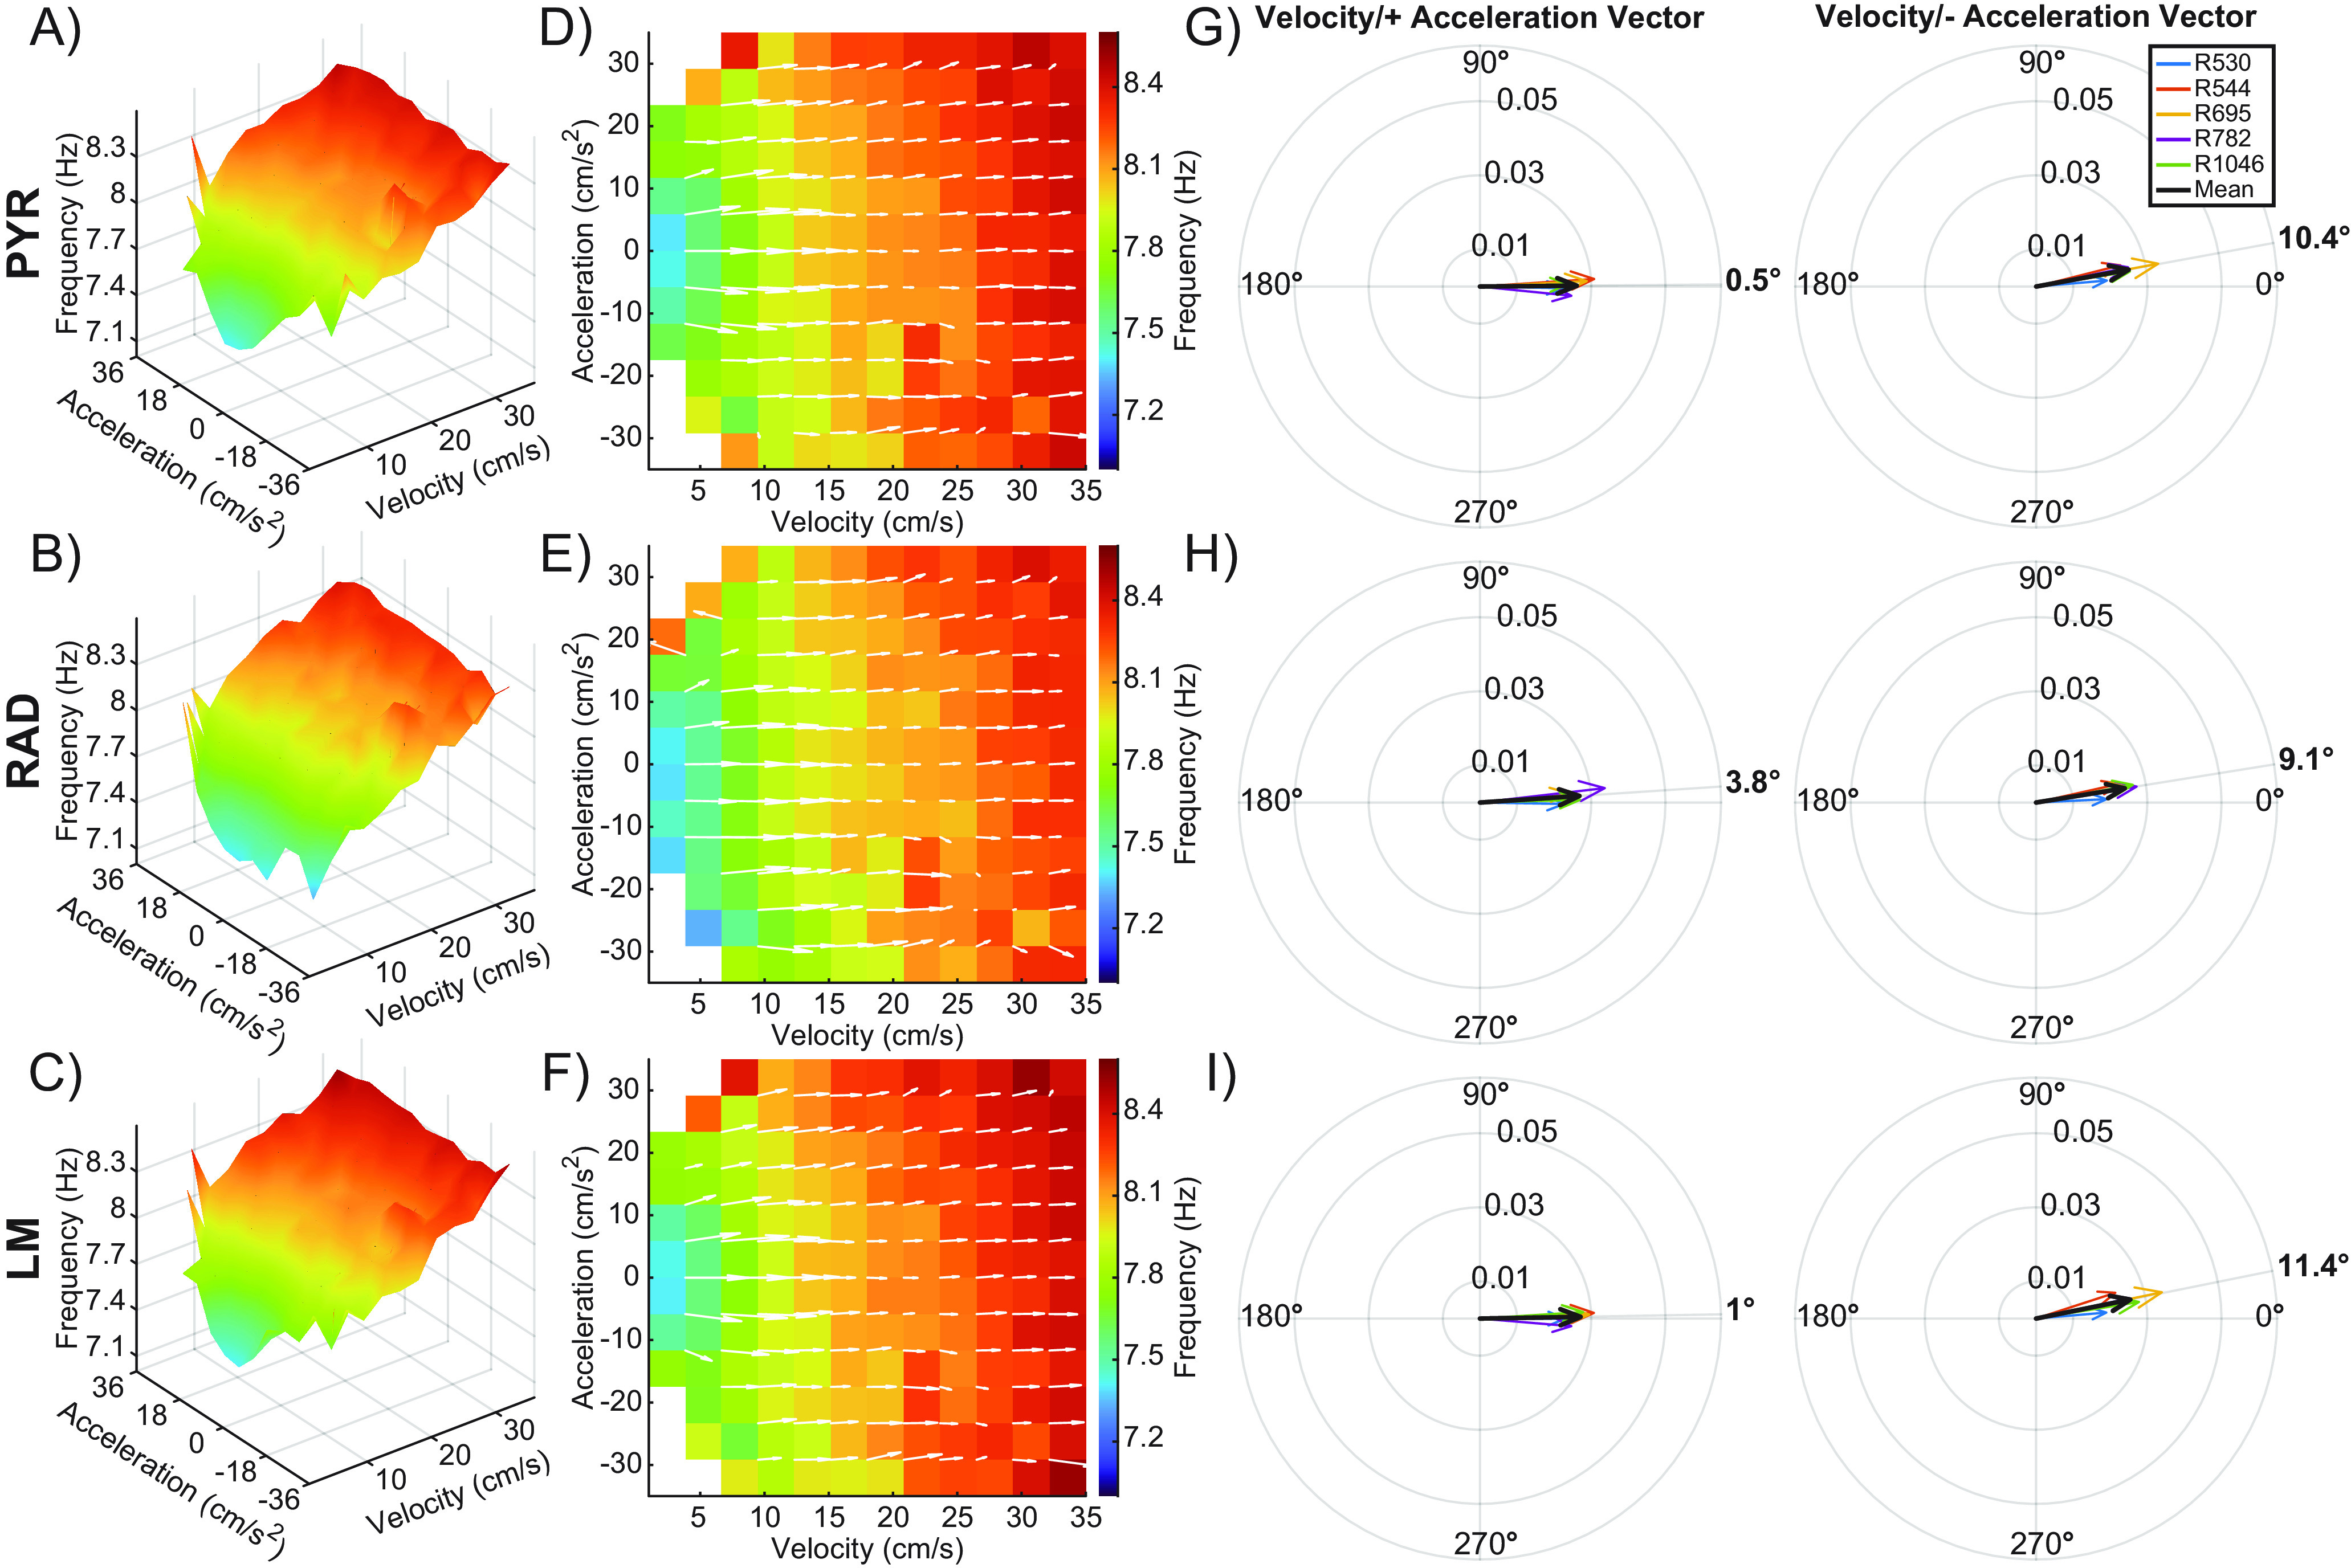
Velocity and acceleration modulation of theta frequency during the alternation task. A–C, Note that this figure is the same as Figure 6, but for a theta frequency rather than power. 3D plots showing the interaction between velocity, acceleration, and theta frequency for the stratum pyramidale (PYR; A), stratum radiatum (RAD; B), and the stratum lacunosum moleculare (LM; C) across all animals. D–F) 2D figures representing the top-down view of the 3D surface. Overlaid white arrows show the direction and magnitude of the local slope for each possible velocity and acceleration bin combination. G–I, Compass plots showing the average of the slope vectors (white arrows) from plots D–F. An average vector was generated for both the positive and negative acceleration halves of each plot. The average of each animal is shown in various colors, with the cohort mean shown in black. The angle of the cohort means are shown in bold outside of each compass plot. Note that vector angles close to 0° indicate that LFP frequency was primarily modulated by velocity. As the vector angle increases toward 90°, acceleration makes more of a contribution.
As these results stood in contrast to a recent publication suggesting that the frequency of theta rhythm is controlled by acceleration but not speed in running rats (Kropff et al., 2021a), we were grateful for the opportunity to re-explore and further analyze their data. Figures 8A–F show the 3D plots of the interaction between velocity, acceleration, and theta power and the corresponding 2D surface plots. As theta power and its modulation by velocity and acceleration vary across CA1 laminae and the CA1 laminar location of LFP recordings from the Kropff et al. (2021b) dataset was transparently reported by the authors to be unknown, data for individual animals are shown separately. The summary data are represented in the polar plots for positive (Fig. 8G) and negative (Fig. 8H) acceleration. For the modulation of theta power in the Kropff et al. (2021b) data, the vector magnitudes were smaller than what was observed in the current data for the pyramidal cell and lacunosum moleculare layers, which indicates less modulation of theta power. This was evident for positive (0.018 vs 0.029) and negative acceleration values (0.020 vs 0.031) and is likely because of several of rats in the Kropff et al. (2021b) data potentially having electrode placement in the CA1 radiatum, which has less power modulation by both velocity and acceleration (Figs. 4, 5). The vector angles calculated from the Kropff et al. (2021b) data were also closer to 0° than to 90°, for both positive (−1.7°) and negative acceleration (−19.7°), which indicates a larger contribution from velocity than acceleration. There was not a significant difference in vector magnitude (t(5) = 0.5, p = 0.63) or angle (t(5) = 0.18, p = 0.87) between positive and negative acceleration in the Kropff et al. (2021b) data.
Figure 8.
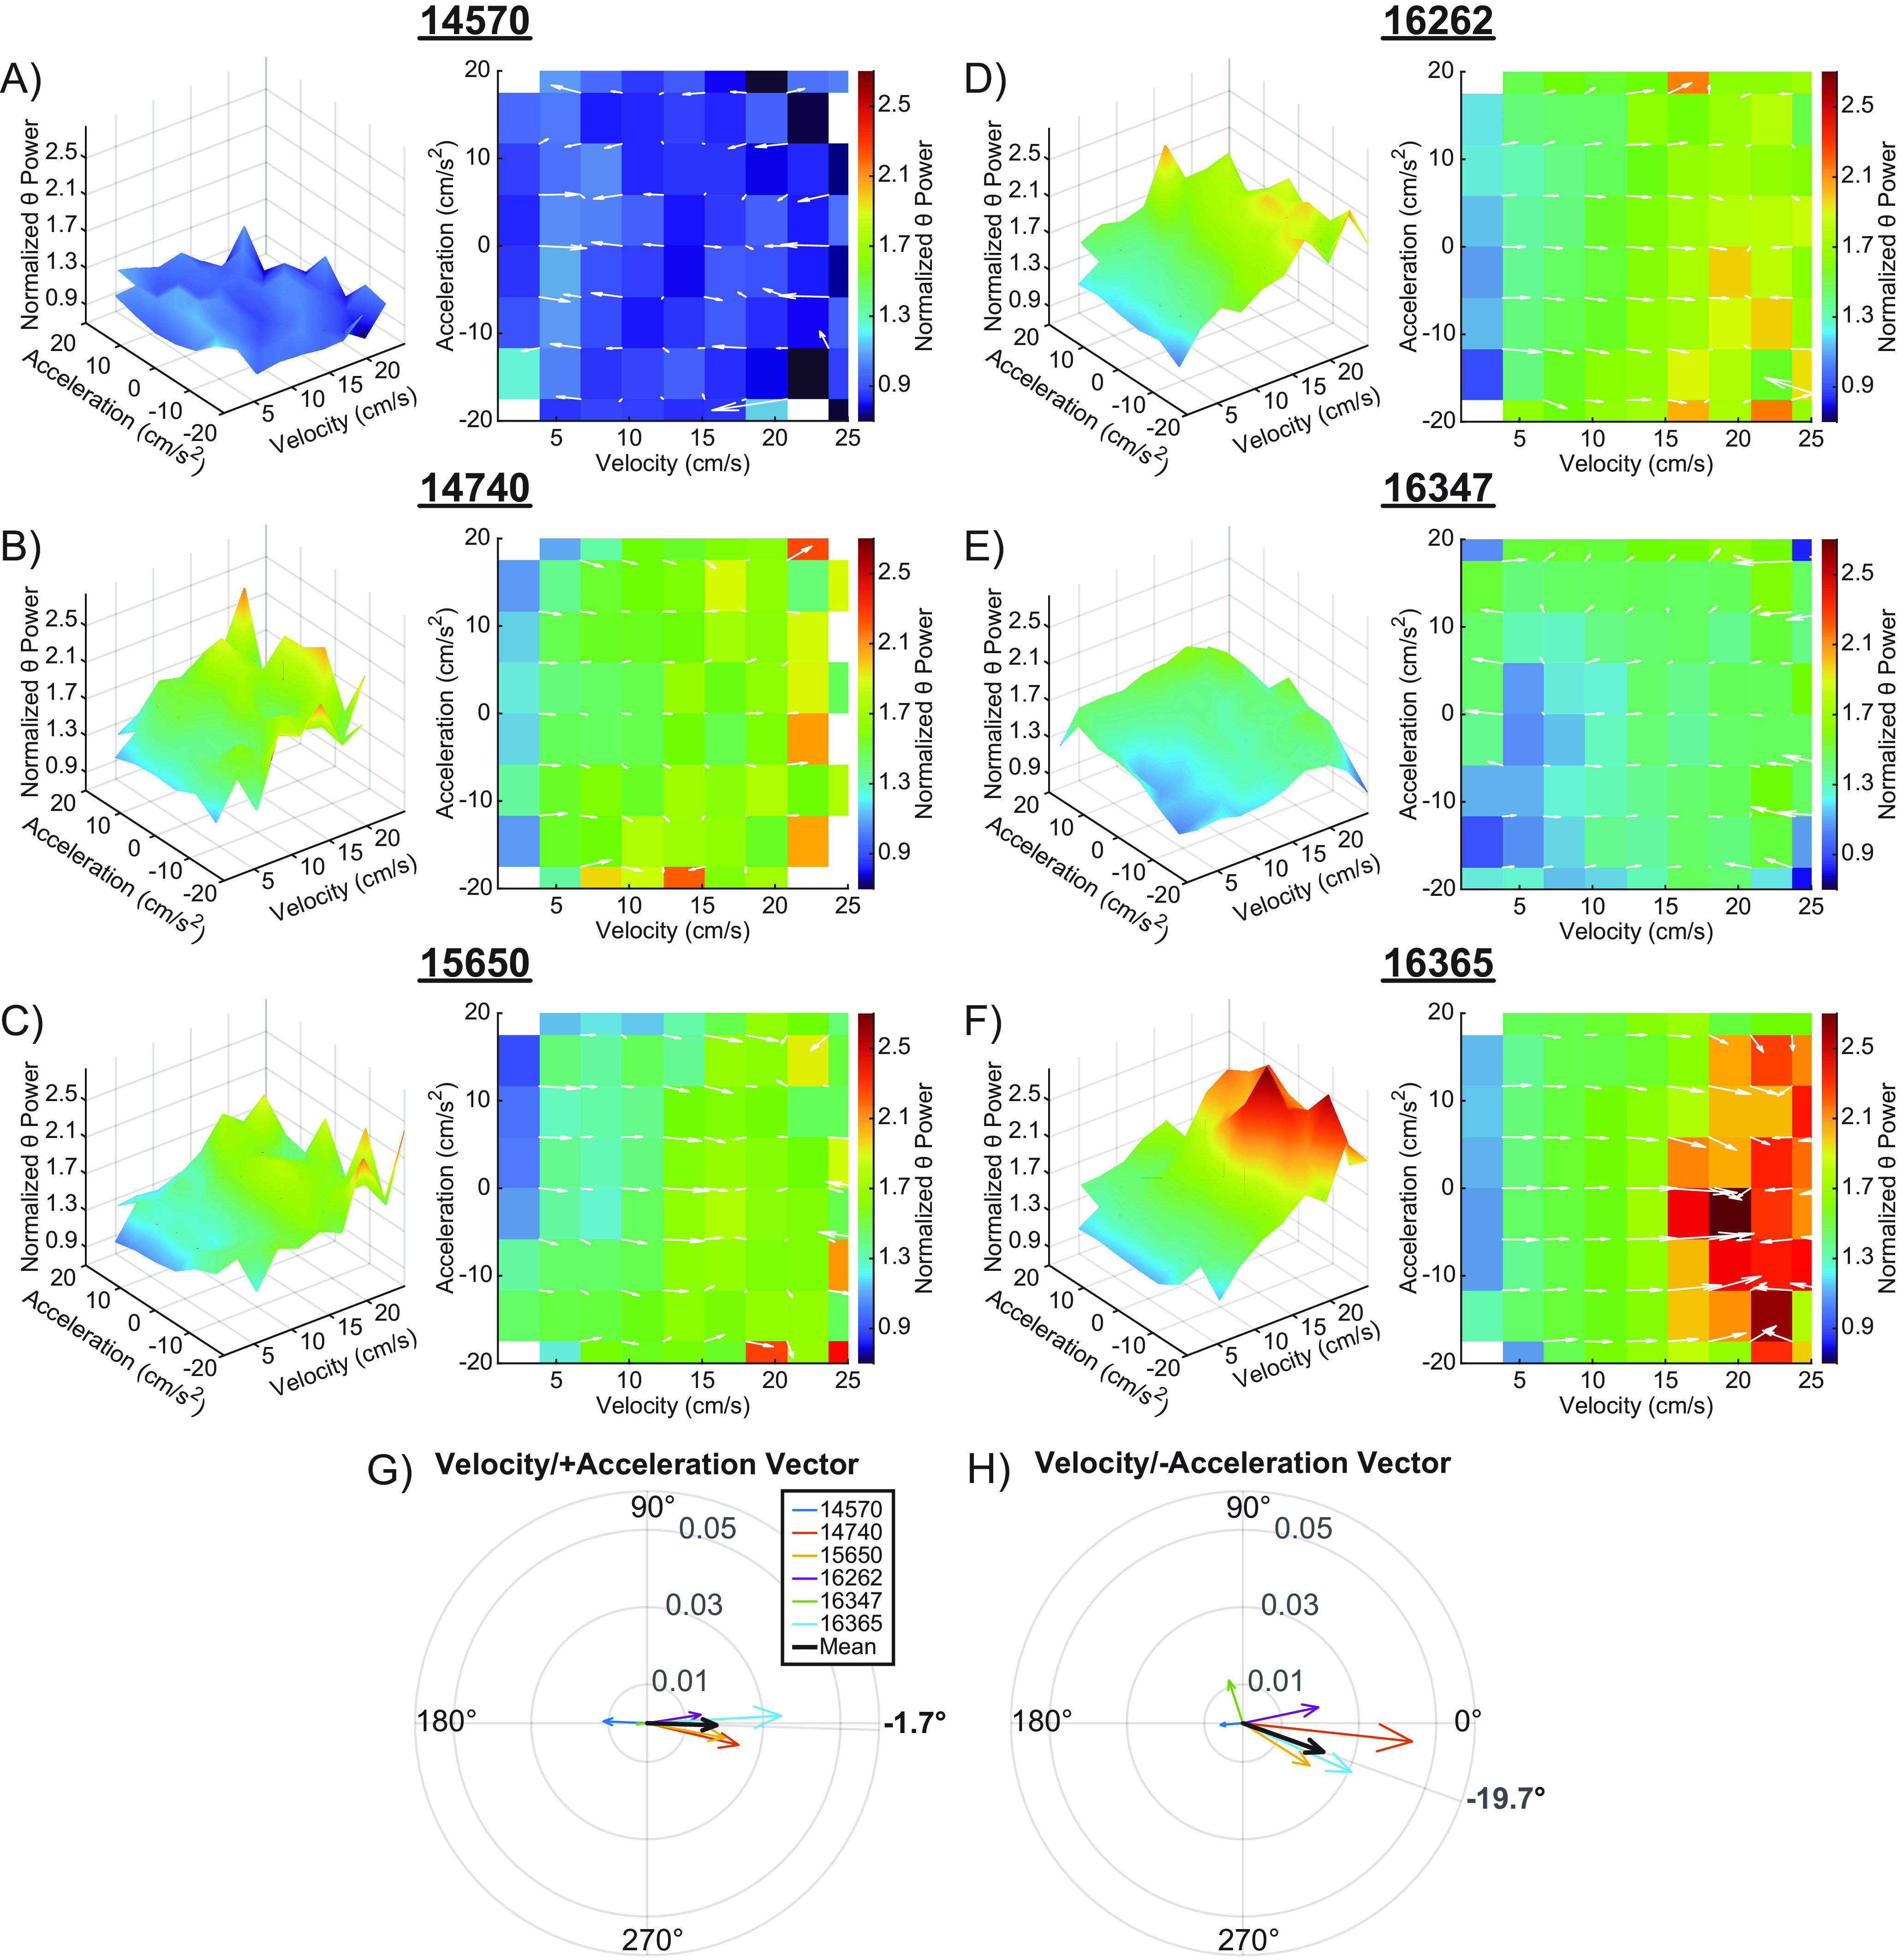
Velocity and acceleration modulation of the theta power in Kropff et al. (2021a). A–F, 3D plots showing the interaction between velocity, acceleration, and normalized theta power for six animals from Kropff et al. (2021a; left), and the corresponding 2D figures representing the top-down view of the 3D surface (right). Overlaid white arrows show the direction and magnitude of the local slope. A robust linear regression was fit to a plot of theta power versus velocity for LFP data from the hippocampal recording from each rat. The y-intercept given by the model was used to normalize theta power. G, H, Compass plots showing the average of the slope vectors (white arrows). An average vector was generated for both the positive (G) and negative acceleration (H) halves of each plot. The average of each animal is shown in various colors, with the mean shown in black. The angle of the set means are shown in bold outside of each compass plot. Note that vector angles close to 0° indicate that theta power was primarily modulated by velocity. As the vector angle increases toward 90°, acceleration makes more of a contribution.
In examining theta frequency as a function of acceleration and velocity, the vector magnitudes were smaller in the Kropff et al. (2021b) data compared with the current data. This was evident for positive (0.008 vs 0.027) and negative acceleration values (0.01 vs 0.025), which is likely because of the skewed sampling of different velocities and acceleration values in the Kropff et al. (2021b) data relative to the current data (see Fig. 1). In the Kropff et al. (2021b) data, we found positive acceleration was associated with an increase in theta frequency (Fig. 9A–F). Similar to our data, however, the vector magnitude did not significantly differ between positive and negative acceleration (t(5) = 1.00, p = 0.36), indicating that both acceleration and deceleration modulated theta frequency. When the vector degrees calculated from the Kropff et al. (2021b) data were examined, similar to the current data, the degree was closer to 0° than to 90° for both positive and negative acceleration (Fig. 9G,H), indicating a larger contribution of velocity compared with acceleration for modulating theta frequency. Furthermore, vector degree did not significantly differ between positive and negative acceleration values (t(5) = 1.24, p = 0.27).
Figure 9.
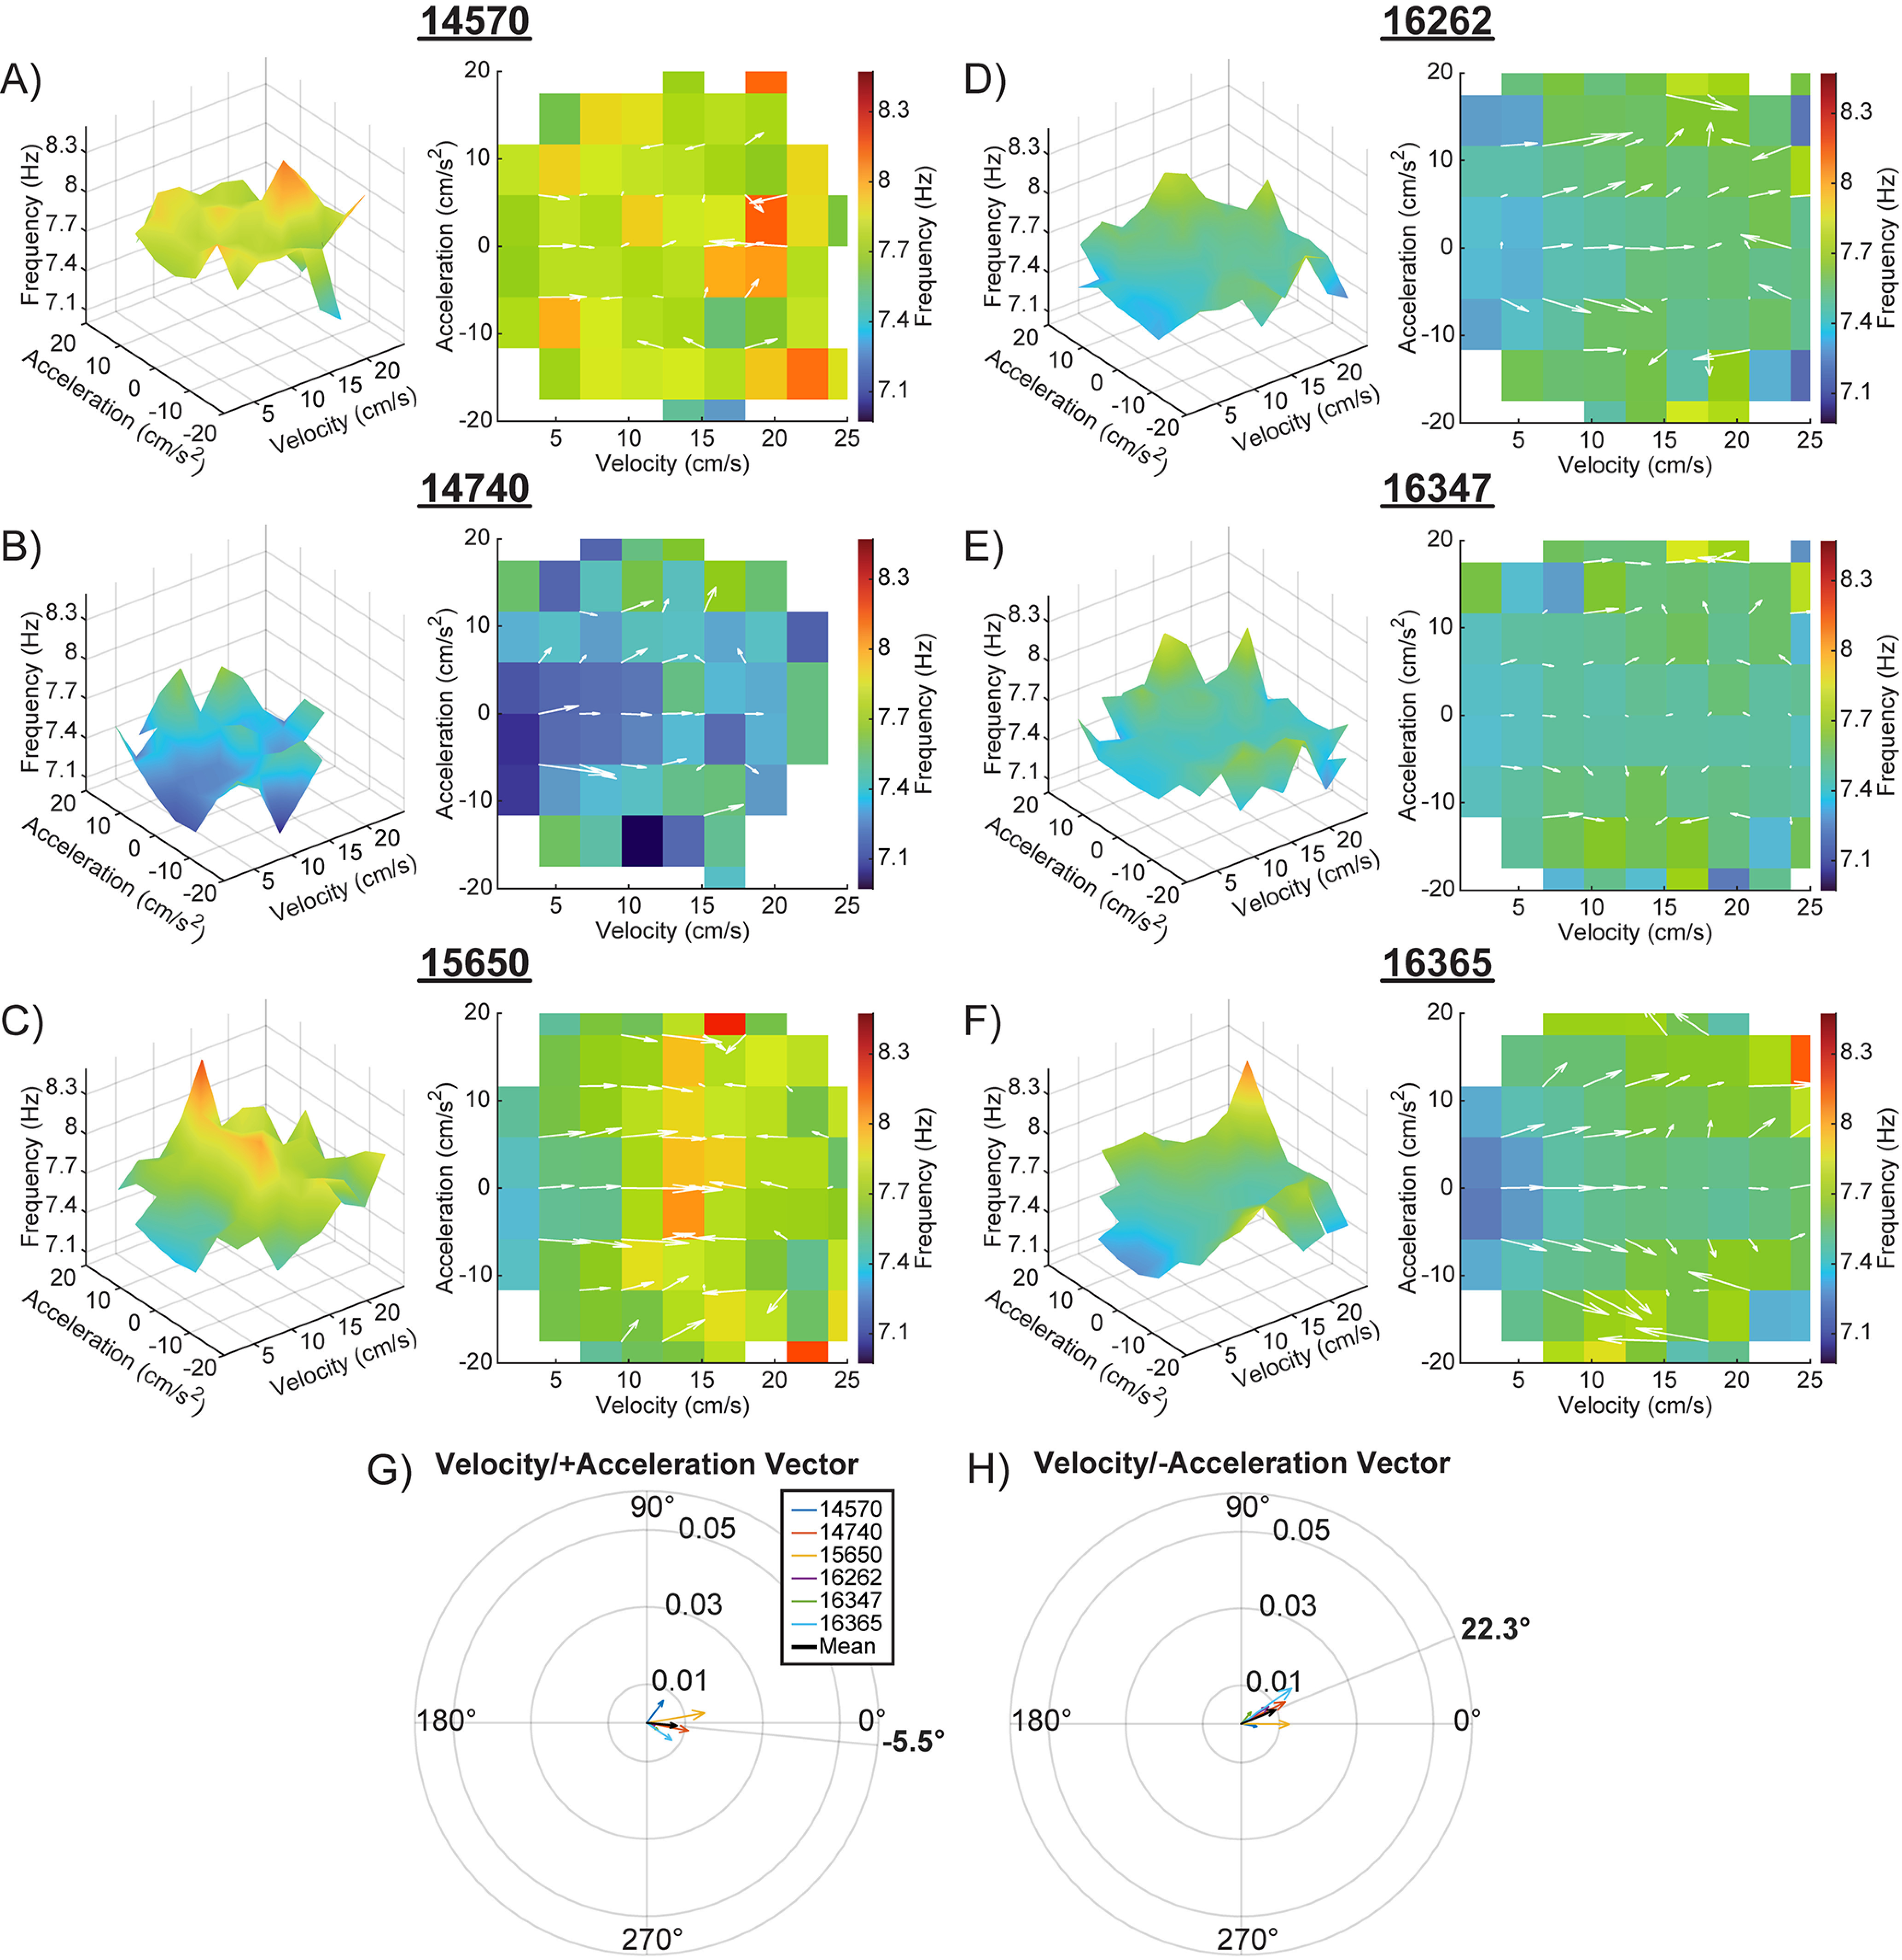
Velocity and acceleration modulation of theta frequency from Kropff et al. (2021a). Note that this figure is the same as Figure 9, but for a theta frequency rather than power. A–F, 3D plots showing the interaction between velocity, acceleration, and theta frequency for six animals from Kropff et al. (2021a; left), and the corresponding 2D figures representing the top-down view of the 3D surface (right). Overlaid white arrows show the direction and magnitude of the local slope. Compass plots showing the average of the slope vectors (white arrows). An average vector was generated for both the positive (G) and negative (H) acceleration halves of each plot. The average of each animal is shown in various colors, with the mean shown in black. The angle of the set means are shown in bold outside of each compass plot. Note that vector angles close to 0° indicate that theta frequency was primarily modulated by velocity. As the vector angle increases toward 90° acceleration makes more of a contribution.
Finally, to resolve the apparent discrepancy across datasets, we measured theta power and frequency for 20 theta cycles preceding and directly following an instance of positive or negative acceleration. Figure 10A shows average velocity, and Figure 10B shows the average acceleration for the circle track, alternation, and Kropff et al. (2021b) data corresponding to events triggered to positive acceleration (Fig. 10B, left) or deceleration (Fig. 10B, right). Figure 10C depicts theta power triggered to acceleration (left) or deceleration (right). Epochs of acceleration are followed by a transient increase in theta power that lasts approximately eight theta cycles. This pattern is observed across all datasets but is attenuated in the Kropff et al. (2021b) data. Deceleration is associated with a drop in theta power across all datasets. Figure 10D depicts a similar pattern of results with regards to theta frequency. That is, theta frequency increased with acceleration and decreased with deceleration. Analyzing the data in this manner shares a degree of overlap with prior publications where the changes in theta amplitude and frequency mirrored movement onset in a jump avoidance task environmental actions (Bland et al., 2006; Lenck-Santini et al., 2008). However, increases in acceleration are associated with a transition to higher running speeds, and decreases in acceleration result in lower running speeds. As such, the apparent interaction between acceleration and theta frequency is inextricably tied to velocity and theta interactions.
Figure 10.
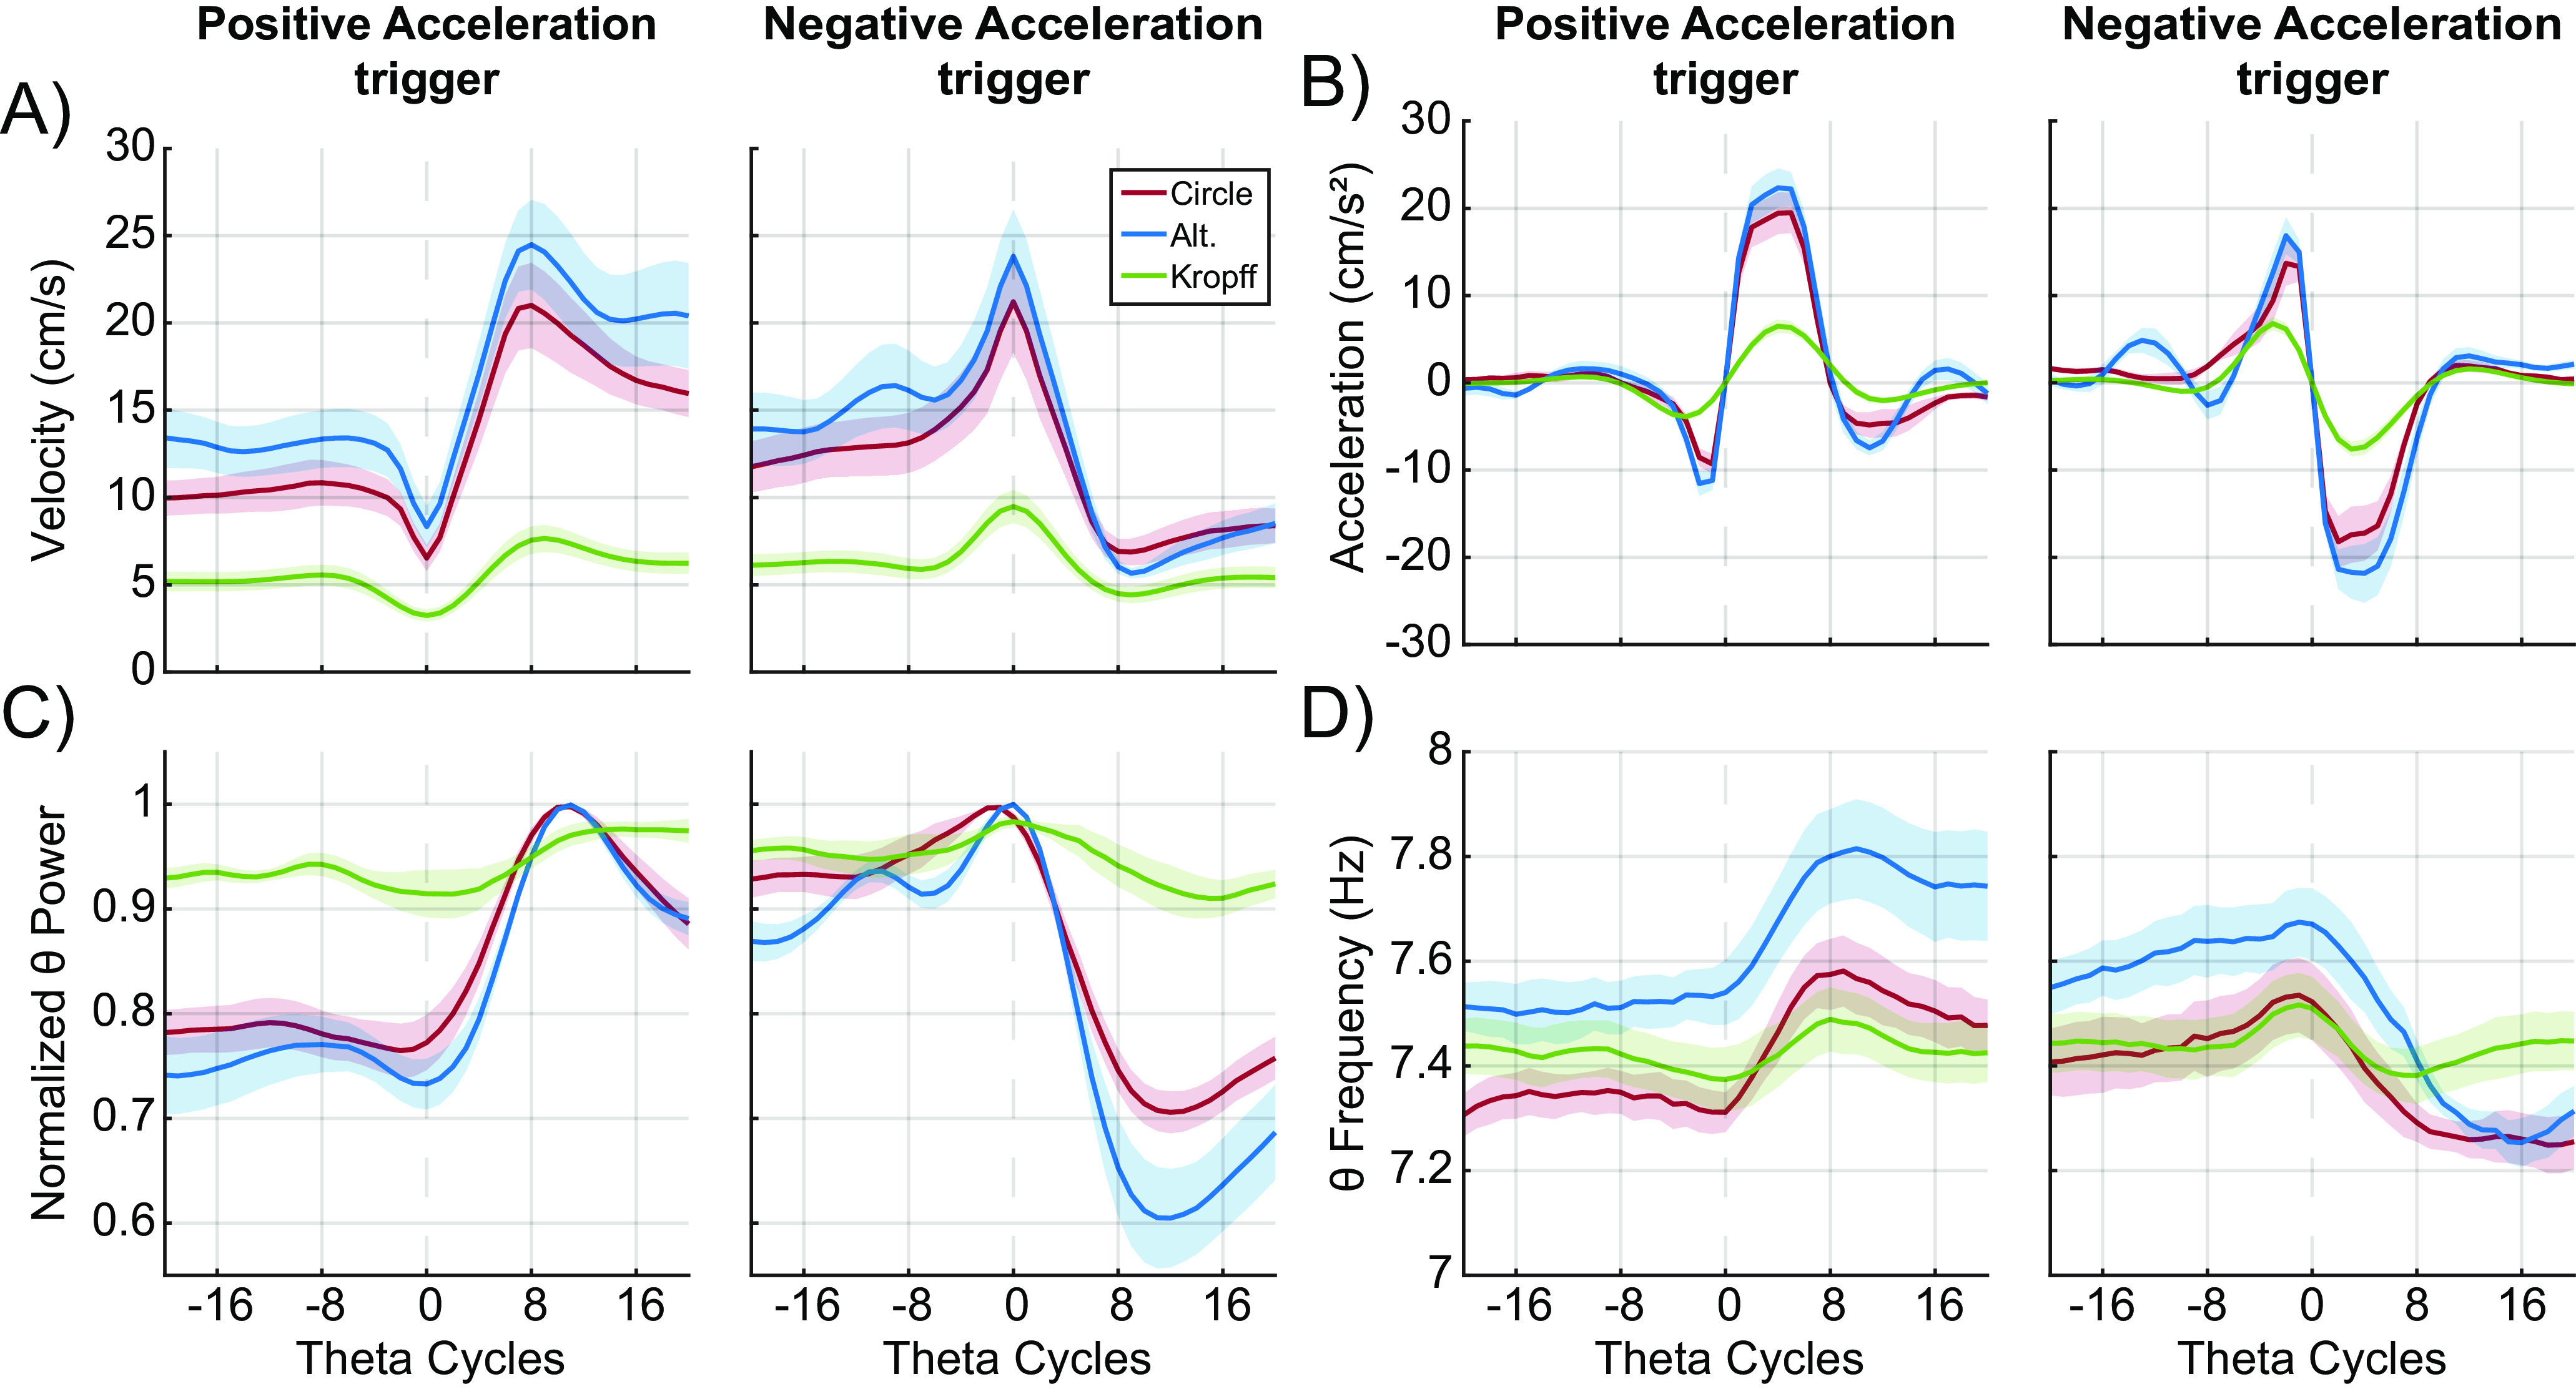
Changes in velocity, acceleration, theta power, and theta frequency during positive and negative acceleration. A, Line plots with shaded error bars showing average velocity, (B) average acceleration, (C) normalized theta power, and (D) theta frequency 20 theta cycles before and after the onset of positive and negative acceleration (dashed line). Data are shown from both circle (red) and alternation (blue) tasks, as well as data obtained from Kropff et al. (2021b; green). Darker colored lines correspond to the task mean, with the shaded regions representing the standard error of the mean.
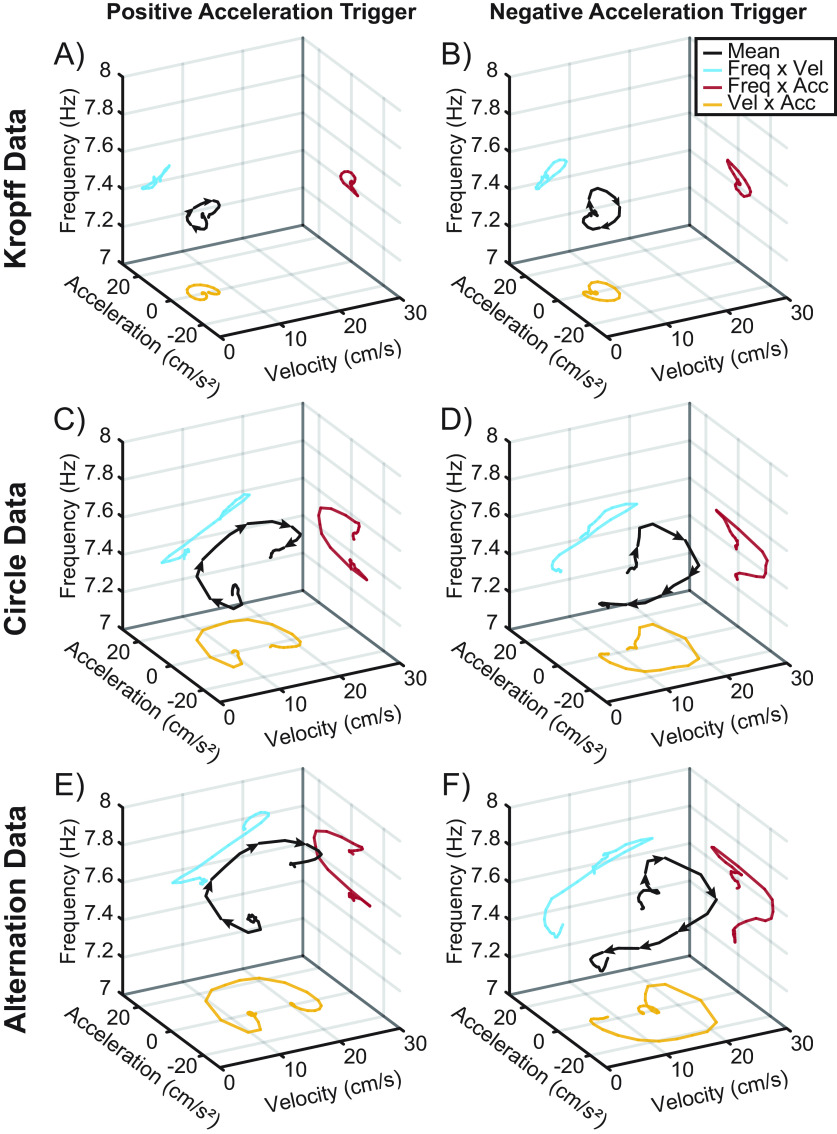
To explore this further, we replotted the data from Figure 10, examining the evolution of theta frequency as a function of acceleration and speed triggered on acceleration/deceleration epochs (Fig. 11). As depicted in Figure 11, a negative acceleration reduces velocity and positive acceleration increases velocity. Despite the reduced parametric space of the Kropff et al. (2021b) data, across speed clamping (Fig. 11A,B), circle track (Fig. 11C,D) and alternation (Fig. 11E,F) conditions, there was a consistent relationship between increases in theta frequency and increases in running speed even when triggered to either acceleration or deceleration. In selecting the scientific explanation that best fits the evidence, parsimoniously, running speed exhibits the most evident relationship to theta frequency.
Figure 11.
Average theta frequency versus velocity and acceleration triggered to acceleration/deceleration epochs. 3D plots comparing the relationship between average theta frequency, velocity, and acceleration triggered to the onset of positive (left column) and negative (right column) acceleration for data from Kropff et al., 2021a (A, B), as well as the circle (C, D) and alternation (E, F) task. Black lines with arrows represent the average trend and direction of theta frequency as a function of velocity and acceleration. Colored lines are projected onto each axis to show the trend of frequency versus velocity (blue), frequency versus acceleration (red), and velocity versus acceleration (yellow). Note that the change in the direction of the black line between the plots triggered to positive and negative acceleration. In both cases, theta frequency can be seen increasing as a function of velocity.
Discussion
The present study re-evaluated the relationship between hippocampal theta and running speed and acceleration. On both the circle track and digital-8 maze, as previously reported (Czurkó et al., 1999; Sheremet et al., 2016), there was a consistent increase in the amplitude of theta and its harmonics as a function of running speed co-occurring with an increase in theta frequency from ∼7 to 9 Hz. Power spectral densities suggested that there might be a corresponding change in theta power and frequency with increasing acceleration, but the change in power evident from the PSD was relatively small compared with running speed. This was particularly evident for the ∼16-Hz theta harmonic band, which was approximately the same magnitude across all acceleration bins but increased with speed (Figs. 2, 3). Subsequently, we calculated the power and frequency of theta as a function of running speed or acceleration during circle track running, continuous alternation, and during the bottomless car task data from Kropff et al. (2021b; Fig. 4). The relationship of LFP power to speed and acceleration was attenuated in the radiatum (as previously reported for the dentate gyrus; Montgomery et al., 2009). Plotting theta power as a function of acceleration revealed a weaker relationship, although the pyramidal and lacunosum moleculare regions showed a modest increase at positive acceleration (Fig. 4). While theta frequency was greater during continuous alternation than during circle track running, velocity more strongly modulated frequency than acceleration/deceleration during both tasks. Similarly, in the Kropff et al. (2021b) data, the relationship between speed and theta power/frequency was greater than that observed for acceleration or deceleration.
Considering acceleration as a stimulus that is distinct from velocity, however, is contrived as they are physically linked. Therefore, we thought it prudent to consider theta frequency and power for all parametric combinations of acceleration and frequency. This yielded a surface representation where the locally calculated slope contains a vector, with the angle and magnitude describing the respective contributions of velocity versus acceleration (this analysis, however, assumes that velocity and acceleration are matched in their contributions; such comparisons may be contrived. See below). This analysis indicated that running speed, and not acceleration/deceleration, made a larger contribution to modulating theta power and frequency (Figs. 5–7). Notably, the modulation of theta power in the radiatum by both velocity and acceleration was relatively low (Fig. 5B).
The current data stand in contrast to a recently published manuscript asserting that the frequency of theta rhythm is controlled by acceleration, but not running speed, in rats forced to accelerate and run at a specific velocity (Kropff et al. 2021a). We thank the authors for sharing the data, allowing us to re-explore their results. We therefore extended the analyses of Kropff et al. (2021b) to examine the relationship of theta power to both speed and acceleration (Fig. 8). As noted by the authors in the original paper, however, this analysis was impeded by the inability to precisely localize the electrode placement with respect to the different CA1 laminae. Although the relationship was more evident in some rats than others, on average, theta power was more modulated by velocity than acceleration/deceleration. Despite the reduced parametric space of speed and acceleration in the Kropff et al. (2021b) data, the surface plots for theta frequency revealed that velocity carried more influence than acceleration (Fig. 9).
When it comes to elucidating the potential rationale in which Kropff et al. (2021a) interpreted their results, we can offer multiple insights. The simplest explanation is that the frequency of theta rhythm is largely modulated by running speed and that a peri-event measure triggered to acceleration is an oblique representation. The velocity profiles triggered by positive acceleration reveal a positive change in velocity (Fig. 10A). If theta frequency increases with speed, then triggering to acceleration trigger would predictably show an increase in frequency (Fig. 10D). Therefore, we plotted the dynamic change of theta frequency, speed, and acceleration triggered to the acceleration/deceleration epochs (Fig. 11). As anticipated, instances of acceleration change running speed. Although there was no readily identifiable relationship between theta frequency and acceleration/deceleration, there was a clear positive relationship with frequency and velocity across all conditions.
Largely, we find our results in accordance with prior studies in which, after accounting for velocity, there is a component of theta that is related to acceleration (Long et al., 2014), which could be predicted based on hippocampal physiology. Reductions in theta power and the spatial selectivity of hippocampal CA1 place fields follow vestibular lesions (Stackman et al., 2002; Russell et al., 2003, 2006). Stimulation of the vestibular nerve increases hippocampal acetylcholine in the rat (Horii et al., 1994), and the hippocampal blood oxygen level-dependent signal in humans (Vitte et al., 1996). This leaves the questions as to why to modulation of theta by acceleration is appears nonlinear and transient. The lower bound discrimination threshold for the otolith is between 1.5 and 6.1 cm/s2 in humans (MacNeilage et al., 2010; Valko et al., 2012; Jamali et al., 2013) indicative of gravity-based inertia on the vestibular system (Palla et al., 2006). Thus, low linear acceleration below 1.6 cm/s2 is not large enough to displace the otolith. However, above this, the otolithic membrane shifts activating hair cells en masse. As right labyrinth stimulation induces a bilateral, 40-ms latency potential in the guinea pig hippocampus (Cuthbert et al., 2000), then an en masse activation of hair cells in an awake-behaving animal suggests that accelerations from zero to above threshold would induce a large, short-lived effect on hippocampal physiology. This potentially explains the effect of acceleration on theta power and frequency at low values, which attenuates toward higher acceleration values: the largest effect of acceleration will be transitions from low or no acceleration to anything noticeable and wanes thereafter (Fig. 4I–P). This description offers insights in observed changes in theta frequency in a jump-avoidance task (Bland et al., 2006; Lenck-Santini et al., 2008). However, there is temerity to asserting that acceleration and not speed controls theta frequency.
This speaks to a general issue regarding the claims that can be made from neurophysiological studies in correlation to behavior. As stated by Donato and Moser, navigation is the integration of many sensory inputs that are not linearly related to perception but are better described in terms of cognitive abstractions (Minderer et al., 2016). Nevertheless, the controversy regarding the exact behavioral correlate of theta is still a contemporary topic of debate (Buzsáki, 2005). It is important to note that a piecemeal dissection of animal behavior may not lead us any closer to understanding brain organization (Buzsáki, 2020). Reducing the parametric space offers insights into what the brain “could do” under some circumstances, but perhaps counterbalanced with a reduced ability to extend the results into a broader theoretical framework. There is no outstanding concern regarding the data collection or analyses by Kropff et al. (2021a), and we can replicate the depiction that acceleration can modulate theta frequency. However, the assertion that theta frequency is controlled solely by acceleration and not speed, disproving a 50-year-old theory (KavliNeuroscience, 2021), is sensationalized to an improvident extent. While this may not have been the intention of the original authors, making bold assertions derived from results obtained under narrow conditions may stunt scientific progress or obfuscate the road forward (Kaelin, 2017; Krakauer et al., 2017; Lewis et al., 2021).
Here, we offer a pragmatic interpretation in which observations based on three different behaviors (speed clamping, circle track traversing, and continuous alternation) are all consistent with theories in which theta frequency is generated by propagating activity across multiple brain regions that comprise the Papez circuit (Vertes et al., 2001). In this framework, frequency is directly related to how long activity takes to propagate within the larger reentrant circuit (Edelman, 1987; von Stein and Sarnthein, 2000), throttled by synaptic time constants and axonal conduction speeds (Buzsáki and Draguhn, 2004; Buzsaki, 2006). While axonal conduction provides a theoretical limit to the maximum speed that theta can propagate, increases in frequency may be achieved by decreasing the integration time for a downstream neuron to fire via increases in excitation. For instance, proprioception, vestibular cues, optic flow, and motor efference signals will increase with running speed, allowing cooperation among synaptic inputs to detonate downstream neurons sooner, resulting in a faster relay of activity to the next region.
The reentrant loops of the brain allow spatiotemporal patterns in the hippocampus that are shaped by ongoing sensory experience to change in time. From this theoretical perspective, theta frequency will correlate with the rate at behaviorally relevant cues change. Interestingly, this is simply an extension of the sensorimotor integration model, which proposes that the hippocampus provides the appropriate feedback to voluntary motor regions based on changing environmental stimuli (Bland, 1986; Bland and Oddie, 2001). In most circumstances, sensory information changes in a manner directly correlating to running speed, making the velocity of the animal the simplest correlate of theta amplitude and frequency. Placing the results in this framework offers a platform moving forward by which to understand how the brain maintains continuity of cognition (Maurer and Nadel, 2021).
Footnotes
This work was supported by the McKnight Brain Research Foundation and National Institutes of Health Grants AG055544 and MH109548. We thank Kim Roberston for her technical support and Michael Burke for apparatus construction. We also thank Dr. Lynn Nadel for helpful comments on an earlier version of the manuscript.
The authors declare no competing financial interests.
References
- Aarts E, Verhage M, Veenvliet JV, Dolan CV, van der Sluis S (2014) A solution to dependency: using multilevel analysis to accommodate nested data. Nat Neurosci 17:491–496. 10.1038/nn.3648 [DOI] [PubMed] [Google Scholar]
- Aitken P, Zheng Y, Smith PF (2017a) The modulation of hippocampal theta rhythm by the vestibular system. J Neurophysiol 119:548–562. 10.1152/jn.00548.2017 [DOI] [PubMed] [Google Scholar]
- Aitken P, Zheng Y, Smith PF (2017b) Effects of bilateral vestibular deafferentation in rat on hippocampal theta response to somatosensory stimulation, acetylcholine release, and cholinergic neurons in the pedunculopontine tegmental nucleus. Brain Struct Funct 222:3319–3332. 10.1007/s00429-017-1407-1 [DOI] [PubMed] [Google Scholar]
- Amaral D, Witter M (1995) Hippocampal formation. In: The rat nervous system, Ed 2, 443–486. San Diego: Academic Press. [Google Scholar]
- Arnolds D, Da Silva FL, Aitink J, Kamp A (1979) Hippocampal EEG and behaviour in dog. I. Hippocampal EEG correlates of gross motor behaviour. Electroencephalogr Clin Neurophysiol 46:552–570. 10.1016/0013-4694(79)90009-9 [DOI] [PubMed] [Google Scholar]
- Aronov D, Nevers R, Tank DW (2017) Mapping of a non-spatial dimension by the hippocampal-entorhinal circuit. Nature 543:719–722. 10.1038/nature21692 [DOI] [PMC free article] [PubMed] [Google Scholar]
- Bland BH (1986) The physiology and pharmacology of hippocampal formation theta rhythms. Prog Neurobiol 26:1–54. 10.1016/0301-0082(86)90019-5 [DOI] [PubMed] [Google Scholar]
- Bland BH, Oddie SD (2001) Theta band oscillation and synchrony in the hippocampal formation and associated structures: the case for its role in sensorimotor integration. Behav Brain Res 127:119–136. 10.1016/s0166-4328(01)00358-8 [DOI] [PubMed] [Google Scholar]
- Bland BH, Jackson J, Derrie-Gillespie D, Azad T, Rickhi A, Abriam J (2006) Amplitude, frequency, and phase analysis of hippocampal theta during sensorimotor processing in a jump avoidance task. Hippocampus 16:673–681. 10.1002/hipo.20210 [DOI] [PubMed] [Google Scholar]
- Brandt T, Schautzer F, Hamilton DA, Brüning R, Markowitsch HJ, Kalla R, Darlington C, Smith P, Strupp M (2005) Vestibular loss causes hippocampal atrophy and impaired spatial memory in humans. Brain 128:2732–2741. 10.1093/brain/awh617 [DOI] [PubMed] [Google Scholar]
- Bush D, Bisby JA, Bird CM, Gollwitzer S, Rodionov R, Diehl B, McEvoy AW, Walker MC, Burgess N (2017) Human hippocampal theta power indicates movement onset and distance travelled. Proc Natl Acad Sci U S A 114:12297–12302. 10.1073/pnas.1708716114 [DOI] [PMC free article] [PubMed] [Google Scholar]
- Buzsáki G (2005) Theta rhythm of navigation: link between path integration and landmark navigation, episodic and semantic memory. Hippocampus 15:827–840. 10.1002/hipo.20113 [DOI] [PubMed] [Google Scholar]
- Buzsaki G (2006) Rhythms of the brain. Oxford: Oxford University Press. [Google Scholar]
- Buzsáki G (2020) The brain-cognitive behavior problem: retrospective. eNeuro 7:ENEURO.0069-20.2020. 10.1523/ENEURO.0069-20.2020 [DOI] [PMC free article] [PubMed] [Google Scholar]
- Buzsáki G, Draguhn A (2004) Neuronal oscillations in cortical networks. Science 304:1926–1929. 10.1126/science.1099745 [DOI] [PubMed] [Google Scholar]
- Cuthbert PC, Gilchrist DP, Hicks SL, MacDougall HG, Curthoys IS (2000) Electrophysiological evidence for vestibular activation of the guinea pig hippocampus. Neuroreport 11:1443–1447. 10.1097/00001756-200005150-00018 [DOI] [PubMed] [Google Scholar]
- Czurkó A, Hirase H, Csicsvari J, Buzsáki G (1999) Sustained activation of hippocampal pyramidal cells by 'space clamping' in a running wheel. Eur J Neurosci 11:344–352. 10.1046/j.1460-9568.1999.00446.x [DOI] [PubMed] [Google Scholar]
- Edelman GM (1987) Neural Darwinism: the theory of neuronal group selection. New York: Basic Books. [DOI] [PubMed] [Google Scholar]
- Garcia D (2010) Robust smoothing of gridded data in one and higher dimensions with missing values. Comput Stat Data Anal 54:1167–1178. 10.1016/j.csda.2009.09.020 [DOI] [PMC free article] [PubMed] [Google Scholar]
- Gupta AS, Van Der Meer MA, Touretzky DS, Redish AD (2012) Segmentation of spatial experience by hippocampal theta sequences. Nat Neurosci 15:1032–1039. 10.1038/nn.3138 [DOI] [PMC free article] [PubMed] [Google Scholar]
- Horii A, Takeda N, Mochizuki T, Okakura-Mochizuki K, Yamamoto Y, Yamatodani A (1994) Effects of vestibular stimulation on acetylcholine release from rat hippocampus: an in vivo microdialysis study. J Neurophysiol 72:605–611. 10.1152/jn.1994.72.2.605 [DOI] [PubMed] [Google Scholar]
- Jamali M, Carriot J, Chacron MJ, Cullen KE (2013) Strong correlations between sensitivity and variability give rise to constant discrimination thresholds across the otolith afferent population. J Neurosci 33:11302–11313. 10.1523/JNEUROSCI.0459-13.2013 [DOI] [PMC free article] [PubMed] [Google Scholar]
- Kaelin WG (2017) Publish houses of brick, not mansions of straw. Nature 545:387. [DOI] [PubMed] [Google Scholar]
- KavliNeuroscience (2021) Disproving 50-year-old belief about brain rhythms! Twitter. Available at twitter.com/kisneuro/status/1359175117637644291.
- Krakauer JW, Ghazanfar AA, Gomez-Marin A, MacIver MA, Poeppel D (2017) Neuroscience needs behavior: correcting a reductionist bias. Neuron 93:480–490. 10.1016/j.neuron.2016.12.041 [DOI] [PubMed] [Google Scholar]
- Kropff E, Carmichael JE, Moser EI, Moser MB (2021a) Frequency of theta rhythm is controlled by acceleration, but not speed, in running rats. Neuron 109:1029–1039.e8. 10.1016/j.neuron.2021.01.017 [DOI] [PMC free article] [PubMed] [Google Scholar]
- Kropff E, Carmichael J, Moser E, Moser MB (2021b) Dataset - Frequency of theta rhythm is controlled by acceleration but not speed in running rats. G-Node. Available at 10.12751/g-node.c84f73. [DOI] [PMC free article] [PubMed]
- Kuo T, Li JY, Chen CY, Yang C (2011) Changes in hippocampal θ activity during initiation and maintenance of running in the rat. Neuroscience 194:27–35. 10.1016/j.neuroscience.2011.08.007 [DOI] [PubMed] [Google Scholar]
- Lenck-Santini PP, Fenton AA, Muller RU (2008) Discharge properties of hippocampal neurons during performance of a jump avoidance task. J Neurosci 28:6773–6786. 10.1523/JNEUROSCI.5329-07.2008 [DOI] [PMC free article] [PubMed] [Google Scholar]
- Lewis AS, Calipari ES, Siciliano CA (2021) Toward standardized guidelines for investigating neural circuit control of behavior in animal research. eNeuro 8:ENEURO.0498-20.2021. 10.1523/ENEURO.0498-20.2021 [DOI] [PMC free article] [PubMed] [Google Scholar]
- Long LL, Hinman JR, Chen C-M, Escabi MA, Chrobak JJ (2014) Theta dynamics in rat: speed and acceleration across the septotemporal axis. PLoS One 9:e97987. 10.1371/journal.pone.0097987 [DOI] [PMC free article] [PubMed] [Google Scholar]
- MacNeilage PR, Banks MS, DeAngelis GC, Angelaki DE (2010) Vestibular heading discrimination and sensitivity to linear acceleration in head and world coordinates. J Neurosci 30:9084–9094. 10.1523/JNEUROSCI.1304-10.2010 [DOI] [PMC free article] [PubMed] [Google Scholar]
- Maurer AP, Nadel L (2021) The continuity of context: a role for the hippocampus. Trends Cogn Sci 25:187–199. [DOI] [PMC free article] [PubMed] [Google Scholar]
- Maurer AP, Vanrhoads SR, Sutherland GR, Lipa P, McNaughton BL (2005) Self-motion and the origin of differential spatial scaling along the septo-temporal axis of the hippocampus. Hippocampus 15:841–852. 10.1002/hipo.20114 [DOI] [PubMed] [Google Scholar]
- Maurer AP, Burke SN, Lipa P, Skaggs WE, Barnes CA (2012) Greater running speeds result in altered hippocampal phase sequence dynamics. Hippocampus 22:737–747. 10.1002/hipo.20936 [DOI] [PMC free article] [PubMed] [Google Scholar]
- McNaughton BL, Barnes CA, O'Keefe J (1983) The contributions of position, direction, and velocity to single unit activity in the hippocampus of freely-moving rats. Exp Brain Res 52:41–49. 10.1007/BF00237147 [DOI] [PubMed] [Google Scholar]
- Minderer M, Harvey CD, Donato F, Moser EI (2016) Neuroscience: virtual reality explored. Nature 533:324–325. 10.1038/nature17899 [DOI] [PubMed] [Google Scholar]
- Montgomery SM, Betancur MI, Buzsáki G (2009) Behavior-dependent coordination of multiple theta dipoles in the hippocampus. J Neurosci 29:1381–1394. 10.1523/JNEUROSCI.4339-08.2009 [DOI] [PMC free article] [PubMed] [Google Scholar]
- Palla A, Bockisch CJ, Bergamin O, Straumann D (2006) Dissociated hysteresis of static ocular counterroll in humans. J Neurophysiol 95:2222–2232. 10.1152/jn.01014.2005 [DOI] [PubMed] [Google Scholar]
- Papoulis A, Pillai SU (2002) Probability, random variables, and stochastic processes. New York: Tata McGraw-Hill Education. [Google Scholar]
- Priestley MB (1981) Spectral analysis and time series. London: Academic Press. [Google Scholar]
- Russell NA, Horii A, Smith PF, Darlington CL, Bilkey DK (2003) Long-term effects of permanent vestibular lesions on hippocampal spatial firing. J Neurosci 23:6490–6498. [DOI] [PMC free article] [PubMed] [Google Scholar]
- Russell NA, Horii A, Smith PF, Darlington CL, Bilkey DK (2006) Lesions of the vestibular system disrupt hippocampal theta rhythm in the rat. J Neurophysiol 96:4–14. 10.1152/jn.00953.2005 [DOI] [PubMed] [Google Scholar]
- Sheremet A, Burke SN, Maurer AP (2016) Movement enhances the nonlinearity of hippocampal theta. J Neurosci 36:4218–4230. 10.1523/JNEUROSCI.3564-15.2016 [DOI] [PMC free article] [PubMed] [Google Scholar]
- Sheremet A, Kennedy JP, Qin Y, Zhou Y, Lovett SD, Burke SN, Maurer AP (2019) Theta-gamma cascades and running speed. J Neurophysiol 121:444–458. 10.1152/jn.00636.2018 [DOI] [PMC free article] [PubMed] [Google Scholar]
- Stackman RW, Clark AS, Taube JS (2002) Hippocampal spatial representations require vestibular input. Hippocampus 12:291–303. 10.1002/hipo.1112 [DOI] [PMC free article] [PubMed] [Google Scholar]
- Valko Y, Lewis RF, Priesol AJ, Merfeld DM (2012) Vestibular labyrinth contributions to human whole-body motion discrimination. J Neurosci 32:13537–13542. 10.1523/JNEUROSCI.2157-12.2012 [DOI] [PMC free article] [PubMed] [Google Scholar]
- Vertes RP, Albo Z, Viana Di Prisco G (2001) Theta-rhythmically firing neurons in the anterior thalamus: implications for mnemonic functions of Papez's circuit. Neuroscience 104:619–625. 10.1016/S0306-4522(01)00131-2 [DOI] [PubMed] [Google Scholar]
- Vitte E, Derosier C, Caritu Y, Berthoz A, Hasboun D, Soulié D (1996) Activation of the hippocampal formation by vestibular stimulation: a functional magnetic resonance imaging study. Exp Brain Res 112:523–526. 10.1007/BF00227958 [DOI] [PubMed] [Google Scholar]
- von Stein A, Sarnthein J (2000) Different frequencies for different scales of cortical integration: from local gamma to long range alpha/theta synchronization. Int J Psychophysiol 38:301–313. 10.1016/S0167-8760(00)00172-0 [DOI] [PubMed] [Google Scholar]
- Whishaw IQ, Vanderwolf CH (1973) Hippocampal EEG and behavior: changes in amplitude and frequency of RSA (theta rhythm) associated with spontaneous and learned movement patterns in rats and cats. Behav Biol 8:461–484. 10.1016/s0091-6773(73)80041-0 [DOI] [PubMed] [Google Scholar]


