

Abstract
Selective neurodegeneration is a critical causal factor in Alzheimer’s disease (AD); however, the mechanisms that lead some neurons to perish while others remain resilient are unknown. We sought potential drivers of this selective vulnerability using single-nucleus RNA sequencing and discovered that apoE expression level is a substantial driver of neuronal variability. Strikingly, neuronal expression of apoE—which has a robust genetic linkage to AD—correlated strongly, on a cell-by-cell basis, with immune response pathways in neurons in the brains of wildtype mice, human apoE knock-in mice, and humans with or without AD. Elimination or over-expression of neuronal apoE revealed a causal relationship between apoE expression, neuronal MHC-I expression, Tau pathology, and neurodegeneration. Functional reduction of MHC-I ameliorated Tau pathology in apoE4-expressing primary neurons and in mouse hippocampi expressing pathological Tau. These findings suggest a mechanism linking neuronal apoE expression to MHC-I expression and, subsequently, to Tau pathology and selective neurodegeneration.
Across the diversity of neurodegenerative diseases, particular brain regions and cell types are especially vulnerable1. In Alzheimer’s disease (AD), for example, there is a regional susceptibility in the hippocampus and entorhinal cortex, with a particular vulnerability in CA1 neurons and hilar interneurons relative to other neuronal types1–4. Even within these susceptible neuronal populations, however, some cells are lost early while others prove more resilient. With recent technical improvements in single-cell analysis, we are able to examine the within-cell-type variability that may contribute to cell-by-cell differences in susceptibility to disease.
AD is the most common form of dementia3. The major genetic risk factor for AD is apolipoprotein (apo) E4, which both increases disease risk and decreases age of disease onset in carriers3–5. Although apoE4 carriers account for only 20–25% of the general population, they represent 60–75% of AD cases, highlighting the importance of apoE4 in AD pathogenesis3–6. Within the central nervous system, the apoE protein is primarily produced in astrocytes7 but has been shown to be produced in neurons under conditions of stress, injury, and aging8–10. Neuronal apoE4 expression has been shown to diminish synaptic plasticity, impair synaptogenesis, decrease synaptic density, induce Tau pathology, cause interneuron deficit, and impair learning and memory in vitro and/or in vivo2–4,8,11–13. Additionally, in a mouse model of tauopathy, human apoE expression—especially the apoE4 isoform—led to increased Tau pathology, neuroinflammation, and neuronal loss, while apoE deficiency protected against these insults, suggesting a dose effect of apoE protein in addition to isoform-specific effects14. We sought to test whether and how neuronal apoE expression levels may contribute to selective neuronal vulnerability in AD by single cell analysis in both human apoE knock-in (apoE-KI) mouse and human brains.
An unbiased single-nucleus RNA sequencing (snRNA-seq) analysis revealed strong correlations between neuronal apoE expression and expression of a number of cellular stress pathways that have previously been implicated in neurodegeneration, including pathways related to metabolic stress, apoptosis, DNA damage and repair, unfolded protein response, and immune response. A number of these cellular sequelae, including metabolic disruption15, neurodegeneration3,4, and cellular senescence and apoptosis16, had been previously linked to neuronal apoE expression, but the link between neuronal expression of apoE and neuronal expression of immune response pathways was, to our knowledge, not reported previously.
Further analysis of these immune response pathways suggested that some of the MHC class I (MHC-I) family of genes (more than 50 genes in total) could be driving this association. Like apoE, MHC-I genes are expressed at a relatively low level in neurons under physiological conditions, and their expression is increased following excitatory stress, seizure, injury, and aging17–21. Additionally, both increased apoE and increased MHC-I expression can diminish neuronal capacity for synaptic plasticity, neurite outgrowth, and neuronal regeneration3,4,8,10,17–23. In experiments manipulating neuronal apoE expression, we found a causal link between neuronal expression of apoE and neuronal expression of MHC-I (referring to MHC-I genes in general) at both RNA and protein levels. We further showed, using both shRNA knockdown and genetic knock-out approaches, that reducing functional expression of MHC-I ameliorated AD-related Tau pathologies in neurons from both wildtype and human apoE-expressing mice. Our discovery of cell-by-cell correlations, as well as a causal link between neuronal apoE, neuronal MHC-I, and AD-related pathologies, provides insight into a potential mechanism by which these proteins may work in the same or interrelated pathways to contribute to selective neurodegeneration in AD.
Results
snRNA-seq analysis of the hippocampus in human apoE-KI mice
We first generated snRNA-seq data on isolated hippocampi from female human apoE3-KI and apoE4-KI mice at 5, 10, 15, and 20 months of age (N = 4 per genotype and age) (Fig. 1a). Female mice were used due to their susceptibility to apoE4-induced neuronal and behavioral deficits during aging24. After normalization and filtering, the dataset contained 21,204 genes across 123,489 nuclei (Fig. 1b). Clustering by shared nearest neighbor (SNN) and visualization by t-stochastic neighbor embedding (tSNE) revealed 27 distinct cell-type clusters. We matched these clusters to known cell types by examining expression of canonical cell-type specific genes25, expression of genes identified in publicly available mouse hippocampal single-cell RNA sequencing datasets26,27, and the expression of each cluster’s marker genes in a publicly available resource of brain-wide in-situ hybridization images28 (Extended Data Fig. 1 and Supplementary Table 1). These analyses together identified 16 distinct neuronal clusters, encompassing 105,644 cells, and 11 non-neuronal clusters, encompassing 17,845 cells (Fig. 1b).
Figure 1. Principal components analysis (PCA) reveals the most prominent sources of cell-by-cell variation within each cell type in human apoE-KI mouse hippocampus.
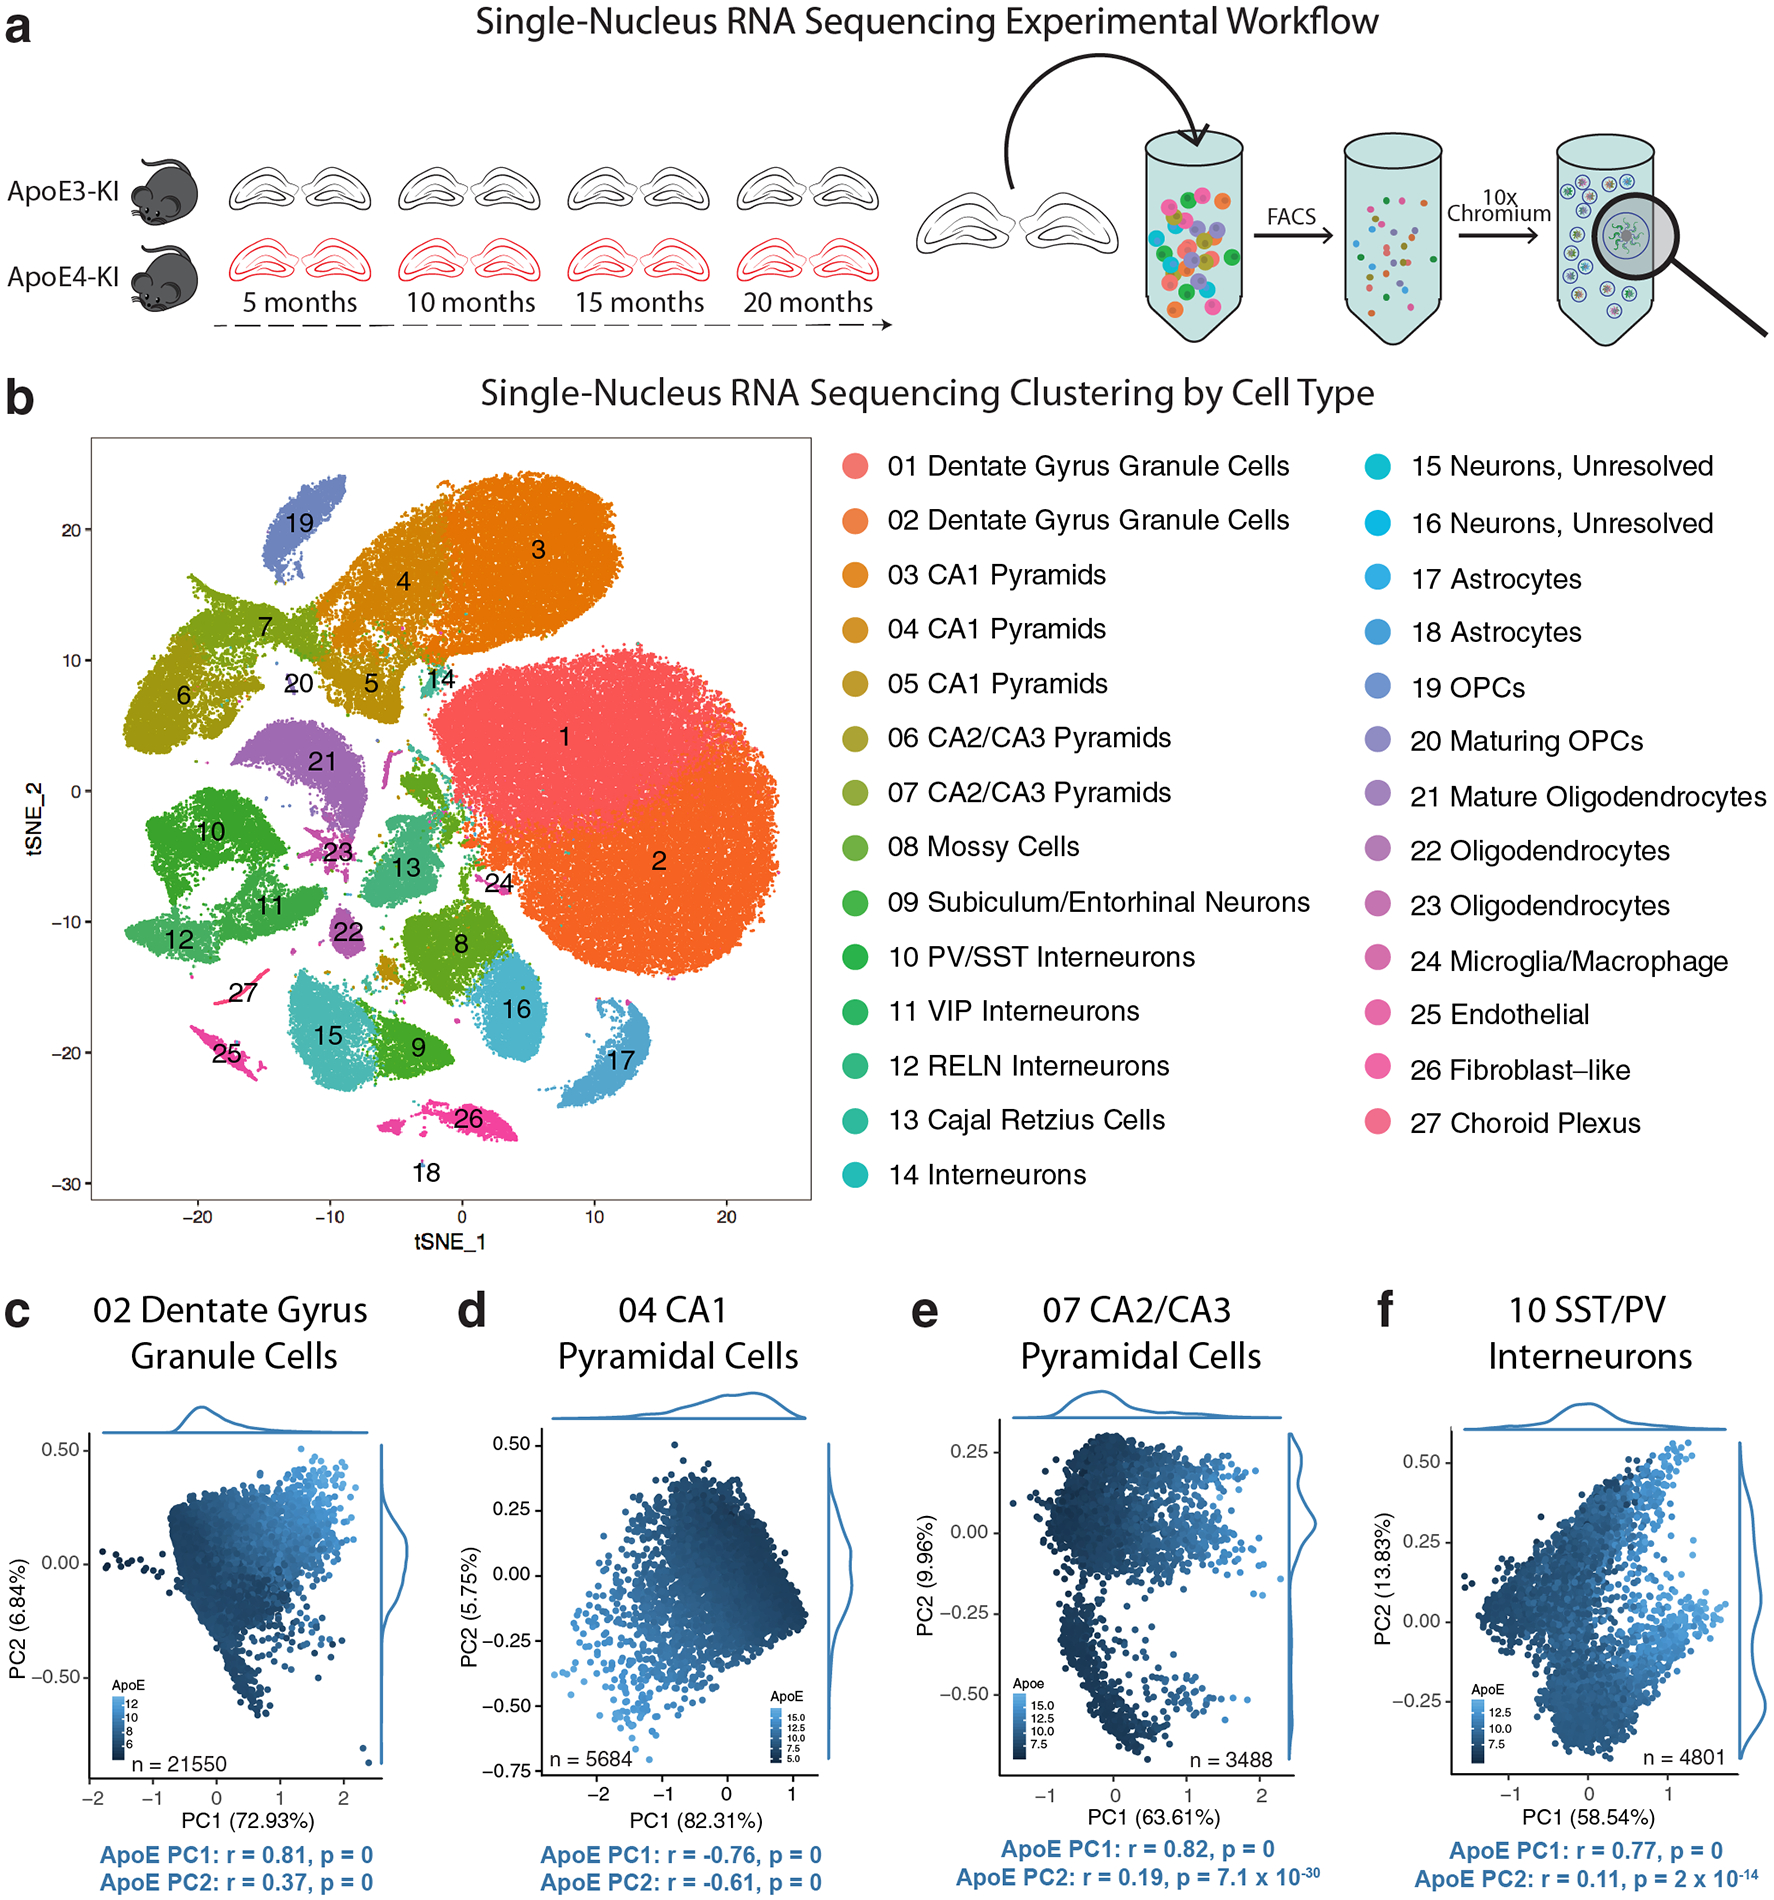
a, Experimental design. Hippocampi were extracted from female apoE3-KI and apoE4-KI mice at 5, 10, 15, and 20 months of age (N = 4 per genotype and age). The hippocampi were dissociated, nuclei were labeled with DAPI and isolated using flow cytometry before processing using the 10x Chromium v2 system for snRNA-seq. b, Clustering using the Seurat package revealed 27 distinct cellular populations. Marker gene analysis led to the identification of 16 neuronal clusters (Clusters 1–16) and 11 non-neuronal clusters (Clusters 17–27). c, In Cluster 2 DG cells (n = 21550), apoE expression is strongly correlated with PC1 (Pearson’s correlation coefficient; r = 0.81, p = 0) and PC2 (Pearson’s correlation coefficient; r = 0.37, p = 0). d, In Cluster 4 CA1 Pyramid cells (n = 5684), apoE expression is strongly correlated with PC1 (Pearson’s correlation coefficient; r = −0.76, p = 0) and PC2 (Pearson’s correlation coefficient; r = −0.61, p = 0). e, In Cluster 4 CA2/CA3 Pyramid cells (n = 3488), apoE expression is strongly correlated with PC1 (Pearson’s correlation coefficient; r = 0.82, p = 0) and PC2 (Pearson’s correlation coefficient; r = 0.19, p = 7.1 × 10⁻³⁰). f, In Cluster 10 SST/PV interneurons (n = 4801), apoE expression is strongly correlated with PC1 (Pearson’s correlation coefficient; r = 0.77, p = 0) and PC2 (Pearson’s correlation coefficient; r = 0.11, p = 2.0 × 10⁻¹⁴).
Expression of apoE as a major contributing factor to cell-by-cell variance for hippocampal neuronal cell types in apoE-KI mice
To examine the within-cell-type variability of each of the neuronal clusters, we processed our data using a Markov affinity-based graph method29 and visualized each cell population using principal component analysis (PCA). This revealed a strong correlation between the first two PCs and neuronal apoE expression. In dentate gyrus (DG) granule cells (Fig. 1c), for example, the first PC, explaining 73% of within-cell-type variability, was directly correlated to levels of neuronal apoE expression (r = 0.81, p = 0). We observed significant correlation between apoE expression and the first two PCs across multiple other hippocampal neuron types, including CA1 and CA2/CA3 neurons and SST/PV interneurons (Fig. 1d–f). We noted that these patterns are not driven by measures of read depth or quality, such as number of genes, number of unique molecular identifiers (nUMI), or percent mitochondrial genes (Extended Data Fig. 2a–d). Likewise, they were not explained by age or apoE genotype (Extended Data Fig. 2e–h), nor was there evidence of doublets formed between neurons and astrocytes (Extended Data Fig. 2i–l).
ApoE expression correlates with multiple cellular stress and immune response pathways in most hippocampal neuronal, but not astrocytic, cell types in apoE-KI mice
We noted that apoE was expressed at variable levels across neuronal types. To further examine the implications of neuronal apoE expression, we assigned each cell an expression score for the genes in each Kyoto Encyclopedia of Genes and Genomes (KEGG) pathway30, then examined which pathways were most correlated with apoE expression on a cell-by-cell basis. We performed hierarchical clustering of these apoE-by-pathway correlations and visualized the results as a heatmap (Fig. 2a and Supplementary Table 2). The relationship between apoE gene expression and the pathway scores was highly consistent, with minimal contribution from apoE genotype or age (Extended Data Fig. 3), so we opted to combine all samples for this analysis. Although this analysis could have generated a list of up to 160 pathways (10 unique pathways for each of the 16 neuronal types), the complete list was comprised of just 41 pathways, indicating a high degree of overlap across neuronal cell types.
Figure 2. The top correlates of neuronal apoE expression in human apoE-KI mouse hippocampus are enriched for cellular stress and immune response pathways.
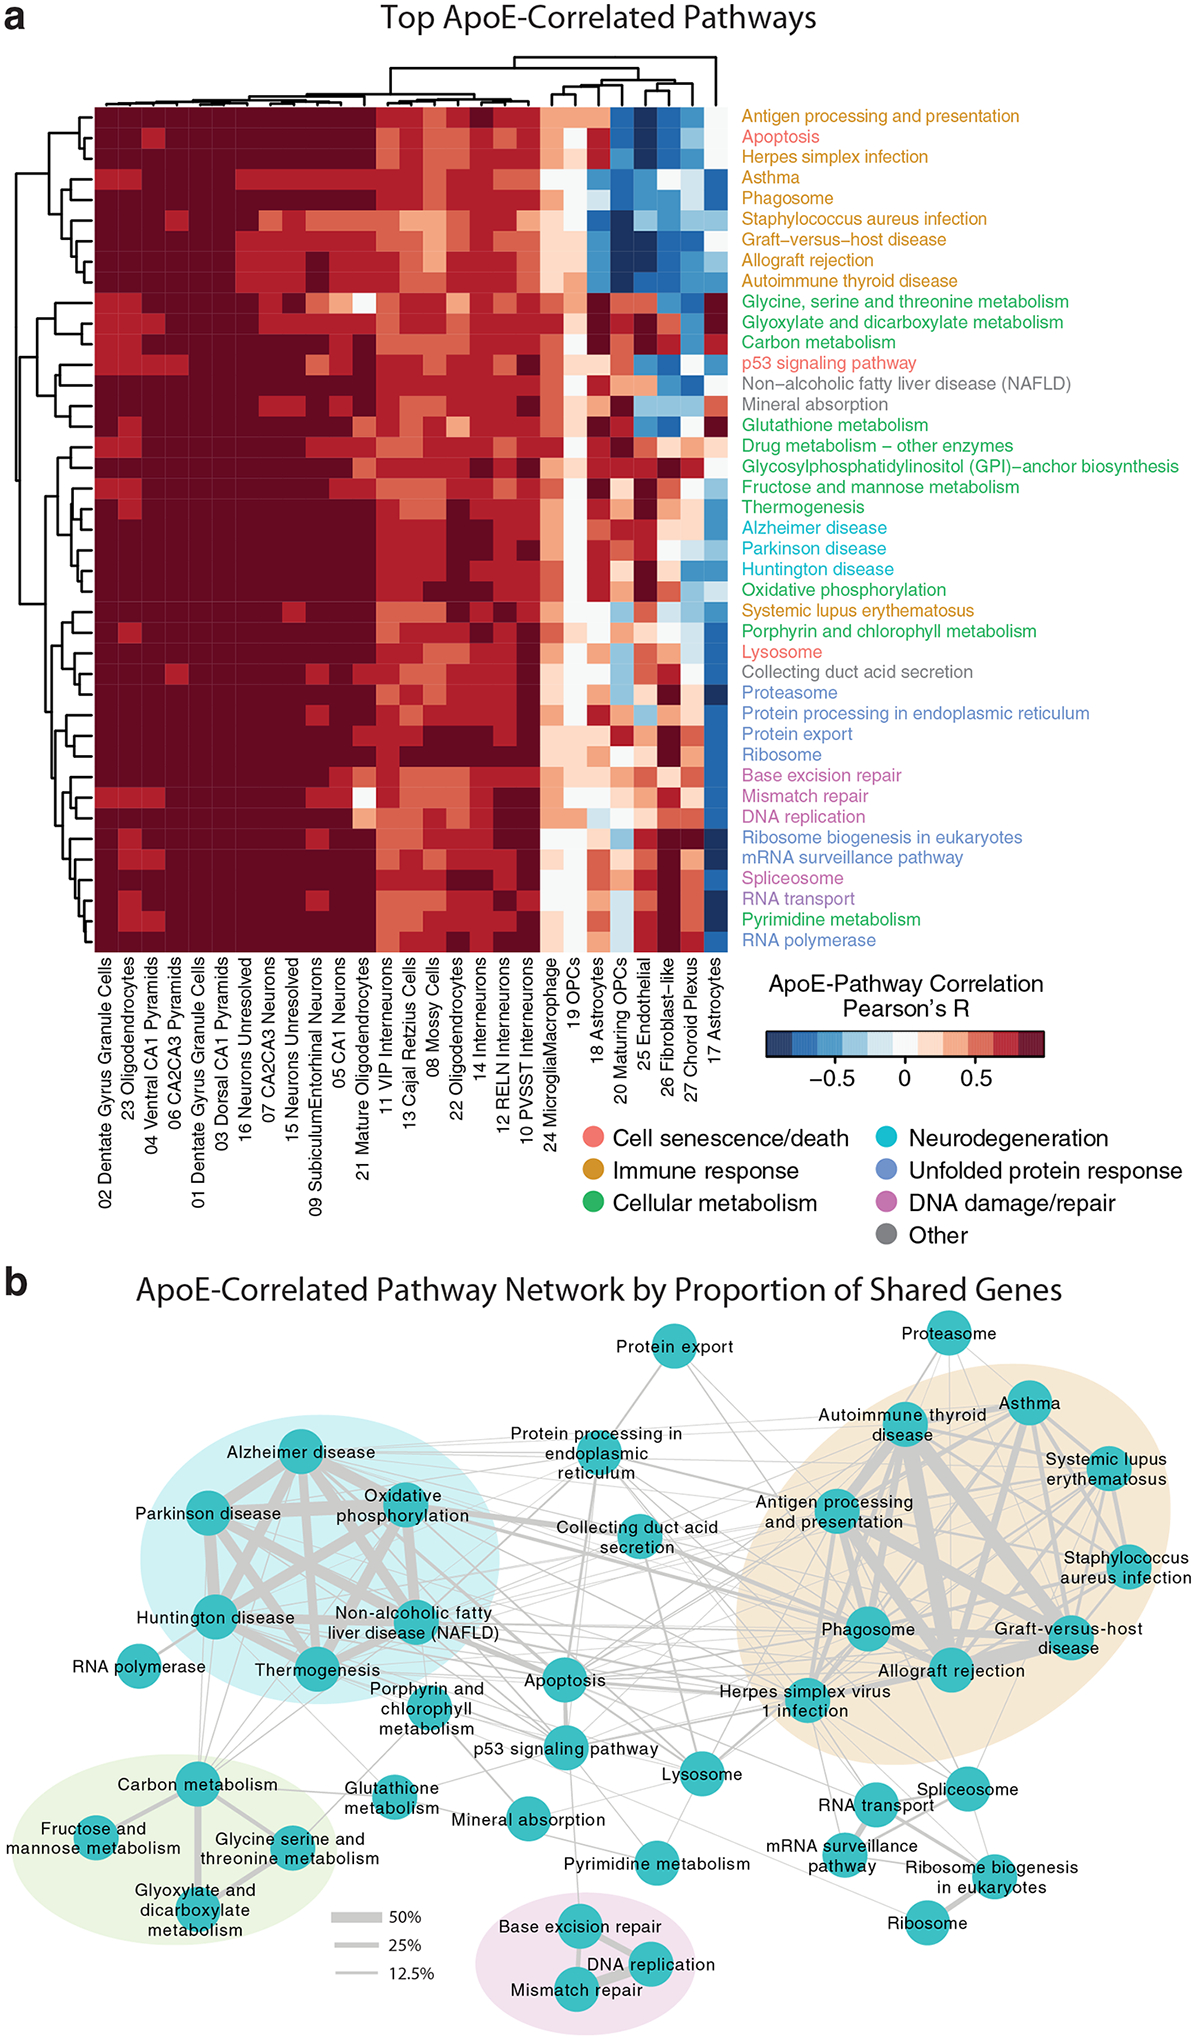
a, A direct examination of the 10 pathways most correlated with apoE expression in each neuronal cell type reveals pathways related to cellular metabolism, cell death, neurodegeneration, unfolded protein response, DNA damage and repair, and immune response. Color scale represents Pearson’s correlation coefficient; r between apoE expression and expression of each pathway for each cluster of cells. b, Network visualization of the proportion of shared genes amongst the pathways represented in a. There are four main modules of inter-related pathways. The blue module is related to neurodegenerative disease and includes the Alzheimer disease, Huntington disease, and Parkinson disease pathways. The green module relates to cellular metabolism, and the pink module relates to DNA replication and repair. The largest module, consisting of nine apoE-correlated pathways, relates to immune response (orange).
These pathways represented a number of known downstream effects of neuronal apoE expression, such as metabolic disruption15, neurodegeneration3,4, and cellular senescence and apoptosis16. Interestingly, this analysis also uncovered many pathways that are already of interest to the AD research community, but that had not previously been linked to neuronal apoE, including pathways related to DNA damage and repair31, the unfolded protein response32, and immune response33. Finally, we noted an overall pattern of apoE-by-pathway correlations, where these relationships were strongest in excitatory neurons, intermediate in inhibitory interneurons and oligodendrocytes, and weakest and even anti-correlated in astrocytes, OPCs, endothelial, and choroid plexus cells (Fig. 2a), suggesting cell-type-dependent effects of apoE expression on cell signaling pathways.
In examining the relationships among the top neuronal apoE-correlated pathways, we found that some pathways were tightly interconnected into modules (Fig. 2b). In these modules, some pathways were expected to relate to neuronal apoE expression. For example, one module contained densely-interconnected pathways related to neurodegenerative disease, including the AD, Huntington disease, and Parkinson disease pathways (Fig. 2b, blue). Additionally, we found a module related to cellular metabolism (Fig. 2b, green), and one related to DNA replication and repair (Fig. 2b, pink). Strikingly, however, the largest module of neuronal apoE-correlated pathways contained those that relate to immune response (Fig. 2b, orange). Among these immune-response pathways were pathways related to autoimmunity and those related to response to infections.
We found similar relationships between neuronal apoE expression level and cellular stress and immune response pathways in a snRNA-seq dataset of mouse cortical neurons, which would express normal mouse apoE34 (Extended Data Fig. 4). Again, the largest module of mouse neuronal apoE-correlated pathways contained those that relate to immune response, including both autoimmune-related and infection-response pathways. These data indicate that the relationship of neuronal apoE expression to the expression of cellular stress and immune response pathways is generally applicable to both human and mouse apoE, occurs during normal physiology, and is potentially exacerbated in disease.
Neuronal apoE expression correlates with cellular stress and immune response pathways in brains of persons with mild cognitive impairment (MCI) or Alzheimer’s dementia
We next wanted to examine whether the observed effects of neuronal apoE expression on cellular stress and immune response pathways are relevant to human brains with cognitive impairment (MCI or Alzheimer’s dementia). To address this question, a snRNA-seq dataset from the prefrontal cortex of 48 individuals from the ROSMAP cohort35 was assessed (Fig. 3a and Supplementary Table 1). We observed that up to 28% of neurons express apoE at a high level, depending on disease status and neuronal subtype (Fig. 3b). ApoE expression was variable across neuron types, with SST+ interneurons (cluster 12 Inh) having 22% higher median apoE expression than the major clusters of excitatory neurons (clusters 1 Ex and 3 Ex), although they both had much lower apoE expression than astrocytes (cluster 5 Astro). We processed this dataset in a parallel manner to the mouse snRNA-seq, assigning a pathway expression score for every KEGG pathway to every cell. As in the mouse data, we again found that first PCs were highly correlated with apoE expression across multiple neuronal subtypes (Extended Data Fig. 5), suggesting that neuronal apoE expression is potentially an important driver of within-cell-type variability in both mouse and human brains.
Figure 3. Neuronal apoE expression correlates with cellular stress and immune response pathways in brains of persons with MCI or AD.
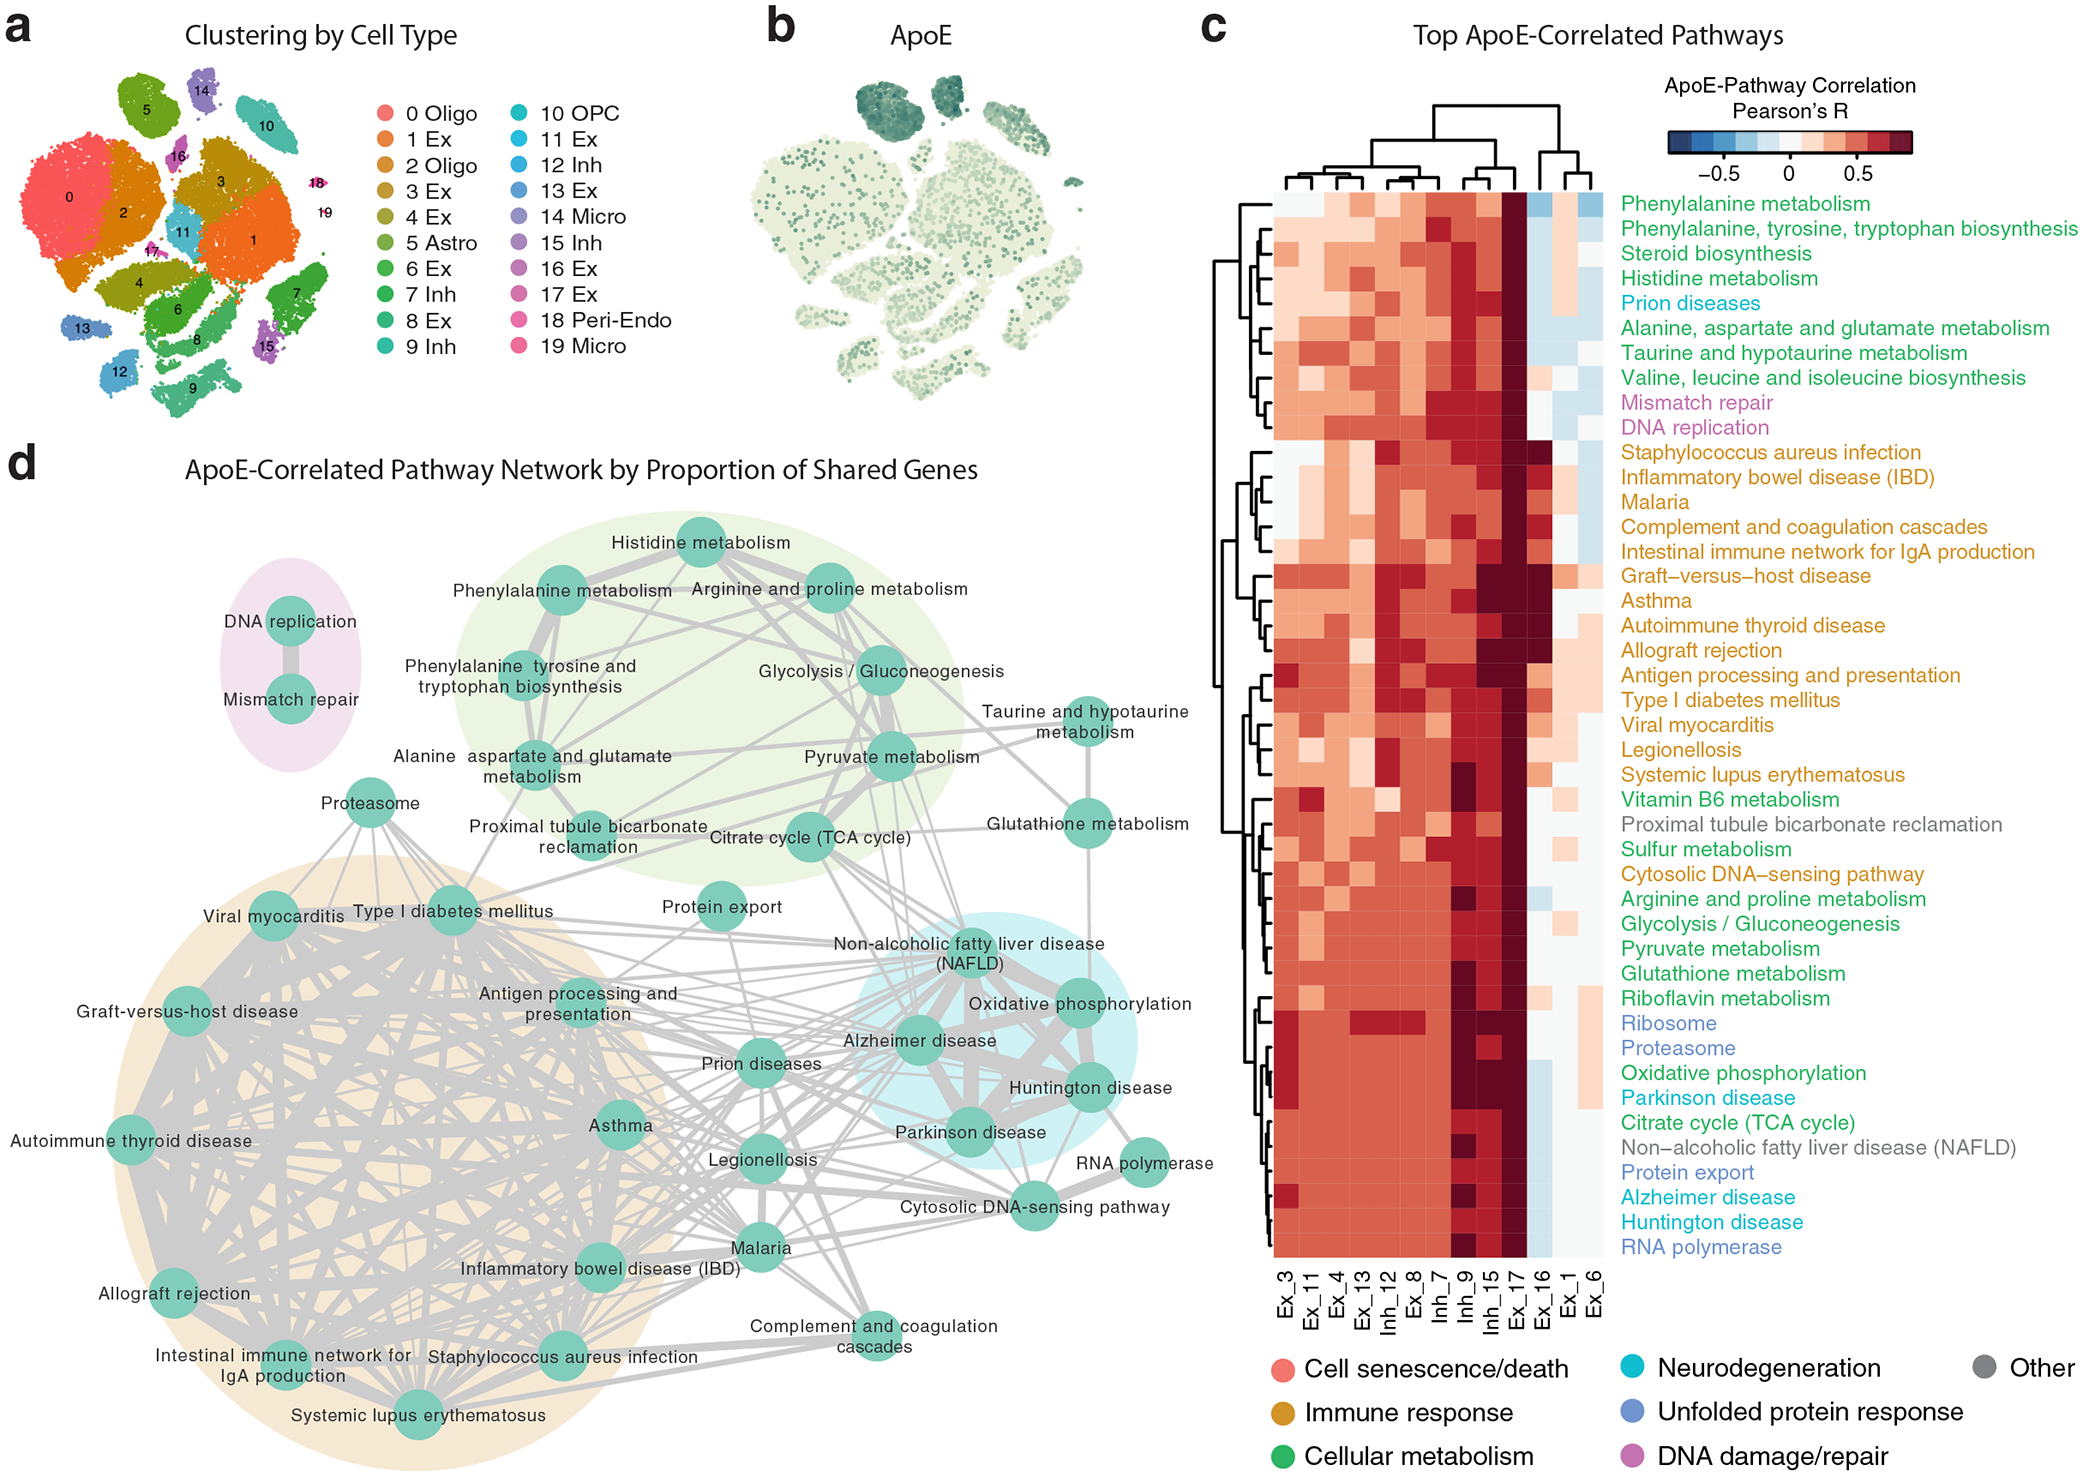
a, tSNE clustering, showing 9 clusters of excitatory neurons, 4 clusters of inhibitory neurons, two clusters of oligodendrocytes, and clusters consisting of astrocytes, microglia, OPCs, pericytes, and endothelial cells. N = 48 human subjects from ROSMAP. b, Feature plot illustrating relative levels of apoE expression across all cells. Up to 28% of neurons, depending on neuronal subtype and disease status, express apoE at a high level. c, Heatmap illustrating the correlation between apoE expression and KEGG pathway expression scores for the top 10 apoE expression-correlated pathways from each subset of neurons. Color scale represents Pearson’s correlation coefficient; r. d, Network plot illustrating the proportion of shared genes amongst apoE expression-correlated pathways. Edge width represents proportion of shared genes. There are four main modules of inter-related pathways. These include neurodegenerative disease (blue), cellular metabolism (green), DNA damage and repair (pink), and immune response (orange).
We then queried the pathways whose expression most correlates with apoE expression within each neuron type (Fig. 3c and Supplementary Table 2). Of the 42 pathways identified, 18 were shared with the mouse data (43%, Monte Carlo test, p < 0.001). Additionally, categories of pathways similar to those from the mouse data were also represented, including pathways related to neurodegeneration, cellular metabolism, DNA damage and repair, unfolded protein response, and immune response. Importantly, this similarity suggests the potential for translation of these findings and their mechanisms between mouse models and human patients. These fundamental patterns were further replicated in both an additional dataset of human temporal cortex snRNA-seq data (Extended Data Fig. 6a–d), as well as in a dataset of human single-cell RNA sequencing36 (Extended Data Fig. 6e–g), both with no known neuropathology. These additional analyses suggest that the relationship between neuronal apoE expression and the expression of cellular stress and immune response pathways holds, not just during disease, but also under normal physiological conditions, both in mice and in humans.
We also found that, as in the mouse data, these pathways clustered into four main modules (Fig. 3d): cellular metabolism (green), neurodegeneration (blue), DNA damage and repair (pink), and immune response (orange). Again, the largest module was related to immune response, and included both autoimmune-related and infection-response pathways (Fig. 3d).
ApoE4-KI mice exhibit increased proportions of apoE-expression-high neuronal cells at an earlier age than do apoE3-KI mice
In examining the level and distribution of apoE mRNA across cell types, we noticed differences in both the median gene expression and the distribution of apoE expression across hippocampal cell types in apoE-KI mice. For example, in DG granule cells and CA1 neurons, the median apoE expression was approximately 40% lower than that in SST/PV interneurons, and the median expression in SST/PV cells was less than half of that observed in astrocytes (Fig. 4a–d). We classified cells as apoE-expression-high if they express apoE mRNA at >2 SD above the median expression for that cell type (red dashed lines in Fig. 4a–c). The proportion of apoE-expression-high cells varied in an interesting way by age and apoE genotype across neuronal clusters. In both DG granule cells and CA1 neurons, at 5 months, the proportion of apoE-expression-high cells is similar between apoE3-KI and apoE4-KI mice. Strikingly, in apoE4-KI mice, the proportion of apoE-expression-high cells rises rapidly, peaking (~15–18%) around 10 months, before significantly declining as the mice continue to age (Fig. 4e,f). In apoE3-KI mice, there was a delay in this timeline, with apoE-expression-high cell frequency peaking around 15 months, with a subsequent significant decline (Fig. 4e,f). Importantly, these timelines correlate with the age of onset of neuronal and behavioral deficits in the apoE4-KI mice at 15–16 months of age and apoE3-KI mice at 20–21 months of age2,24. In SST/PV interneurons, in both apoE3-KI and apoE4-KI mice, we saw the highest levels (~15%) of apoE-expression-high cells at 5 months with subsequent decline. This decline was faster and larger in apoE4-KI than in apoE3-KI mice (Fig. 4g). Again this finding aligns with previously observed timelines of GABAergic interneuron degeneration, as SST interneurons in the DG begin to be lost as early as 6 months in this model, with a greater extent and faster decline in apoE4-KI than in apoE3-KI mice during aging2,24. These data suggest a potential causal role for neuronal apoE, especially apoE4, in AD-related selective neuronal degeneration and loss. Strikingly, the apoE expression pattern in astrocytes had no such age and genotype related changes (Fig. 4h), although they had much higher baseline apoE expression levels (Fig. 4d).
Figure 4. Neuron-specific knockout of the apoE gene protects from apoE4-induced neuronal, synaptic, and hippocampal volume loss in aged apoE-KI mice (15 months).
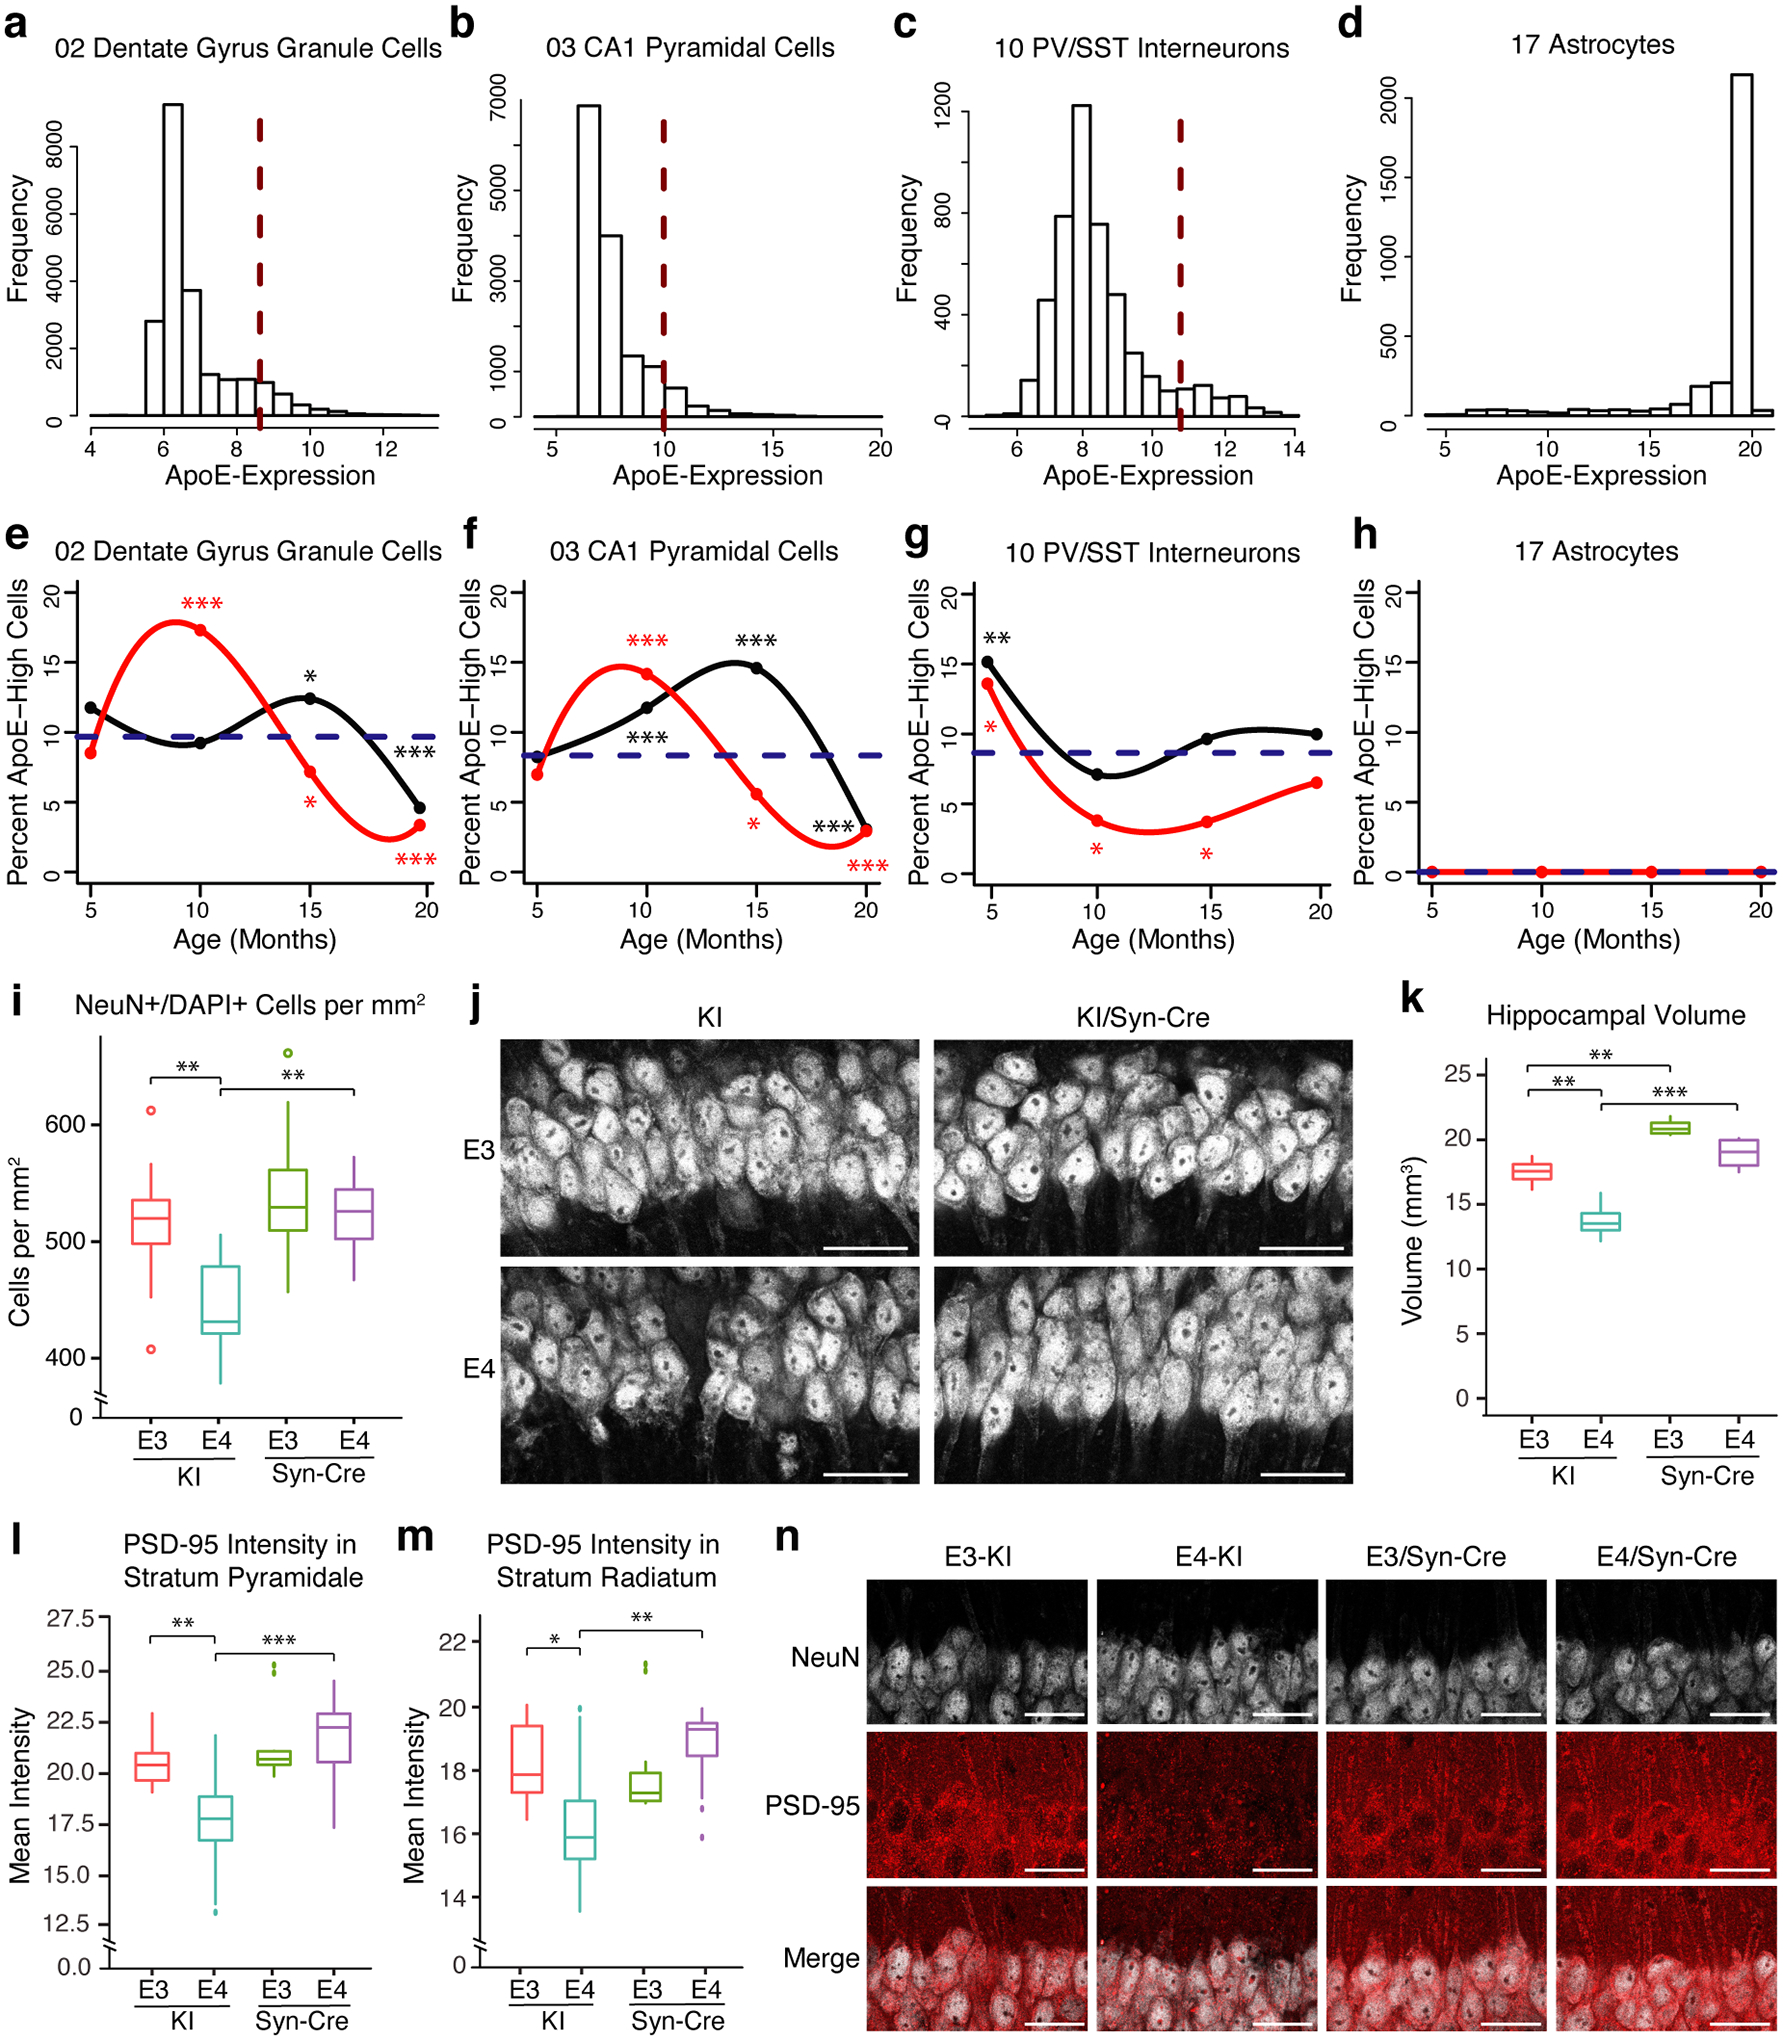
a–d, Differences in both the median gene expression and the distribution of apoE expression across hippocampal cell types. Red dashed lines indicate two standard deviations (SD) above the median apoE expression for each cell type, the threshold for apoE-expression-high cells. e–g, Neurons are defined as apoE-expression-high if they express apoE mRNA at more than 2 SD above the median expression (dashed red lines in a–c) for that cell type. The proportion of apoE-expression-high cells varies by age and genotype (apoE3 in black, apoE4 in red). The blue dashed line indicates the expected proportion of apoE-expression-high cells if age and genotype had no effect on this proportion. In e, Chi-square test of independence by age and genotype, n = 21550, p = 1.5 × 10−129; comparing the observed number of apoE-expression-high cells to the number expected if age and genotype had no effect (df = 7; * p < 0.05, *** p < 0.001; Bonferroni-adjusted p-values for individual post-hoc tests are displayed in Supplemental Table 2). h, Astrocytes have no cells more than 2 SD above the median apoE expression. i, j, Aged apoE4-KI mice have a significantly lower density of NeuN/DAPI double-positive cells in CA1, as compared to apoE3-KI mice (two-way ANOVA with Tukey’s HSD, p = 0.003). Neuron-specific apoE-KO rescues neuronal density in CA1 to apoE3-KI levels (p = 0.001). n = 12 apoE3-KI, 11 apoE3-KI/Syn-Cre, 12 apoE4-KI, 12 apoE4-KI/Syn-Cre. Scale bars = 30μm. k, Hippocampal volume is significantly lower in apoE4-KI mice as compared to apoE3-KI mice (two-way ANOVA with Tukey’s HSD, p = 0.004). ApoE4-KI hippocampal volume loss is significantly rescued by the neuron-specific knockout of apoE (p = 0.0002). ApoE3-KI hippocampal volume is also enhanced by the neuron-specific knockout of apoE (p = 0.006). n = 4 per group. l, PSD-95 intensity in CA1 cell bodies is significantly lower in apoE4-KI than in apoE3-KI (two-way ANOVA, Tukey’s HSD post-hoc test, p = 0.007) or apoE4-KI/Syn-Cre (p < 0.001) mice. n = 12 per group. m, PSD-95 intensity in CA1 dendrites is significantly lower in apoE4-KI than in apoE3-KI (two-way ANOVA, Tukey’s HSD post-hoc test, p = 0.039) or apoE4-KI/Syn-Cre (p = 0.006) mice. n = 12 per group. In i, k–m, boxplot central line represents the median, hinges represent the 25th and 75th percentile of the data. Whiskers extend to the farthest data point that does not exceed 1.5x the interquartile range. Data points outside that range are plotted individually. * p < 0.05, ** p < 0.01, *** p < 0.001. n, Representative images of NeuN and PSD-95 immunostaining of CA1 cell bodies and dendrites in the hippocampus of apoE3-KI, apoE4-KI, apoE3-KI/Syn-Cre, and apoE4-KI/Syn-Cre mice. Many similar images were collected from 12 mice per group in one experiment. Scale bars = 30μm.
The proportion of apoE-expression-high neuronal cells tracks disease progression in patients with MCI or AD
A complementary pattern was observed in neurons from human brains of the ROSMAP cohort35. In seven out of 13 neuronal types, the proportion of apoE-expression-high neurons (defined as cells with apoE expression >2 SD above the median for that neuron type) was relatively low in individuals with no cognitive impairment (No CI), was highest (~10–28%) in individuals with MCI, and relatively low in individuals with AD (Fig. 5a; repeated-measures one-way ANOVA, n = 13, p = 0.0082). When considering the many potential patterns of apoE-expression-high cell enrichment, observing this pattern in the majority of neuronal cell types is unlikely by chance (Chi-square test; p = 4.9 × 10⁻⁵). This pattern suggests that neuronal apoE expression is up-regulated early in the clinical progression of AD at the stage of MCI and declines thereafter as neurodegeneration advances leading to the dementia stage. To further explore a potential connection between neuronal apoE expression and subsequent cellular loss, we examined whether neuronal cell types that exhibit a large proportion of apoE-expression-high cells at one stage of the disease are lower in number at later stages of disease. Indeed, we found that neuron types with a relatively small proportion of apoE-expression-high cells were not lower with more advanced disease, while those with larger proportions tended to be lower at later disease stages (Fig. 5b).
Figure 5. The proportion of apoE-expression-high neuronal cells tracks disease progression in patients with MCI or AD.
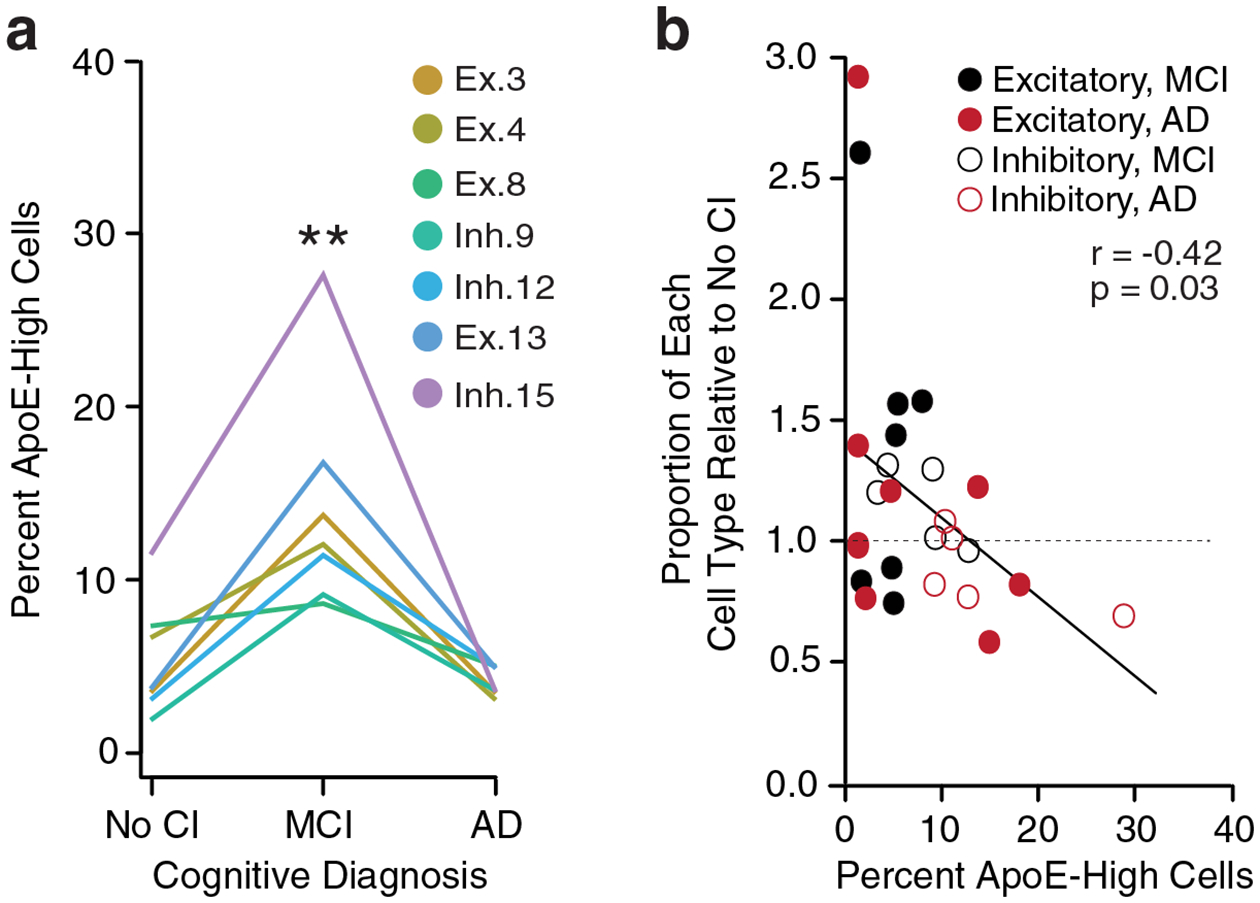
a, The percent apoE-expression-high (>2 SD above the median) population in 7 neuron clusters from patients with MCI or AD by clinical diagnosis, showing that these 7 of the 13 neuronal clusters exhibit an increase in apoE-expression-high cells from no cognitive impairment (No CI) to MCI and a decrease from MCI to AD. The percent apoE-expression-high cells is significantly higher in MCI as compared to other stages (Repeated-measures one-way ANOVA with Geisser-Greenhouse correction, n = 13, F = 8.211, p = 0.0082). b, The percent apoE-expression-high cells at one stage of disease predicts the proportion of each cell type relative to its initial frequency at no cognitive impairment (Pearson’s correlation coefficient; r = −0.42, p = 0.03). Solid black dots reflect excitatory neuron clusters’ percent apoE-expression-high cells at No CI and relative proportion at MCI (where a value of 1 is no change). Solid red dots reflect excitatory neuron clusters’ percent apoE-expression-high cells at MCI and cell type proportions at AD. Open circles reflect the same calculations for inhibitory neuron clusters.
Neuron-specific knockout of the apoE gene protects from neuronal, synaptic, and hippocampal volume loss in aged apoE-KI mice
To directly test the effects of neuron-specific apoE expression on neuronal health and survival, we conducted an immunohistochemical analysis of the hippocampus from aged apoE-KI mice (15 month) as compared to age-matched, LoxP-floxed apoE-KI mice with the apoE gene specifically knocked out of neurons (apoE-KI/Syn-Cre mice). We found that aged apoE4-KI mice have a significantly lower density of NeuN/DAPI double-positive cells in CA1, as compared to apoE3-KI or apoE4-KI/Syn-Cre mice (Fig. 4i,j). Importantly, knocking the apoE gene out of neurons in apoE4-KI/Syn-Cre mice rescued their CA1 neuron density back to apoE3-KI levels (Fig. 4i,j), implying that neuronal apoE4 is sufficient to cause neuronal degeneration and/or loss by age of 15 months. Hippocampal volume, calculated as previously reported14, was also significantly lower in apoE4-KI mice as compared to apoE3-KI mice (Fig. 4k). Interestingly, in both apoE3-KI and apoE4-KI mice, hippocampal volume was significantly larger with neuron-specific knockout of the apoE gene (Fig. 4k), highlighting the critical role of neuronal apoE in neurodegeneration in general.
We also noted a number of synaptic phenotypes that were mediated by neuronal apoE. For example, PSD-95 protein, as measured by immunostaining, was lower in aged apoE4-KI mice compared to apoE3-KI mice, both in the stratum pyramidale and stratum radiatum of CA1 (Fig. 4l–n). Both phenotypes were rescued by neuron-specific apoE knockout (Fig. 4l–n), suggesting that neuronal apoE also mediates synapse loss in aged apoE4-KI mice.
Neuron-specific knockout of the apoE gene reduces MHC-I expression both in vivo and in vitro
Next, we sought to validate the potential role of some of the apoE-correlated pathways in mediating neuronal and synaptic loss in apoE-KI mouse hippocampus. Given the clear import of immune signaling in AD pathogenesis, we chose to focus on the immune response pathways. Analysis of the genes that appear most frequently across the top apoE-correlated immune response pathways revealed that MHC genes appeared enriched across these pathways, and additionally demonstrated strong correlations with apoE expression on a cell-by-cell basis (Fig. 6a).
Figure 6. Neuron-specific knockout of the apoE gene reduces MHC pathway gene, especially MHC-I gene, expression in hippocampal neurons in apoE-KI mice and in primary neurons of WT mice.
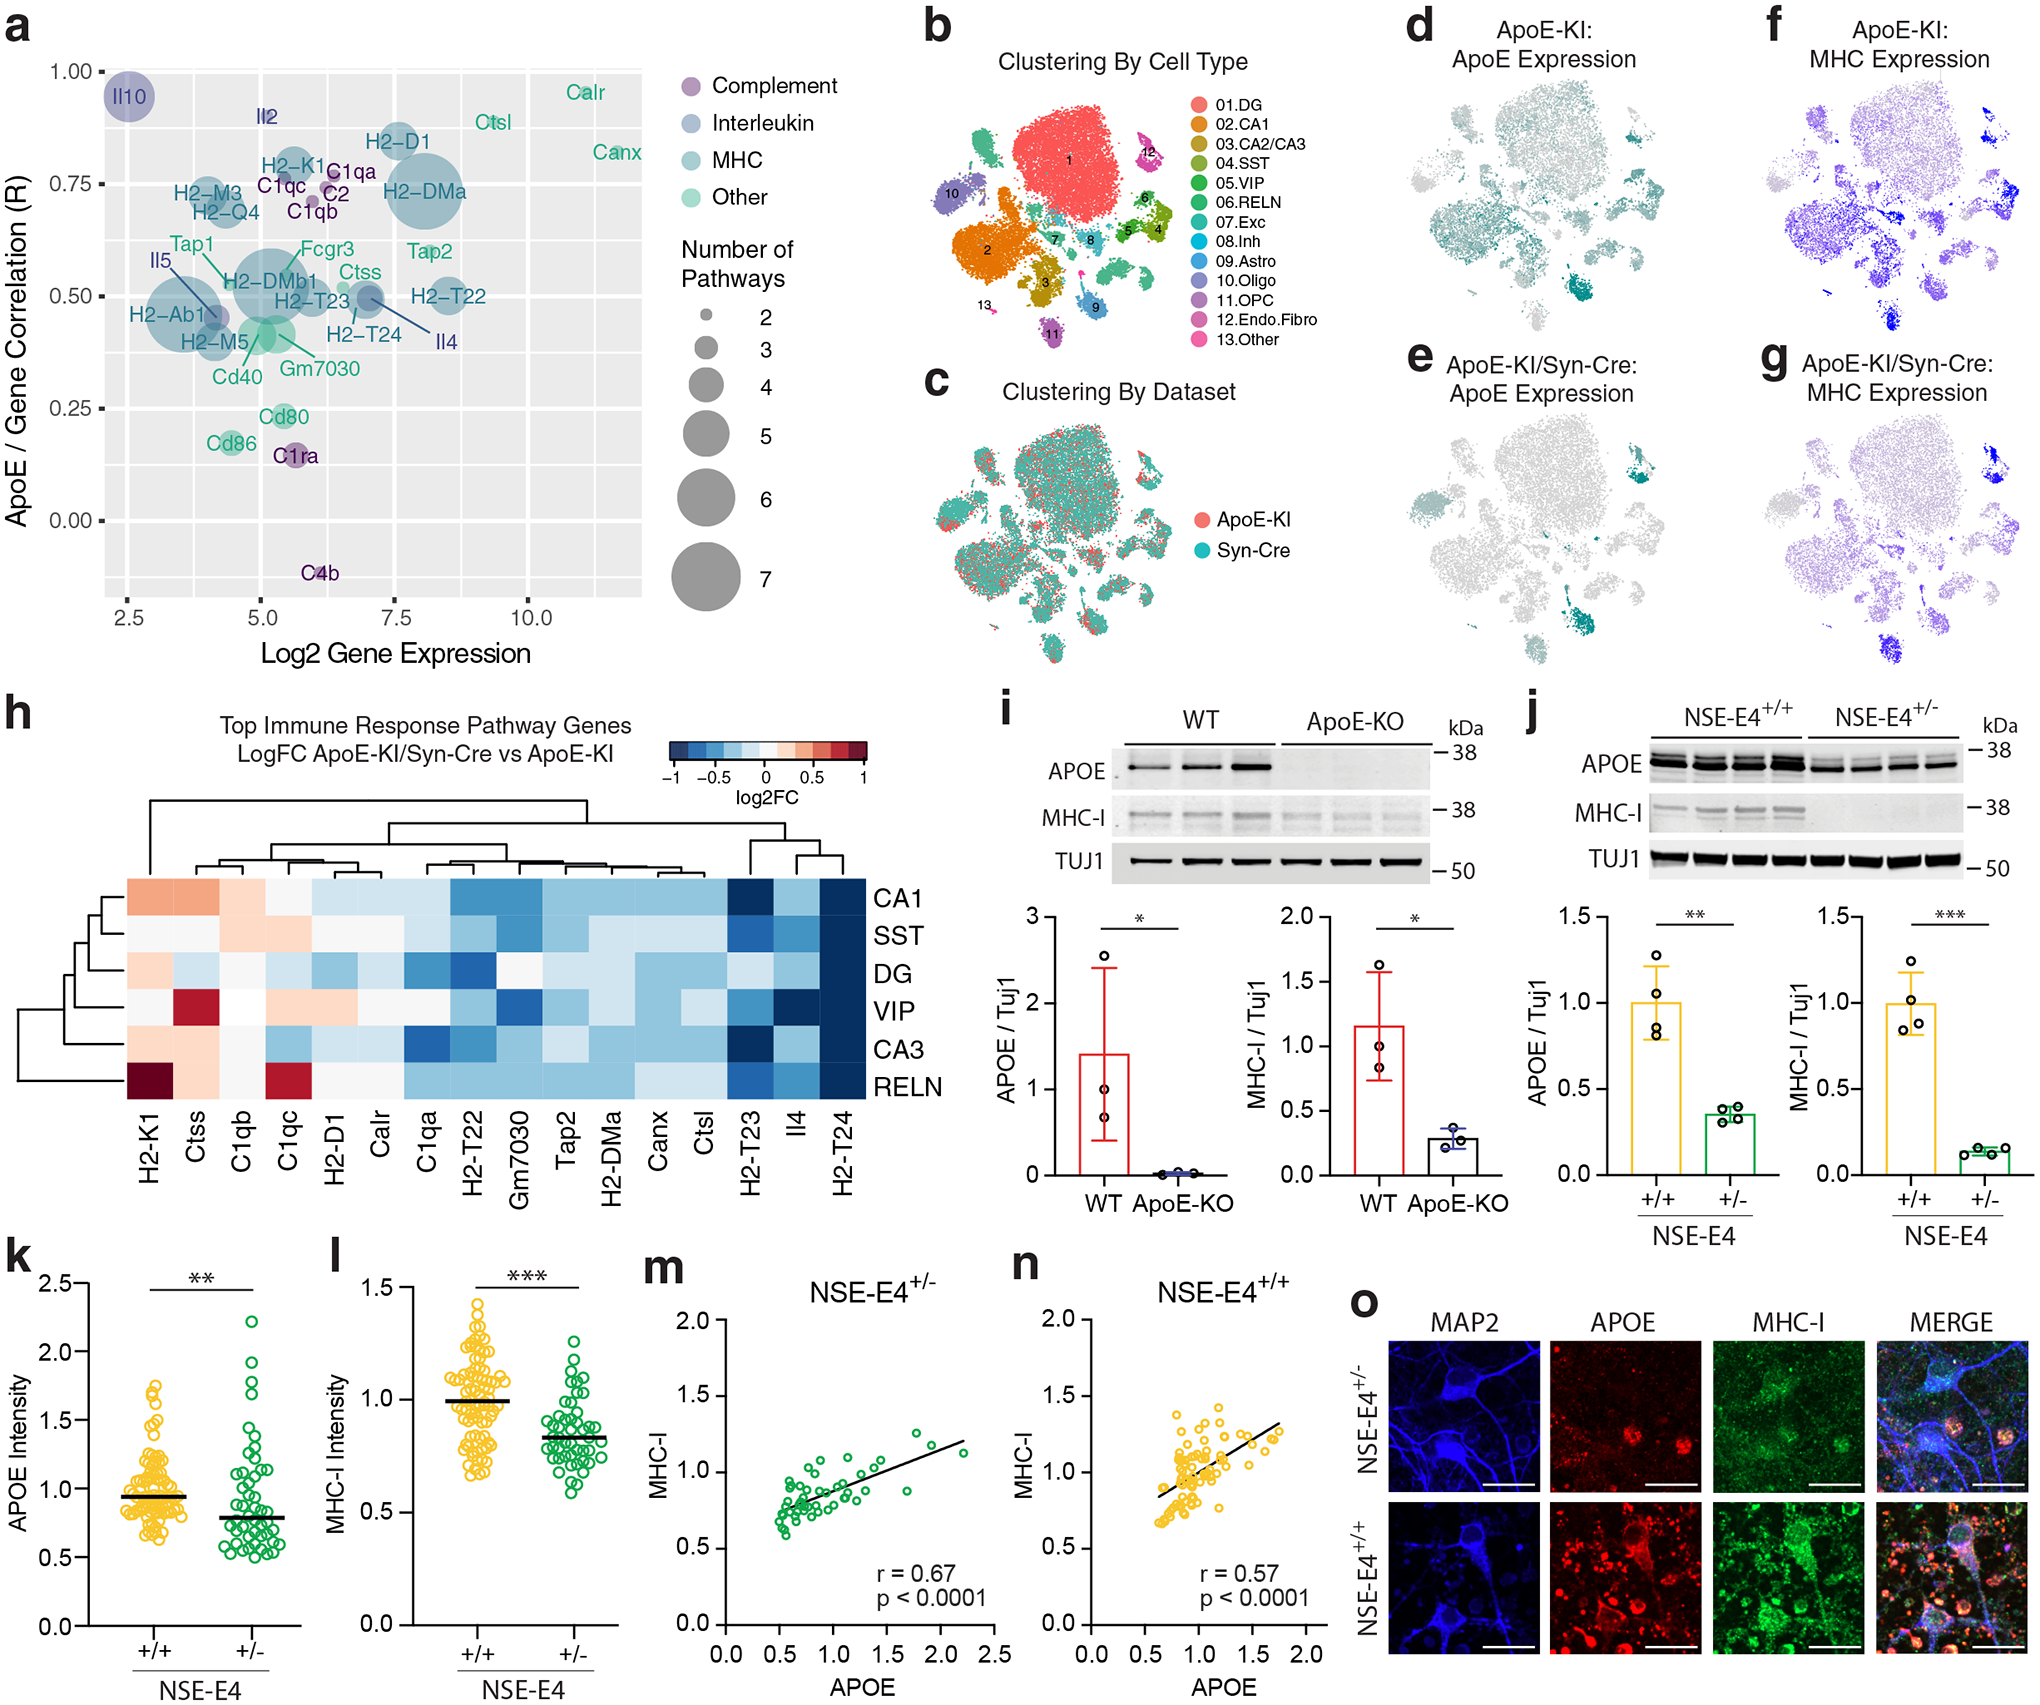
a, Bubble plot representing average gene expression, apoE-gene correlation, and pathway representation among the genes represented in at least two of the top apoE-correlated immune-response pathways. b, Clustering of the combined data from hippocampal snRNA-seq of 15-month-old apoE-KI/Syn-Cre mice and 15-months-old apoE-KI mice, clustered by cell type. c, The datasets were successfully combined using CCA for batch correction. d–g, ApoE expression is abolished specifically in neurons in apoE-KI/Syn-Cre mice (e) relative to apoE-KI mice (d). MHC expression score is substantially reduced across neuronal clusters in apoE-KI/Syn-Cre mice (g) relative to apoE-KI mice (f). h, Genes from the immune response pathway that are differentially expressed in apoE-KI/Syn-Cre neurons relative to apoE-KI neurons. Color indicates log2 fold change. Significance is BH-corrected q < 0.05 by the non-parametric two-sided Wilcoxon rank-sum test. Only genes that are significantly differentially expressed in at least one cell type are shown. i, Western blot analysis of apoE and MHC-I expression in primary neurons from WT versus apoE-KO mice reveals a significant decrease in both apoE (one-sided t-test, t = 2.39, p = 0.038, n = 3 per group) and MHC-I (two-sided t-test, t = 3.53, p = 0.024, n = 3 per group) expression in apoE-KO as compared to WT neurons. Bars represent mean ± SD. j, Western blot analysis of apoE and MHC-I expression in primary neurons from NSE-E4+/− versus NSE-E4+/+ mice reveals a significant decrease in both apoE (two-tailed t-test, t = 5.95, p = 0.001, n = 4 per group) and MHC-I (two-tailed t-test, t = 9.40, p < 0.0001, n = 4 per group) expression in NSE-E4+/− as compared to NSE-E4+/+ neurons. Bars represent mean ± SD. k, l, Immunohistochemical analysis of apoE (k) and MHC-I (l) expression in primary neurons from NSE-E4+/− versus NSE-E4+/+ mice reveals a significant decrease in both apoE (two-sided Mann-Whitney test, U = 1439, p = 0.006, n = 132) and MHC-I (two-sided Mann-Whitney test, U = 1084, p < 0.0001, n = 132) expression in NSE-E4+/− as compared to NSE-E4+/+ neurons. m, n, Immunohistochemical analysis reveals a significant positive cell-by-cell association between apoE and MHC-I expression in both NSE-E4+/− (m, Pearson’s correlation coefficient; r = 0.67, p = 2.5 × 10⁻⁷, n = 48) and NSE-E4+/+ (n, Pearson’s correlation coefficient; r = 0.57, p = 1.5 × 10⁻⁸, n = 84) primary neurons. o, Representative images showing immunostained MAP2, apoE, and MHC-I in NSE-E4+/− and NSE-E4+/+ primary neurons. Many similar images were collected from two primary neuron culture experiments. Scale bars = 20μm. In i–l, * p < 0.05, ** p < 0.01, *** p < 0.001.
To examine whether there is, in fact, a causal relationship between neuronal expression of apoE and neuronal expression of MHC genes, we performed snRNA-seq on four aged (15 month) apoE-KI mice with the apoE gene specifically floxed out of neurons (apoE-KI/Syn-Cre mice). These mice express human apoE in all cells except neurons. We combined the data from age-matched apoE-KI and apoE-KI/Syn-Cre mice using canonical correlation analysis (Fig. 6b,c). We saw representation in both datasets of all major cell types (Fig. 6c and Extended Data Fig. 7a). As expected, a marked reduction of apoE expression was observed specifically in neurons in apoE-KI/Syn-Cre mice (Fig. 6d,e). These data additionally indicate that even neurons expressing a low level of apoE are truly apoE-expressing, as the levels detected in apoE-KI neurons are markedly above noise levels detected in the apoE-KI/Syn-Cre neurons (Extended Data Fig. 7b). We noted that, in the apoE-KI neurons, but not other cell types, the expression of apoE closely tracks the expression of MHC genes on a cell-by-cell basis (Fig. 6d,f). As predicted, in neurons of the apoE-KI/Syn-Cre mice, where the expression of apoE was specifically knocked out, MHC gene expression score was also strongly reduced (compare Fig. 6g to 6f). In examining expression of the individual genes most frequently represented across these immune response pathways, we found significant reduction of multiple MHC-I genes previously reported to be expressed in mouse brains37, including H2-D1, H2-T22, H2-T23, and H2-T24, across neuron types in apoE-KI/Syn-Cre mice (Fig. 6h and Supplementary Table 2). These data strongly suggest that neuronal apoE expression drives neuronal expression of MHC-I genes at the mRNA level.
To further examine the relationship between apoE expression and MHC-I expression, we conducted western blot analysis of apoE and MHC-I levels in primary neuron lysate from either wildtype (WT) or apoE knockout (apoE-KO) mice. This analysis revealed a significant reduction in apoE and, simultaneously, MHC-I levels in apoE-KO neurons as compared to WT neurons (Fig. 6i), demonstrating a causal relationship between neuronal expression of wildtype mouse apoE and MHC-I at the protein level. We additionally conducted western blot analysis of apoE and MHC-I levels in primary neurons derived from mice expressing human apoE4 under the neuron-specific enolase (NSE) promoter (NSE-E4) on a mouse apoE-KO background38. Here, primary neurons from homozygous NSE-E4+/+ mice had significantly higher level of apoE than did neurons from heterozygous NSE-E4+/− mice (Fig. 6j). Importantly, western blot analysis also revealed a significantly higher level of MHC-I in NSE-E4+/+ than in NSE-E4+/− primary neurons (Fig. 6j). Together these data confirm a causal relationship between neuronal apoE expression and neuronal MHC-I expression, both for mouse and human apoE.
We also examined these NSE-E4+/− and NSE-E4+/+ primary neuron cultures using immunocytochemistry. Both apoE (Fig. 6k) and MHC-I (Fig. 6l) protein levels were significantly lower in NSE-E4+/− than in NSE-E4+/+ neurons. Importantly, on a neuron-by-neuron basis, there was also a strong and significant correlation between apoE and MHC-I in both NSE-E4+/− and NSE-E4+/+ primary neurons (Fig. 6m–o), again confirming the relationship between apoE and MHC-I protein level in neurons on a cell-by-cell basis. Finally, we examined whether subject-by-subject differences in neuronal apoE expression level predict MHC-I or beta-2 microglobulin (B2M, a regulator of functional MHC-I expression) gene expression in neurons of human patients with MCI or AD. We found that neuronal apoE expression indeed predicted the expression of multiple MHC-I genes as well as B2M gene in neurons, after controlling for age, sex, apoE genotype, and AD clinical status (Extended Data Fig. 8a). Taken together, these in vitro and in vivo findings support the conclusion that increased neuronal apoE expression indeed increases neuronal MHC-I expression both in mouse models and in human patients.
Functionally reducing neuronal MHC-I ameliorates neuronal apoE-induced Tau pathologies
In examining the relationship between neuronal apoE and AD-related pathologies, we immuno-stained the NSE-E4+/− and NSE-E4+/+ primary neurons with a phosphorylated Tau (p-Tau)-specific antibody (PHF1) that recognizes earliest pathological Tau in AD brains39. Strikingly, NSE-E4+/+ neurons very frequently displayed PHF1-positive p-Tau mislocalized to the neuronal soma, a hallmark pattern of pathological Tau in AD brains40,41, whereas NSE-E4+/− neurons, which had lower levels of apoE4, typically did not show such a phenotype (Fig. 7a,b). Given the relationship between neuronal apoE and neuronal MHC-I, we sought to test whether MHC-I in some way mediates the relationship between increased neuronal apoE4 and p-Tau mislocalization. We treated NSE-E4+/+ primary neurons with lentivirus either containing shRNA against B2M, a protein required for functional expression of all MHC-I genes42,43, or scrambled shRNA control (Fig 7c–g). Although apoE expression level was not altered by expression of B2M-shRNA (Fig. 7c), both B2M (Extended Data Fig. 9a,b) and MHC-I (Fig. 7d) expression were significantly reduced in the B2M-shRNA-treated neurons. Importantly, B2M-knockdown also significantly reduced p-Tau mislocalization both in the soma (Fig 7e,g) and in the dendrites (Fig 7f,g) of NSE-E4+/+ primary neurons. This finding suggests that these AD-related Tau pathologies, which are a downstream result of neuronal apoE4 expression (Fig 7a,b), are in fact mediated by functional MHC-I expression in neurons.
Figure 7. Reducing or eliminating functional MHC-I decreases or rescues AD-related Tau pathologies in apoE4-overexpressing or WT mouse neurons.
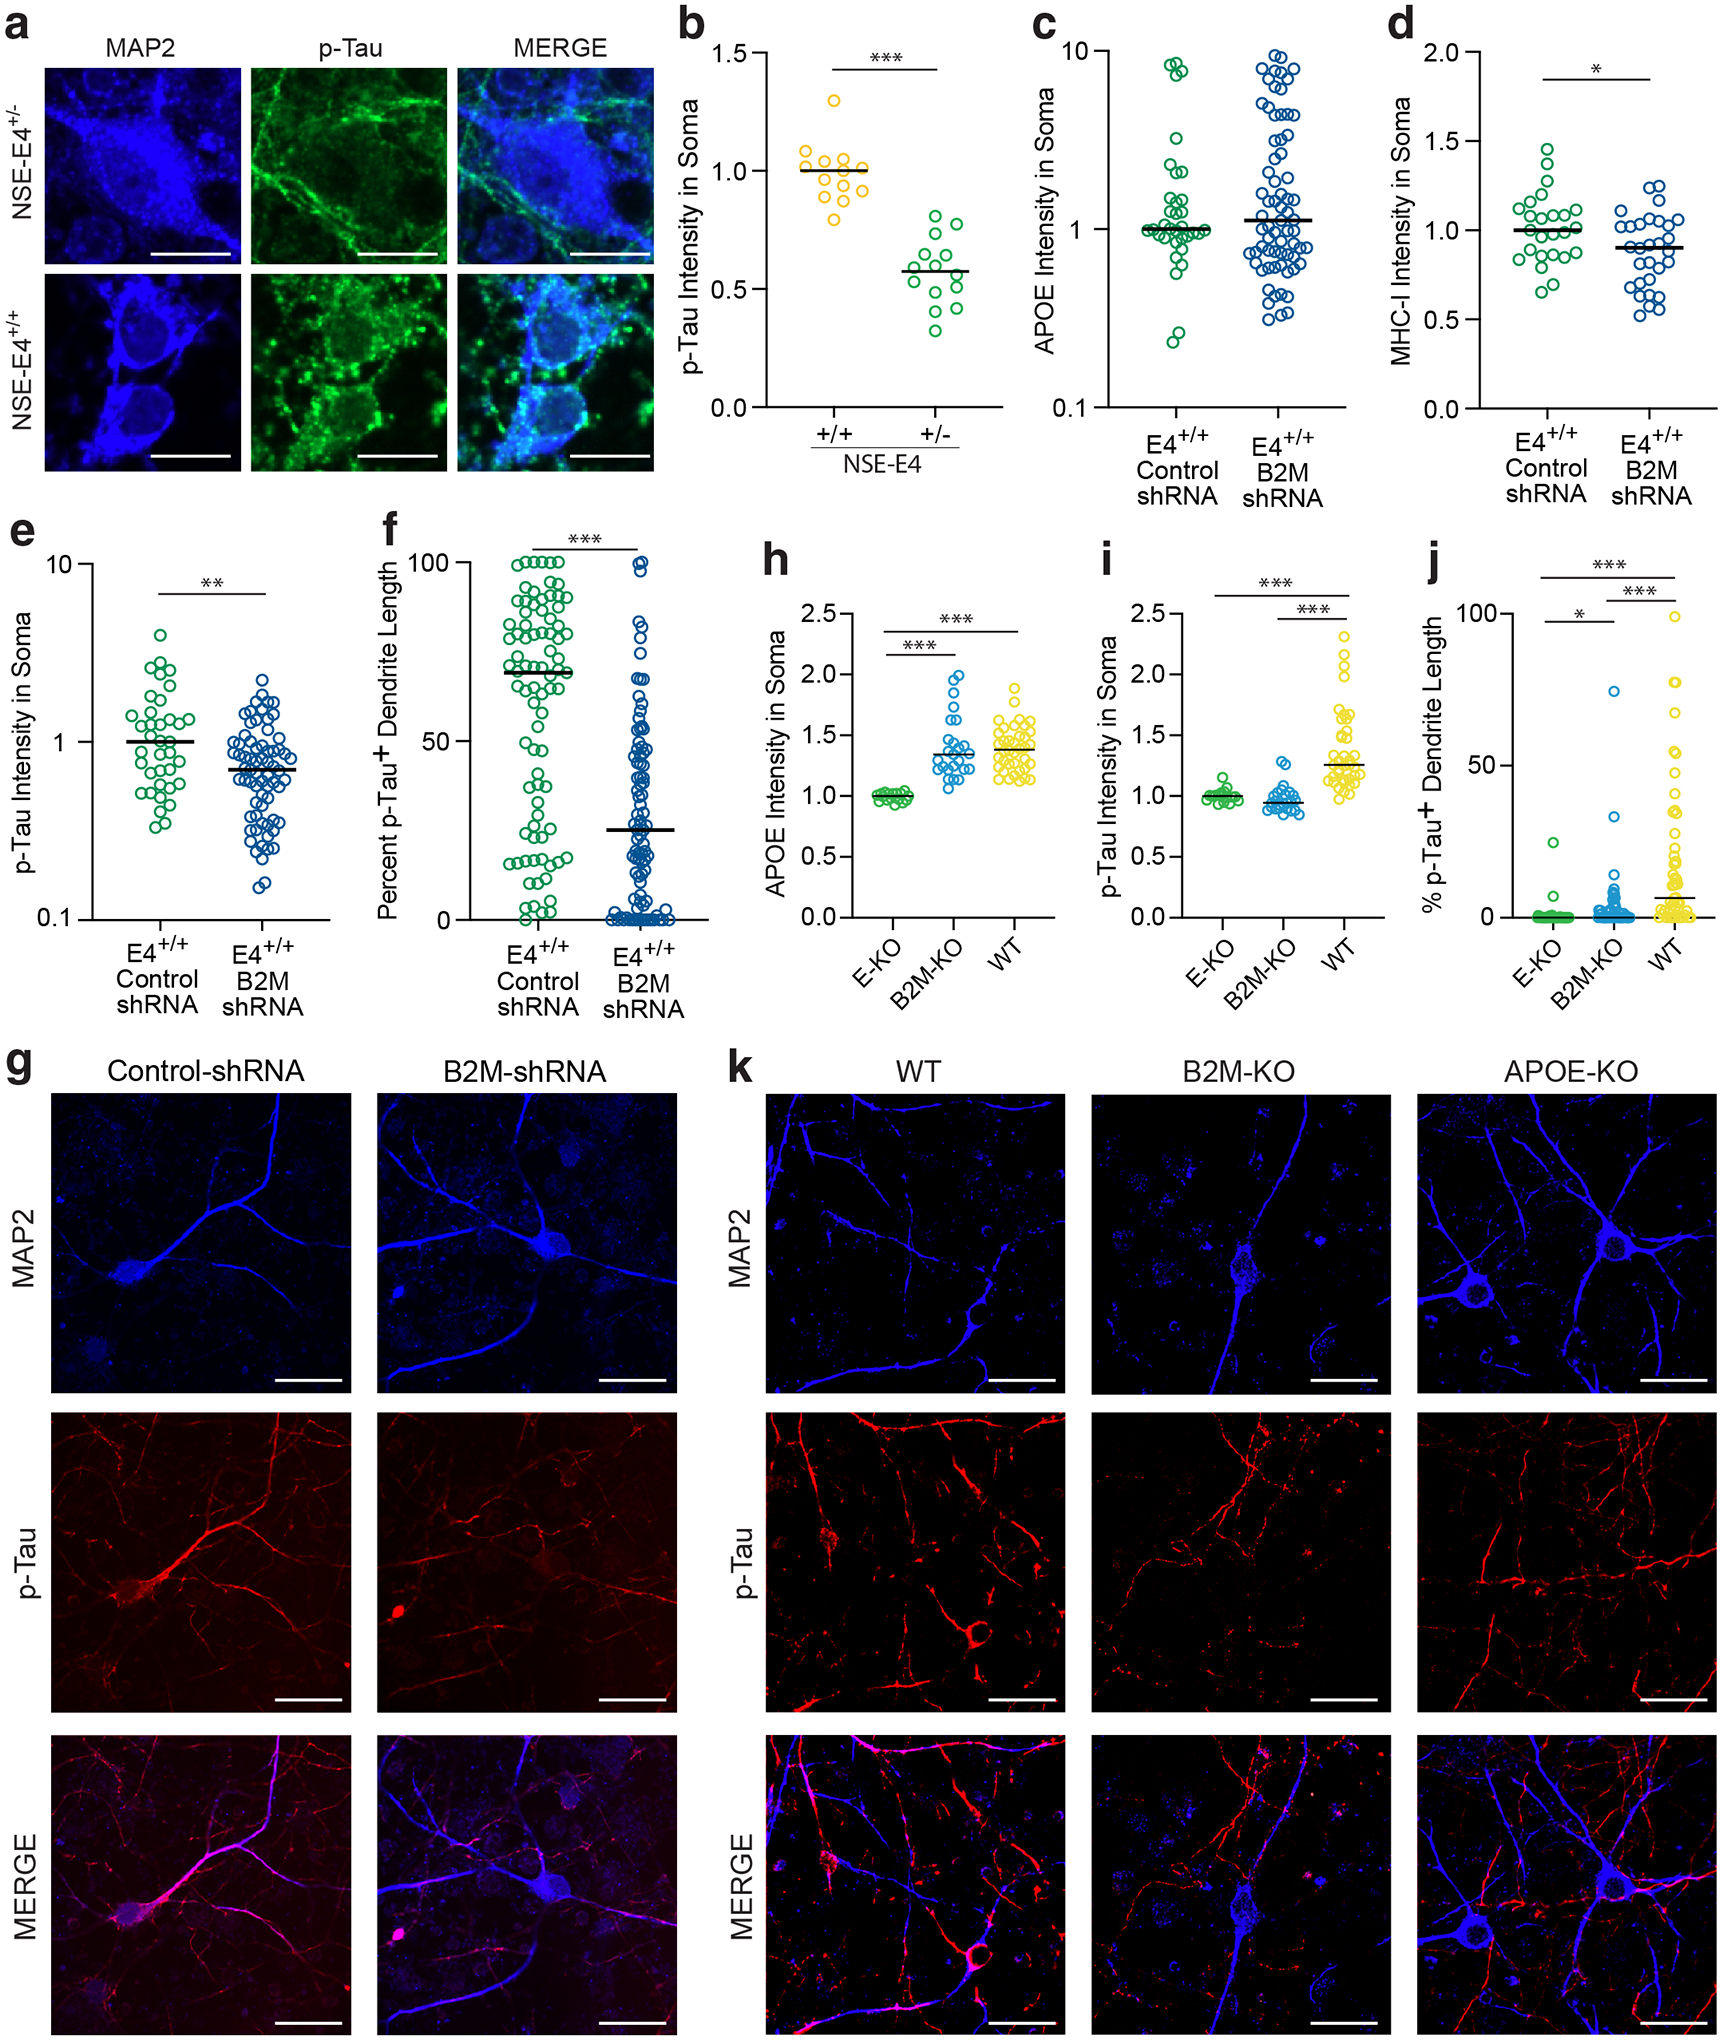
a, Representative immunostaining with MAP2 and p-Tau (PHF1) antibody in primary neurons from NSE-E4+/− and NSE-E4+/+ mice. Many similar images were collected from two primary neuron culture experiments. Scale bars = 10μm. b, p-Tau intensity in neuronal cell bodies is significantly lower in NSE-E4+/− than in NSE-E4+/+ primary neurons (two-sided t-test, t = 8.11, p = 1.8 × 10⁻⁸, n = 27). c, ApoE intensity is unaltered in B2M-shRNA-treated NSE-E4+/+ primary neurons as compared to control shRNA-treated NSE-E4+/+ primary neurons (two-sided Mann-Whitney, U = 1168, p = 0.975, n = 103). d, MHC-I intensity is significantly lower in B2M-shRNA-treated NSE-E4+/+ primary neurons as compared to control shRNA-treated NSE-E4+/+ primary neurons (two-sided Mann-Whitney test, U = 250, p = 0.03, n = 55). e, p-Tau (PHF1) intensity is significantly lower in the soma of B2M-shRNA-treated NSE-E4+/+ primary neurons as compared to control shRNA-treated NSE-E4+/+ primary neurons (two-sided Mann-Whitney test, U = 865, p = 0.006, n = 106). f, Percent of dendrite length positive for p-Tau (PHF1) signal is significantly lowered by B2M-shRNA treatment in NSE-E4+/+ primary neurons (two-sided Mann-Whitney test, U = 1835, p = 1.2 × 10⁻⁸, n = 172). g, Representative images of MAP2 and p-Tau (PHF1) staining in control shRNA-treated and B2M-shRNA-treated NSE-E4+/+ primary neurons. Many similar images were collected from two primary neuron culture experiments. Scale bars = 30μm. h, The intensity of apoE staining is significantly higher in B2M-KO (BH-corrected p = 1.2 × 10⁻¹¹) and WT (BH-corrected p = 8.8 × 10⁻¹⁴) mouse primary neurons as compared to apoE-KO primary neurons (two-sided Kruskal-Wallis test, KW Statistic = 39.78, Dunn’s multiple comparisons correction, n = 80). i, p-Tau intensity is significantly reduced in the soma of primary neurons from apoE-KO (BH-corrected p = 6.4 × 10⁻¹⁰) or B2M-KO (BH-corrected p = 6.0 × 10⁻¹¹) mice as compared to those from WT mice (two-sided Kruskal-Wallis test, KW Statistic = 48.53, Dunn’s multiple comparisons correction, n = 80). j, Percent of dendrite length positive for p-Tau (PHF1) signal is significantly reduced in apoE-KO (BH-corrected p = 1.8 × 10⁻⁹) or B2M-KO (BH-corrected p = 6.2 × 10⁻⁶) primary neurons as compared to WT neurons. B2M-KO primary neurons also have a small but significant increase in dendritic p-Tau as compared to apoE-KO neurons (p = 0.02) (two-sided Kruskal-Wallis test, KW Statistic = 46.91, Dunn’s multiple comparisons correction, n = 149). k, Representative images of MAP2 and p-Tau (PHF1) staining in apoE-KO, B2M-KO, and WT primary neurons. Many similar images were collected from one primary neuron culture experiment. Scale bars = 30μm. In b–j, * p < 0.05, ** p < 0.01, *** p < 0.001.
As further evidence of this relationship, we also compared p-Tau mislocalization in B2M-KO primary neurons as compared to WT or apoE-KO neurons (Fig. 7h–k). As anticipated, apoE expression level was significantly higher in B2M-KO and WT neurons as compared to apoE-KO neurons (Fig. 7h). Also as expected, B2M-KO primary neurons lacked B2M expression as compared to WT primary neurons (Extended Data Fig. 9c). Importantly, p-Tau mislocalization both to neuronal soma (Fig. 7i,k) and to dendrites (Fig. 7j,k) was significantly reduced in B2M-KO and apoE-KO primary neurons as compared to WT primary neurons. In fact, B2M-KO rescued p-Tau mislocalization to a similar level as apoE-KO by both metrics, suggesting that neuronal apoE and MHC-I signaling act in the same or interrelated pathways to cause AD-related Tau pathologies.
To further evaluate the effect of functionally reducing MHC-I on Tau pathology in vivo, we injected an adeno-associated virus-2 (AAV2) expressing human pathological Tau (Tau-P301S) into the hippocampi of WT and B2M-KO mice. We then compared the relative p-Tau pathology 6 weeks after the injection by immunostaining for human Tau (HT7) and p-Tau (PHF1). Functional reduction of MHC-I ameliorated the induced Tau pathology, as determined with the ratio of p-Tau to total human Tau, in both CA1 and DG of the hippocampus (Fig. 8). Finally, we examined whether subject-by-subject differences in MHC-I expression predict Tau pathologies in human patients with MCI or AD. We found a significant effect of multiple MHC-I genes in predicting Tau tangle pathology, but not β-amyloid pathology, after controlling for age, sex, apoE genotype, apoE level, and AD clinical status (Extended Data Fig. 8b, c). Taken together, these in vitro and in vivo findings support the conclusion that functional reduction of MHC-I ameliorates neuronal apoE-induced Tau pathologies.
Figure 8. B2M-KO protects from p-Tau pathology in a Tau-P301S overexpression mouse model.
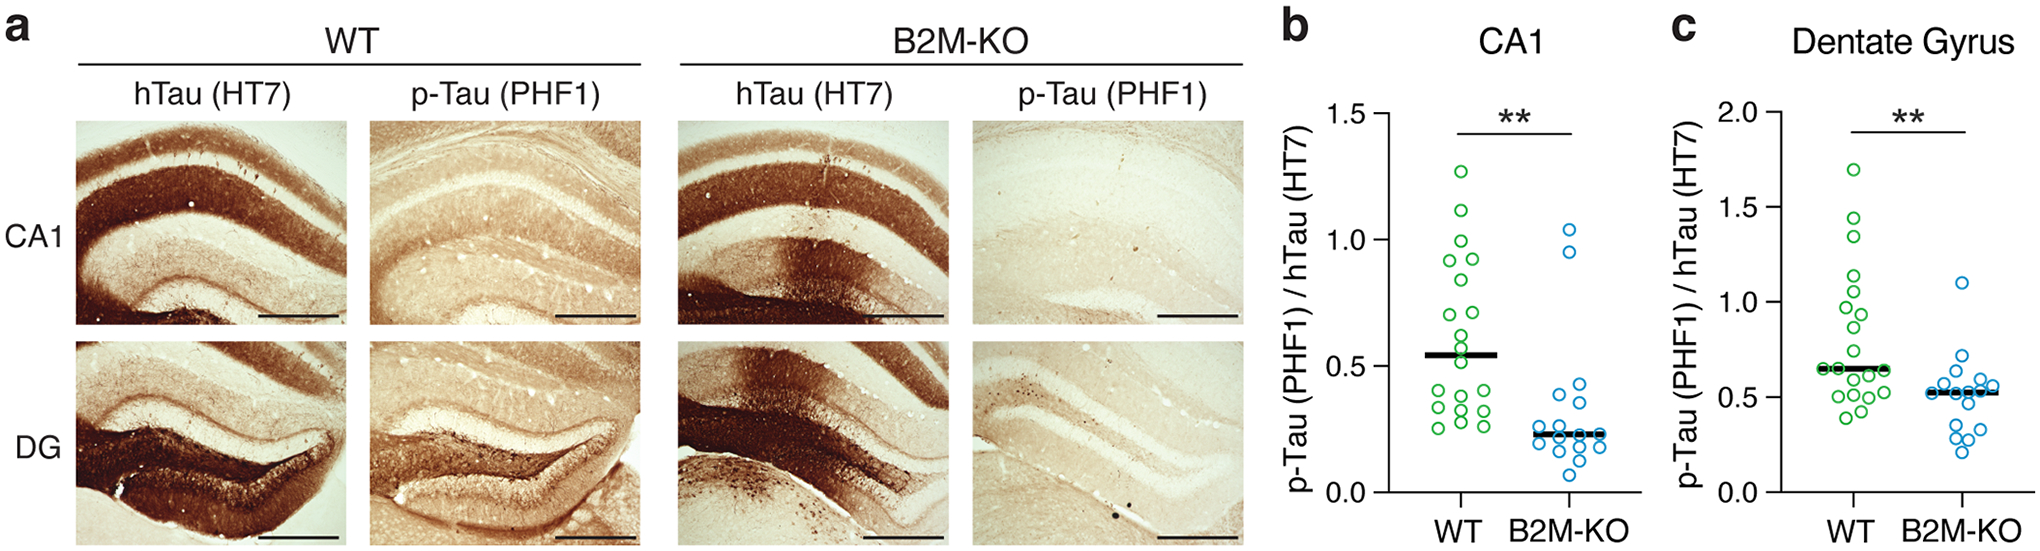
a, Representative DAB-stained images of human tau (hTau), with HT7 antibody, and p-Tau, with PHF1 antibody, from the CA1 and dentate gyrus (DG) of WT and B2M-KO mouse hippocampus 6 weeks after injection with AAV2-Tau-P301S. Even with similar expression of hTau, p-Tau was dramatically reduced in both the CA1 and DG of B2M-KO mouse hippocampus as compared to those of WT mouse hippocampus. Many similar images were collected from different groups of mice in one experiment. Scale bars = 500μm. b, p-Tau/hTau ratio was significantly reduced in CA1 of B2M-KO mouse hippocampus as compared to that of WT mouse hippocampus (two-sided Mann-Whitney Test, p = 0.001, n = 20 WT, 16 B2M-KO. c, p-Tau/hTau ratio was significantly reduced in DG of B2M-KO mouse hippocampus as compared to that of WT mouse hippocampus (two-sided Mann-Whitney Test, p = 0.008, n = 20 WT, 16 B2M-KO).
DISCUSSION
In this study, we exploit the power of snRNA-seq to examine neuron-by-neuron differences in susceptibility to AD-related neurodegeneration. We find that neuronal apoE expression correlates strongly with the primary axes of within-cell-type variability across multiple hippocampal neuron types both in human apoE-KI and in WT mice. We additionally replicate this relationship in humans with MCI or AD, as well as in persons without known neurodegeneration. These findings together suggest that neuronal apoE expression may be an important factor driving within-neuron-type variability under both normal physiological and pathophysiological conditions. By examining which cellular pathways are most closely correlated to neuronal apoE expression, we identify novel associations between neuronal apoE expression and immune-response pathways. These associations are also consistent across human apoE-KI mice, WT mice, humans with MCI or AD, and persons without known neurodegenerative diseases, further suggesting that the role for neuronal apoE expression in within-neuron-type variability may lie in regulating expression of these important immune response pathways under both normal physiological and pathophysiological conditions.
Our findings suggest that neuronal apoE regulates cellular stress and immune response pathways both in health and in disease, and we find that the level of neuronal apoE expression tracks disease progression, both in human apoE-KI mice and in patients with MCI and AD. This finding suggests that pathological upregulation of neuronal apoE, especially apoE4, may play a causal role in selective neurodegeneration—a hypothesis supported by experiments demonstrating that neuron-specific apoE4 knockout rescues synaptic, neuronal, and hippocampal volume loss.
Our study also uncovers a specific link between neuronal apoE and neuronal MHC-I on a cell-by-cell basis. Critically, we demonstrate an upstream regulatory role for neuronal apoE on neuronal MHC-I expression at both the mRNA and protein levels in multiple models, including human apoE-KI, neuron-specific apoE-KO, WT, and neuron-specific apoE4-overexpression mice. Our study further suggests that this apoE-MHC-I link is the beginning of a causal chain driving Tau pathology as well as selective neuronal and synaptic degeneration or loss. It will be of great import for future work to further dissect the intracellular mechanisms leading from increased apoE expression to increased MHC-I expression, as breaking this link provides a novel therapeutic avenue in drug development for preventing or treating AD.
Finally, we find that lowering functional MHC-I by knocking down or knocking out B2M, a protein required for functional expression of all MHC-I genes42,43, is sufficient to significantly reduce Tau pathologies in vitro in cultured primary neurons or in vivo in a pathological Tau-P301S overexpression mouse model. It should be noted that B2M knock down or knockout only functionally reduces MHC-I but does not completely eliminate MHC-I42,43. Nonetheless, these findings demonstrate an upstream role for functional MHC-I in AD-related Tau pathologies in both human apoE overexpression and wildtype mouse neurons. This conclusion is further supported by the observation that multiple MHC-I genes predict Tau tangle pathology in patients with MCI or AD. Prior work in a mouse model of tauopathy demonstrated that human apoE expression, especially of the apoE4 isoform, leads to increased Tau pathology, neuroinflammation, and neuronal loss, while apoE knockout protects against these insults14, suggesting a dose effect of apoE protein on tauopathy. Critically, that study did not address whether neuronal or glial apoE leads to these effects. We and others have previously shown that neuronal, but not astrocytic, apoE4 increases Tau phosphorylation and neurofibrillary tangle (NFT)-like structure formation in neurons8,38,44,45, highlighting the cell-source-specific effects of apoE. This study reveals, for the first time, that neuronal apoE can act through neuronal MHC-I to elicit AD-related Tau pathologies. It will be crucial for future work to dissect the intraneuronal mechanisms underlying the apoE-MHC-I-Tau axis of pathology in AD and to explore the potential effect of microglia on this pathological process.
Together our data support a model that, in response to various cellular stressors during aging, increased neuronal apoE expression acts as a molecular switch, triggers aberrant upregulation of neuronal MHC-I, and drives Tau pathology and the selective destruction of individual synapses and neurons (Extended Data Fig. 10). This destruction could be a symptom of dysregulation of synaptic homeostasis46, or it could be mediated by immune cell partners, as hypothesized in Extended Data Fig. 10, such as reactive microglia33 and/or, MHC-I’s classical partner, CD8+ T-cells, which have recently been shown to patrol the cerebrospinal fluid of AD patients47. This model is in line with the hypothesis that microglia’s developmental role in synaptic pruning is aberrantly re-activated in the process of aging-related neurodegeneration, leading to synaptic and neuronal loss as seen in AD17,22,23,48,49. However, it is highly unlikely that immune cells would attack specific synapses or neurons without a direct signal from the neurons themselves50. Instead, it is conceivable that neurons produce signals that attract, arrest, or activate immune cells in their niche. Our study provides evidence that neuronal apoE-induced MHC-I overexpression might serve as this “eat me” signal from stressed or injured neurons, potentially to microglia and/or CD8+ T-cells (Extended Data Fig. 10).
This study raises many new questions in the context of apoE’s roles in AD pathogenesis: How is neuronal apoE expression regulated under physiological and disease conditions? What are the molecular and cellular mechanisms underlying apoE regulation of neuronal MHC-I expression? Does neuronal apoE-MHC-I-axis present stressed or injured neurons to microglia, T-cells, or both for executing the “eat me” process? How does the neuronal apoE-MHC-I-axis elicit AD-related Tau pathologies? Are there sex-dependent differences in the regulation of apoE-MHC-I-axis and its roles in AD pathogenesis (as the current study focuses on female mice only)? Answering these fundamental questions would shed light on the mechanisms of AD pathogenesis and may also be informative for better understanding the selective vulnerability of neurons in neurodegenerative diseases in general. This study also provides potential new targets for developing drugs to prevent or treat selective neurodegeneration in AD, such as lowering/blocking neuronal expression of apoE, disconnecting apoE-MHC-I-axis in neurons, inhibiting the machinery of MHC-I induction of Tau pathologies, or blocking MHC-I presentation of neurons to immune effector cells. It is conceivable that a combination of some of these approaches would be more effective than any individual intervention in AD prevention and treatment.
Methods
Mice.
All protocols and procedures followed the guidelines of the Laboratory Animal Resource Center at the University of California, San Francisco (UCSF). Experimental and control mice had identical housing conditions from birth through sacrifice (12 h light/dark cycle, at 19–23 °C and 30–70% humidity, housed 5 animals/cage, PicoLab Rodent Diet 20). ApoE3-KI and apoE4-KI homozygous mouse lines (Taconic)51 were born and aged under normal conditions at the Gladstone Institute/UCSF animal facility. ApoE4-KI/Syn-Cre and apoE3-KI/Syn-Cre mice were generated by cross-breeding apoE-floxed-KI mice, which was generated in our lab52, with Syn-Cre mice11.
Human subjects.
Human data came from subjects in the Religious Orders Study or Rush Memory and Aging Project (ROSMAP)53,54. Both studies enroll persons free of dementia who agree to annual clinical evaluation and organ donation at death. Both were approved by an Institutional Review Board of Rush University Medical Center, Chicago, IL. All subjects signed informed consent and an Anatomical Gift Act, and a repository consent to allow their data to be shared. Demographic information on donors from the human MCI/AD single-nucleus RNA sequencing cohort can be found in Supplementary Table 3, in35, and with the deposited data at (https://www.synapse.org/#!Synapse:syn18485175). Demographic information on donors from the healthy normal cohort can be found in Supplementary Table 4, and with the deposited data at http://help.brain-map.org/download/attachments/8323525/CellTypes_Case_Qualification_and_Donors.pdf. More information about accessing ROSMAP data and biosamples can be found at www.radc.rush.edu.
Single-nuclei preparation for 10x loading.
To isolate single nuclei from adult mouse brains, we combined and adapted the 10x Genomics demonstrated protocol for nuclei isolation from adult mouse brain55 and the Allen Brain Institute protocol for FACS sorting of single nuclei56 as follows. Hippocampi were acutely dissected on ice. Dissected hippocampi were placed in 2mL Hibernate A®/B27®/GlutaMAX™ (HEB) medium in a 5mL tube. The HEB medium was removed to a 15mL conical and kept on ice. 2mL of chilled lysis buffer (10 mM Tris-HCl, 10 mM NaCl, 3 mM MgCl2, and 0.1% Nonidet™ P40 Substitute in Nuclease-Free Water) were added to the tissue, and the hippocampi were homogenized by suctioning 10 times through a 21G needle. After homogenization, the tissue was lysed on ice for 15min, swirling 2–3 times during this incubation period. The reserved chilled HEB media was then returned to the lysed tissue solution, and the tissue was further triturated with 5–7 passes through a 1mL pipette. A 30μm cell strainer (MACS SmartStrainer; Miltenyi Biotech 130-110-915) was washed with 1mL of PBS, and the lysed tissue solution was filtered through the strainer to remove debris and clumps. Filtered nuclei were centrifuged at 500 rcf for 5min at 4°C. The supernatant was removed, and nuclei were washed in 1mL of Nuclei Wash and Resuspension Buffer (1X PBS with 1.0% BSA and 0.2U/μl RNase Inhibitor). Nuclei were again centrifuged at 500 rcf for 5min at 4°C and resuspended in 400μL of Nuclei Wash and Resuspension Buffer. DAPI was added to a final concentration of 0.1ug/mL, and the nuclei were filtered through a 35μm cell strainer. DAPI-positive nuclei were sorted by gating on DAPI-positive events, excluding debris and doublets, using the BD FACSAria-II at the Gladstone Institutes’ Flow Cytometry Core.
cDNA library preparation and sequencing.
cDNA libraries were prepared using the Chromium Single Cell 3′ Library and Gel Bead kit v2 (10x Genomics: 120267) according to the manufacturer’s instructions. Libraries were sequenced on an Illumina NovaSeq 6000 sequencer at the UCSF CAT Core.
Pre-processing and clustering of mouse single-nucleus RNA sequencing samples.
Demultiplexed fastq files were aligned to a custom reference genome built from mm10–1.2.0 that includes introns, using the Cellranger v2.0.1 counts function with default parameters, as described in the Cellranger documentation. UMI counts were also determined using the Cellranger counts function, and count matrices from different samples were aggregated into a single count matrix using Cellranger’s aggr function with default parameters. This function filters barcodes (potential cells) according to a UMI count threshold. Filtered UMI count matrices were further processed using Seurat v.2.3.4. Data were filtered to include only protein coding genes. Cells were filtered to include only cells with 200–2,400 genes detected, 500–4,500 UMI, and <0.25% mitochondrial reads. This quality assurance process resulted in a final matrix of 21,204 genes by 123,489 nuclei. The gene expression matrices were then log-normalized with a scale factor of 10,000, using the Seurat NormalizeData function57,58.
Clustering was determined as implemented in Seurat v2.3.4. This algorithm embeds cells in a K-nearest neighbor graph, based on Euclidean distance in PCA space. The edge weights between any two cells are further refined using Jaccard similarity. Clustering is implemented using the Louvain algorithm. Highly dispersed genes were selected using the Seurat FindVariableGenes function57,58, filtering for an average expression range of 0.25 to 4 and a minimum dispersion of 0.55, resulting in a list of 2,197 genes. Nearest neighbor distances were computed using up to the first 15 principal components and a resolution of 0.6, resulting in a set of 27 distinct clusters.
Cell-Type Assignment.
Data visualization by tSNE revealed clusters where mouse ages and genotypes were intermingled, with no discernable evidence of batch effects by genotype or age (Extended Data Fig. 2). Marker genes for each cluster were calculated using the FindAllMarkers function in Seurat57,58. This algorithm iteratively compares gene expression in each putative cluster against the expression in all other clusters, using the Wilcoxon rank sum test. Marker genes were limited to be positively expressed (more highly expressed in the cluster of interest than in other clusters), to be detected in at least 10% of cells in the cluster, and to be 0.25 log2 fold higher expressed in the cluster of interest than in other clusters.
Broad cell classes, such as excitatory and inhibitory neurons, astrocytes, oligodendrocytes, and OPCs were identified by querying marker genes against cell-type-specific markers derived from previous RNA sequencing data on sorted cell types25 (Extended Data Fig. 1). For further subdivision of hippocampal cell types, particularly for identification of subsets of principal cells, marker genes for each cluster were queried against hippocampal cell-type specific marker genes as published in hipposeq26. For rarer non-neuronal cell types, we compared gene expression in our cells to those genes enriched in each hippocampal cell type relative to all other cells in the hippocampus, according to the data in the DropViz resource27. To further validate cluster identity, we additionally queried top marker genes for each cluster against the Allen Brain’s genome-wide atlas of gene expression in the adult mouse brain28 (Extended Data Fig. 1).
Human MCI and AD Single-Nucleus RNA Sequencing Data from ROSMAP.
The gene-count-by-cell matrix and metadata were downloaded with permission from (https://www.synapse.org/#!Synapse:syn18485175). Detailed documentation on sample preparation and data preprocessing can be found in35.
Human single-Nucleus RNA Sequencing Data from the Allen Institute for Brain Science.
The medial temporal gyrus gene-counts-by-cell matrix and metadata were downloaded directly from the Allen Brain Institute’s webpage (https://celltypes.brain-map.org/rnaseq). Thorough documentation on sample preparation can be found at (http://help.brain-map.org/display/celltypes/Documentation).
Immunohistochemistry.
30μm coronal hemi-brain sections were washed 2×10min in phosphate-buffered saline (PBS) then exposed to UV light overnight to reduce autofluorescence. The next day, slices were washed 3×10min in PBS, then washed 2×15min in PBS + 0.1% Tween-20 (PBS-T). Slices were blocked in PBS + 10% Normal Donkey Serum + 0.2% Gelatin (Sigma) + 0.5% Triton-X for 1hr at room temperature (RT), then washed for 10min in PBS. Because some antibodies were raised in mouse, slices were additionally blocked in 1 drop Mouse IgG Blocking Reagent (Vector Labs, MKB-2213-1) per 5mL PBS for 1 hour at RT. Primary antibodies were diluted to optimized concentrations (anti-NeuN 1:1000, anti-MHC-I (OX18 that recognizes multiple MHC-I proteins) 1:50, anti-PSD-95 1:200) in 1:12.5 mouse-on-mouse Protein Concentrate (Vector Labs, MKB-2213-1) in PBS, and slices were incubated overnight at 4°C. The next day, slices were washed 3x (15 min, 10 min, 5 min) in PBS-T. Secondary antibodies (Lifetech, Jackson ImmunoResearch; 1:1000) were diluted in the same dilution buffer as primary antibodies and incubated 1hr at RT. Slices were then washed 3x (15 min, 10 min, 5 min) with PBS, mounted with Vectashield + DAPI, and coverslipped.
DAB Staining.
Slices were washed 3 × 10min in PBS, then permeabilized in PBST for 30min (0.25% Triton X-100+PBS). Antigen retrieval was accomplished with citrate buffer (23.75ml 0.1M Citric Acid, 103.75ml 0.1M Sodium Citrate, 125ml water; microwaved until starting to boil, then adjusted to pH 6), applied to brain sections in 1.5mL conical tubes at 95°C for 5 minutes. Slices were then washed 2x for 15min in PBST. Slices were incubated in endogenous peroxidase block (0.3% H2O2, 10% methanol, PBS) for 15min, followed by two additional 15min washes in PBS. Slices were then blocked for nonspecific binding in a solution of 10% normal donkey serum (NDS), 1% blotting grade blocker non-fat dry milk, 0.2% of 10% gelatin, in PBST for 60min. Slices were additionally blocked for avidin/biotin (Vector SP-2001) as directed, rinsed 10min in PBS, 3 × 10min in PBST, and incubated in primary antibody at 4°C overnight in a solution that includes 10% NDS and 0.2% of 10% gelatin in PBS. The next day, slices were washed 3 × 10min in PBST, and incubated in secondary antibody (1:200 in 10% NDS and 0.2% of 10% gelatin in PBS) at room temperature for 1hr. Slices were incubated in Avidin Biotin Complex (Vector, PK-6100) as directed, then incubated 500uL/well of DAB mixture (Vector SK-4100) until the desired intensity of development is achieved. Development is halted by 3 × 5min washes in 0.1M Tris buffer, followed by 2 × 10min washes in PBS. Slices were mounted and allowed to dry overnight. The next day, slices were submerged in xylene 2 × 5min then coverslipped in DPX mounting medium (Sigma-Aldrich #06522) and allowed to dry in the fume hood for an additional day.
Immunocytochemistry.
Primary neurons on coverslips were washed 10min in dPBS, then permeabilized in dPBS + 0.1% Triton-X for 5min at RT. The neurons were then blocked in 10% normal donkey serum + 0.5% Triton in PBS for 1hr, and further blocked with mouse-on-mouse (MOM) blocking buffer (Vector Labs, MKB-2213-1) at 1 drop Mouse IgG block buffer per 4ml PBS. Primary antibodies were diluted in MOM Antibody dilution buffer (80ul protein concentrate to 1ml PBS), and cells were incubated in primary antibody solution overnight at 4°C (anti-ApoE 1:5000, Millipore 178479; anti-MHC-I (OX18) 1:50, Santa Cruz Biotechnologies sc-53074; anti-MAP2 1:500, Millipore ab5622; anti-p-Tau (PHF1) 1:300, from Peter Davis). The next day, cells were washed 3x (15min, 10min, 5min) in PBS with 0.1% Triton-X. Secondary antibodies were diluted in MOM Antibody Dilution Buffer (1:1500), and incubated with the cells for 1hr at RT. Cells were again washed 3x (15min, 10min, 5min) in PBS with 0.1% Triton-X. Coverslips were then mounted to microscope slides (Vectashield, Prolong Gold).
Primary neuron culture and lentivirus treatment.
Primary neuron culture was prepared from embryonic day 18–20 or postnatal day 0 (P0) pups of various genotypes. The cortex plus hippocampus were isolated, and the dissociated cells were plated at 80,000 cells/ml in Neurobasal medium supplemented with B27, 100 U/ml penicillin G, 100 μg/ml streptomycin, and 1% Glumax. In some experiments, primary neurons were transduced with lentivirus (8×10⁵ IFU for one well of 24-well plate) at day 7 in vitro. The virus contained medium will be removed after 48 hr. 7 days after being exposed to lentivirus treatment (14 DIV), the cultures were harvested or fixed for various assays.
Surgeries.
Surgeries were performed on 3–5-month-old mice. Mice were anaesthetized with ketamine/xylazine and 1.5% isoflurane, and mice were placed in a stereotactic head apparatus. Thereafter, mice were maintained on 0.8% isoflurane for the duration of the surgery. Scalps were cleaned with Nair and sterilized with alcohol. A midline incision was made, and the skull was cleaned with hydrogen peroxide. A craniotomy was drilled bilaterally above each injection site. Adeno-associated virus-2 (AAV2) expressing pathological human Tau-P301S (AAV2-Y444F-smCBA-human_T301S_Tau-WPRE from Virovek, Lot #13–290) was diluted to 2.1 × 10¹³ VG/mL in sterile saline and injected via a 5 μL glass syringe at 0.5 μL/min. The injection volume and flow rate were controlled by an injection pump. Each dentate gyrus received 2 μL of virus (anteroposterior (AP) = 2.10, dorsoventral (DV) = 2.10, mediolateral (ML) = +/− 1.50). Following the four-minute injection, the needle was left in place for 10 minutes and then slowly withdrawn. All mice were injected bilaterally. Local anesthetic was applied prior to suturing. Opioid analgesic was administered before and 3 hours after the surgery ended, and anti-inflammatory ketofen was administered following the surgery and the next day.
Western blot.
Primary neurons in culture were washed with PBS and collected in the presence of a high-detergent buffer consisting of 50 mM Tris, 150 mM sodium chloride, 2% Nonidet P-40, 1% sodium deoxycholate and 4% sodium dodecyl sulfate, and supplemented with complete protease inhibitor cocktail (Roche), phosphatase inhibitor cocktail 3 (P0044, Sigma), and phosphatase inhibitor cocktail 2 (P5726, Sigma). The total protein in cell lysates was quantified with the BCA protein assay kit (cat. no. 23227, Pierce). The samples were separated by SDS–PAGE on 12% Bis-Tris polyacrylamide gels (Life Technologies) and transferred to nitrocellulose membranes (Bio-Rad). The membranes were then blocked in Odyssey Blocking Buffer (PBS) (LI-COR) and probed with primary antibodies to the following proteins: ApoE (178479, Calbiochem, 1:5,000), MHC-I (OX18, sc-53074, Santa Cruz Biotech, 1:200), p-Tau (PHF1, gift from Peter Davies, 1:600), t-Tau (T6402, Sigma, 1:350), B2M (ab75853, Abcam, 1:5000), and Beta-III-Tubulin (PRB435P, Covance, 1:20,000). The secondary antibodies were IgG labeled with IRDye 800 or IRDye 680 (LI-COR), including donkey anti-rabbit 680 (cat. no. 926–68023, 1:15,000); donkey anti-goat 680 (cat. no. 926–68024, 1:20,000); donkey anti-mouse IgG 800 (cat. no. 926–32212, 1:10,000); and goat anti-rabbit 800 (cat. no. 926–32211, 1:15,000). The blotted membranes were scanned with an Odyssey CLx Imaging System (LI-COR). Signals were analyzed with Image Studio Lite 4.0 (LI-COR).
Image analysis.
Images for fluorescent immunohistochemical analysis were acquired using a Zeiss LSM880 Confocal microscope using a 63x oil immersion objective. Images for fluorescent immunocytochemical analysis were collected using a Zeiss Cell Observer SD Spinning Disk Confocal microscope using a Plan Apo 63x/1.4NA oil immersion objective. Images for DAB intensity analysis were acquired using a Keyence BZ-X810 microscope with a 20x CFI Plan Apo Lambda/0.75NA objective. Image analysis was performed using custom macros written in the open source Fiji (ImageJ) software. Analysts drawing regions of interest for fluorescent intensity analysis of MHC-I, PSD-95, ApoE, and p-Tau were blind to sample, and ROIs were drawn on the basis of cell-type marker stains (NeuN for immunohistochemistry and MAP2 for immunocytochemistry) rather than the stain of interest. These ROIs were then transferred to the channels of interest to quantify intensity. Analyses of hippocampal volume and of NeuN/DAPI+ cellular density were conducted manually14, but blind to sample, again to exclude the possibility of bias.
Computational and Statistical Methods
Sample size, randomization, and blinding.
For mouse studies, literature search was used to determine a standard in the field of n >= 3 mice per condition. 4 mice per condition were used to ensure an n of >= 3 mice per condition. In all cases, all sample preparation was successful and 4 mice were used. For human single-nucleus RNA sequencing analysis, sample sizes were determined by the sample sizes of the publicly available datasets. For immunocytochemical analyses, at least 20 fields of view containing at least 1 neuron were captured for each genotype and/or treatment category, and the resulting N depended on the number of cells captured in those 20 fields of view. There were no animals or data points excluded from analyses.
Most mouse and primary neuron comparisons were based on age or genotype, so age and genotype determined the experimental groups. Within each group, mice were randomly selected from available pools of mice. Human samples were allocated into groups based on their provided metadata. Wells of primary neurons were allocated to treatment with B2M-shRNA versus control shRNA based on matched plate locations and matched cellular density across wells.
For mouse immunohistochemical, primary neuron immunocytochemical, and Western bolt analyses, investigators were blinded to sample identity, and analyses were conducted via automated macro to the extent this was possible. Investigators were not blinded during analysis of the single-nucleus RNA sequencing datasets, as sample metadata was needed to conduct any comparisons.
Quantification and statistical analyses.
Where applicable, all statistical details of the experiments including tests used, value of n, definition of center, and dispersion measures can be found in the corresponding figure legend. Additional description of statistical methods used is detailed on a per-experiment basis below. Principal components analysis (PCA) was used to examine the mutually-orthogonal dimensions of each cell-type cluster that explain the highest proportion of variance in gene expression across cells of a given type. Pearson’s correlation coefficient was used to quantify the correlation between those cells’ imputed apoE expression levels and each of the first two PCs. Pearson’s correlation coefficient was also used to examine the cell-by-cell correlation in imputed apoE gene expression and their KEGG pathway scores (described below), both in apoE-KI mouse (Fig. 2) and human (Fig. 3) brains. Chi-square tests were used to determine whether the proportion of apoE-expression-high cells differed from the expected in each mouse genotype and at each age (5, 10, 15, and 20 months). Two-way ANOVA with Tukey’s Honestly Significant Difference (Tukey’s HSD) post-hoc tests were used to examine the immunohistochemical differences observed between apoE3-KI, apoE4-KI, apoE3-KI/Syn-Cre, and apoE4-KI/Syn-Cre mice. Direct comparisons between apoE-KI and apoE-KI/Syn-Cre gene expression were determined with a non-parametric Benjamini-Hochberg corrected Wilcoxon rank-sum test. Western blot comparisons involving only two groups were analyzed using two-sample t-tests. Correlations between apoE expression level and MHC-I expression in immunohistochemical analysis were quantified with Pearson’s correlation coefficient. Comparisons between NSE-E4+/+ and NSE-E4+/− APOE intensity and MHC-I intensity, as measured by immunohistochemistry were conducted with non-parametric Mann-Whitney tests, as were comparisons between B2M-shRNA and control-shRNA treated primary neurons. Immunohistochemical analyses with three groups were conducted using the non-parametric Kruskal-Wallis test with Dunn’s multiple comparisons correction.
MAGIC imputation for gene-gene interaction.
The raw counts data were filtered to include only genes with >100 reads across all nuclei, library size and square-root normalized as described in29. Data were then imputed with the magic function from the Rmagic package29, allowing the function itself to set the optimal parameters. Briefly, this algorithm recovers an imputed count matrix representing the likely gene expression for each individual cell based on data diffusion across similar cells. It proceeds by determining the Euclidean distance between cells in PCA space. This distance is then converted to affinities using an adaptive Gaussian kernel, which functions to equalize the effective number of neighbors for each cell. Convolution with the adaptive Gaussian kernel causes similarity estimates between cells to decrease exponentially with distance. From this affinity matrix, the algorithm computes a Markov transition matrix (M), which represents the probability of transitioning from one cell to another in a single time step (t). Raising M to the power t results in a matrix where each entry represents the probability that a random walk of length t starting at cell i will reach cell j. This step has the effect of increasing the weights (reflecting similarities) amongst cells that share many neighbors, and weakening weights amongst (likely spurious) connections of cells that share few neighbors. Finally, this transition matrix is multiplied by the original data matrix, sharing data within the local neighborhood of cells and reducing the impact of technical dropout noise in the data.
KEGG pathway scores.
Pathway scores for individual nuclei were calculated within each cell type by subsetting the gene × nuclei matrix to the nuclei within each defined cell type cluster and the genes within each Kyoto Encyclopedia of Genes and Genomes (KEGG) pathway. For each pathway, each gene’s expression across nuclei within a cell type was normalized to the maximum expression of that gene in that cell type. In this way, each gene’s normalized expression score would lie between 0 and 1, and the pathway score would not be dominated by the value of one or a few high-expressing genes. The normalized gene expression values for each gene were then averaged across all genes in the pathway to give a pathway expression score representing the normalized relative expression of genes in that pathway for each nucleus.
Assigning classifications to individual pathways.
Within the KEGG hierarchy of pathways are 328 total pathways divided into seven major subsets, each with their own sub-classification of pathways. These include 1. Metabolism, 2. Genetic Information Processing, 3. Environmental Information Processing, 4. Cellular Processes, 5. Organismal Systems, 6. Human Diseases, and 7. Drug Development. Pathways were broadly assigned to categories based on their classification in this hierarchy. Any pathway categorized as 5.1 Immune system, 6.3 Immune disease, 6.8 Infectious disease: bacterial, 6.9 Infectious disease: viral, or 6.10 Infectious disease: parasitic was considered an “immune related” pathway.
ApoE-pathway correlation heatmaps.
For every cell type, we correlated the imputed apoE expression value for each individual cell with the pathway scores for every KEGG pathway for each individual cell. This gives a list of correlation values for each cell type for each pathway. For each neuronal cell type, we selected the top 10 most-correlated pathways. Any duplicated pathways were removed. This leaves a cell type × pathway matrix representing only those pathways most correlated with apoE expression in each cell type. These were then hierarchically clustered and displayed using the heatmap.2 function in the gplots package of R.
Gene expression network analysis.
Proportion of shared genes in KEGG pathways was calculated using custom software in R, with KEGG annotations from the limma package59. Network visualizations were conducted in Cytoscape60.
Batch correction with CCA.
To directly compare the apoE-KI and apoE-KI/Syn-Cre datasets, it was necessary to combine the data objects using a batch correction method. We opted to use the canonical correlation analysis (CCA) method built in to the Seurat v2.4 package to combine data from the aged Syn-Cre animals (15 months) with the 15-month-old apoE-KI animals. Briefly, CCA identifies a new set of basis vectors for the two datasets. Similar to PCA, CCA uses a linear combination of genes to define this new basis and embed cells in a lower-dimensional space. The distinction is that CCA chooses basis vectors that are maximally correlated between the two datasets, identifying a common correlational structure. CCA has the additional benefit of being robust to linear transformations of the data (for example, if different normalization methods were employed). To further align the new bases, the Seurat algorithm utilizes a non-linear dynamic time-warping method to correct for local changes in embedded cell density by stretching or compressing the basis vectors. This nonlinear time-warping is iteratively applied to each pair of basis vectors to create a single low-dimensional embedding for both datasets. Further explanation has been previously described57. In implementing this algorithm, we aligned based on the top 1000 most dispersed genes in each dataset. We filtered out cells where the variance explained by CCA was <2-fold compared to PCA, then aligned on the first 20 CCs.
MHC-I AD pathology correlations.
For each subject in the ROSMAP single nucleus RNA sequencing dataset (n = 48), the mean expression value for MHC-I of HLA-A, HLA-B, HLA-C, and HLA-E, as well as for B2M was calculated across layer 5/6 cells, as determined by referencing each cell type’s marker genes against a reference of markers for each cortical layer61. Linear regression, controlling for subject age, sex, apoE4 carrier, apoE level, and AD/MCI status (coded as cogdx), was used to determine the predictive value of these genes for a measure of tau tangles and for β-amyloid pathology.
Percent apoE-expression-high cells.
For each cell type, apoE-expression-high cells were those where the imputed apoE expression value was >= 2 standard deviations above the median apoE expression value for that cell type, across all genotypes and ages. The population was then divided based on age and genotype to determine what proportion of each cell type, at each age, in each genotype was considered “apoE-expression-high”. Significance was determined using chi-square test comparing the actual proportions of apoE-expression-high cells by age and genotype against the expected if age and genotype each had no effect on the proportion of apoE-expression-high cells.
Group-wise statistics on immunohistochemical analysis.
Statistics comparing two populations were conducted as t-tests where parametric assumptions were met and Mann-Whitney tests otherwise. Tests comparing 3 populations (for example APOE-KO vs B2M-KO vs wildtype neurons) were conducted as a Kruskal-Wallis test with Dunn’s multiple comparisons correction, as parametric assumptions were not met in these cases. Tests comparing apoE-KI to apoE-KI/Syn-Cre and apoE3-KI to apoE4-KI animals were conducted as a two-way ANOVA (y ~ apoe genotype * Syn-Cre) with Tukey’s Honest Significant Difference family-wise error corrected post-hoc tests.
Group-wise statistics on western blot analysis.
Western blot analyses comparing normalized APOE and MHC-I intensity between APOE-KO vs WT primary neurons, as well as between NSE-E4+/+ and NSE-E4+/− primary neurons were conducted using two-sample t-tests.
Life Sciences Reporting Summary.
Additional information on study design and reagents can be found in the Life Sciences Reporting Summary.
Extended Data
Extended Data Fig. 1. Cell cluster identification and quality control measures in snRNA-seq analysis of apoE-KI mice.
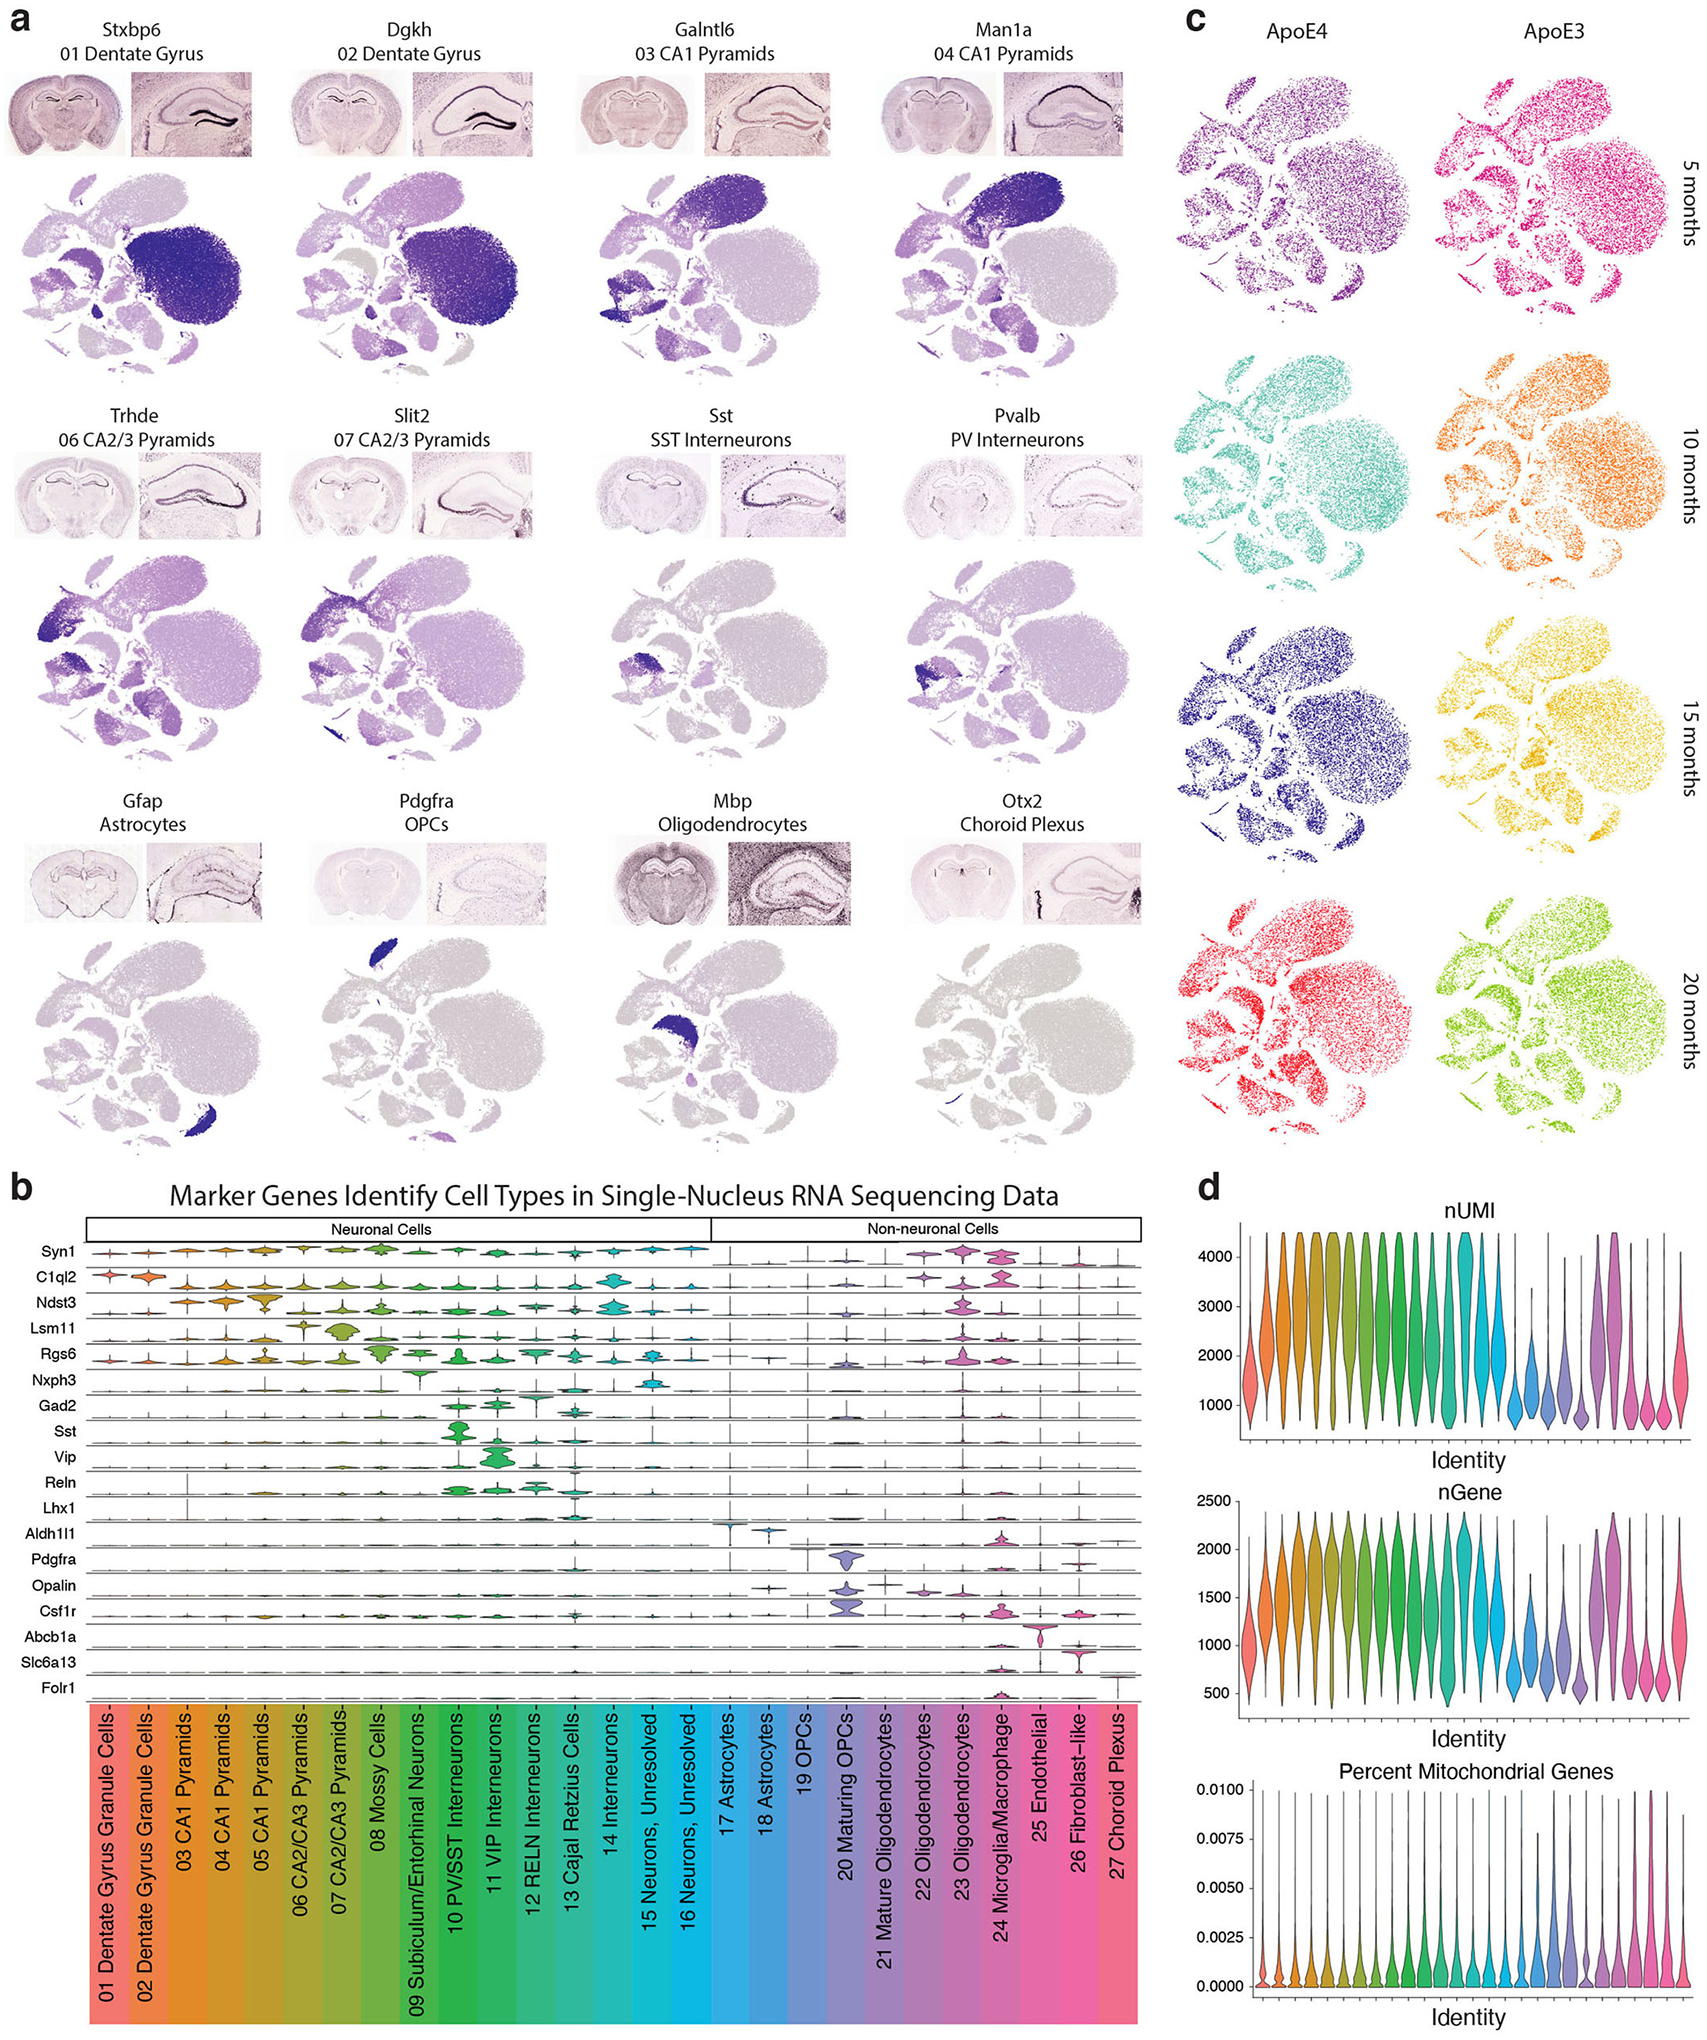
a, Feature plots of imputed expression of marker genes for major cell type clusters, as well as matched whole-brain and hippocampal expression of that marker gene in the Allen Institute for Brain Science Mouse ISH Atlas28. b, Violin plot depicting marker genes for larger cell classes (such as Syn1 for neurons) as well as marker genes for individual clusters, such as C1ql2 for dentate gyrus granule cells, Pdgfra for OPCs, and Folr1 for choroid plexus. c, tSNE plots of all the nuclei broken out by apoE genotype (columns) and mouse age (rows) showing a lack of batch effect by sample and representation of all major cell types in both genotypes at all ages. d, Quality control measures: number of UMIs, number of genes, and percent mitochondrial reads from each cluster.
Extended Data Fig. 2. ApoE correlation with the first two PCs is not driven by age, genotype, cell type markers, or quality control markers.
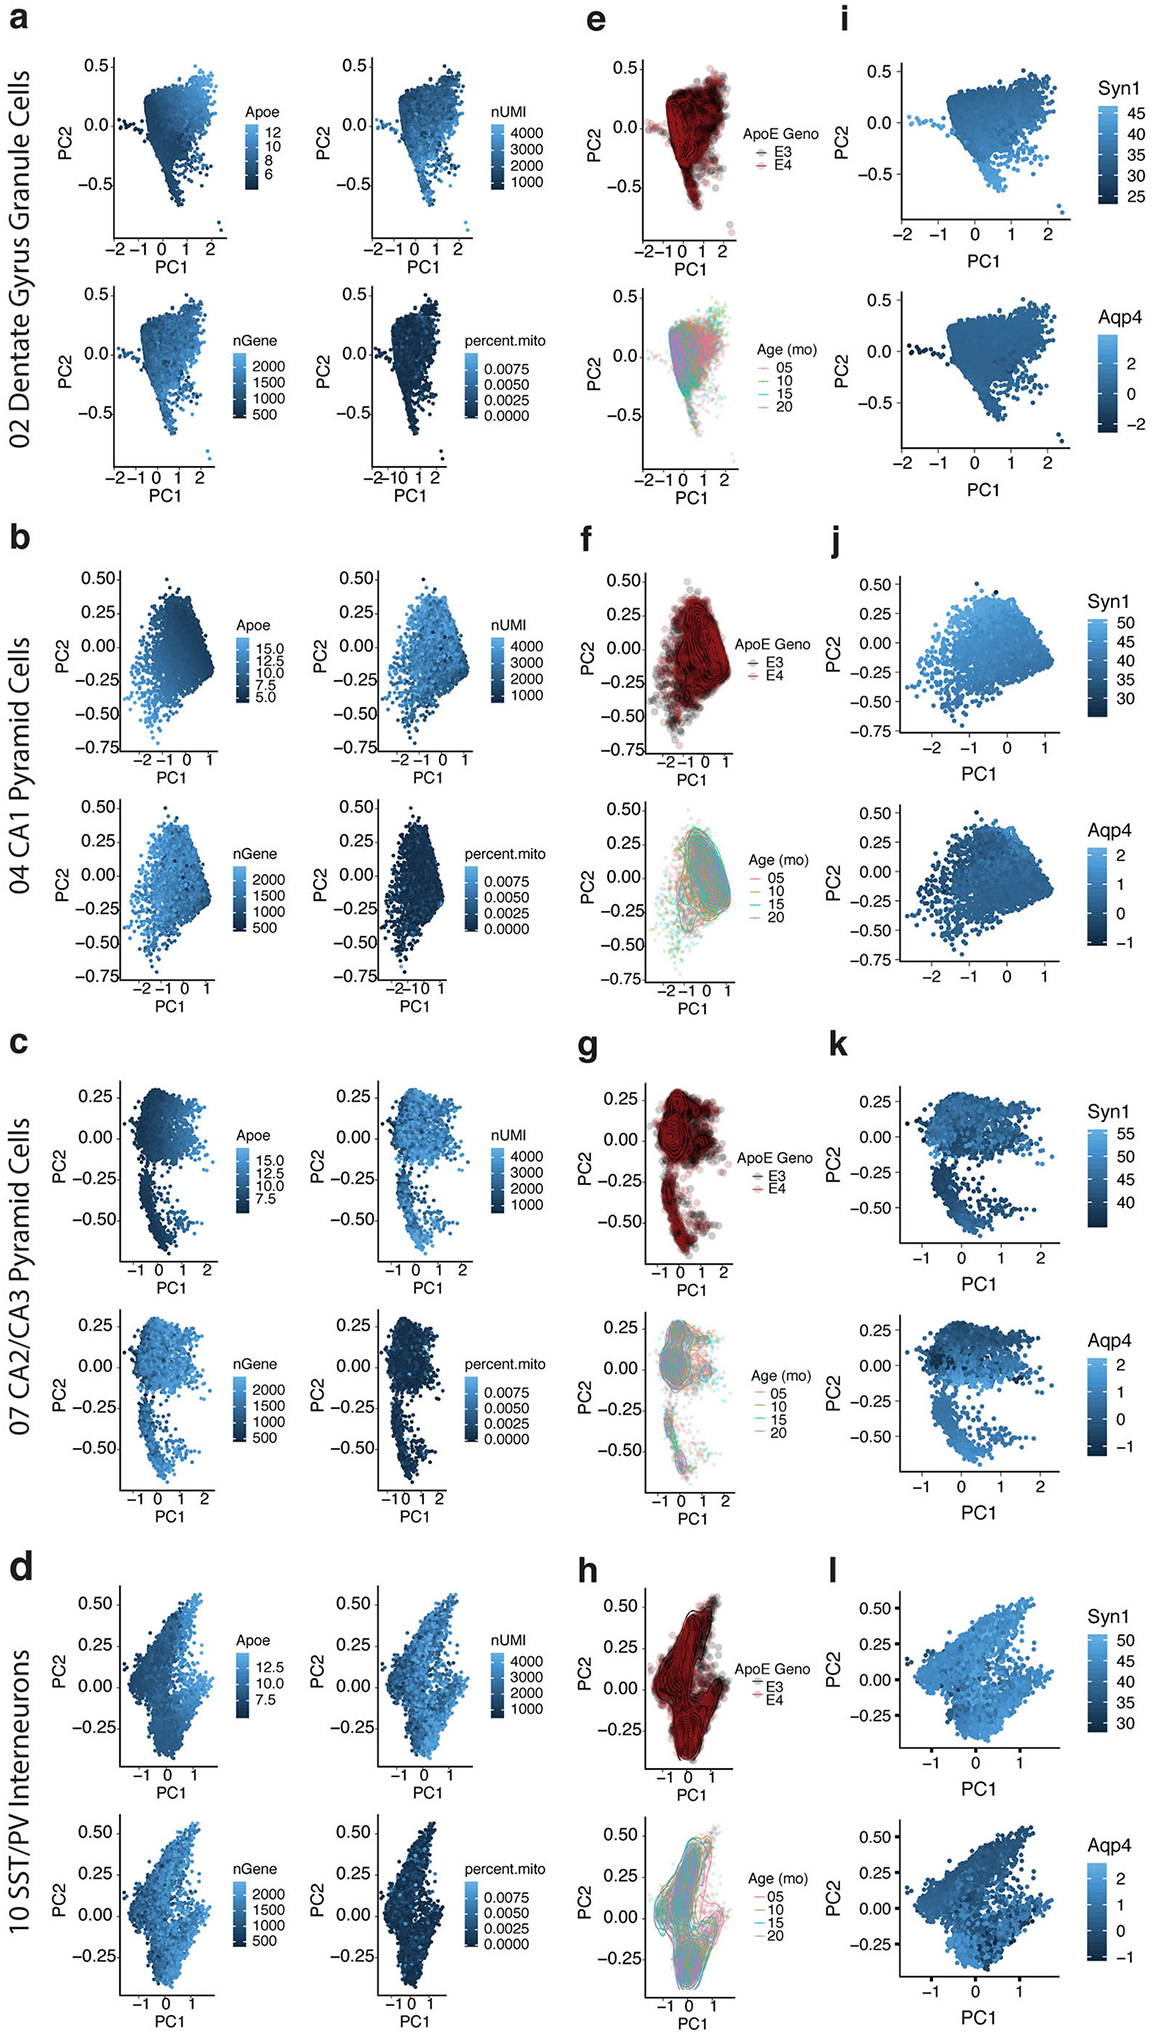
a–d, PCA plots demonstrating that the correlation between apoE gene expression and the first 2 principal components (PC1 and PC2) across neuronal cell types is not driven by measures of quality control or read depth, such as number of UMIs, number of genes, or percent mitochondrial reads. e–h, Neither is the apoE expression gradient driven by apoE genotype or mouse age. i–l, Additionally, this apoE expression gradient is not explained by differences in cell type marker expression, such as Syn1 for neurons or Aqp4 for astrocytes (i–l), indicating that the apoE-expression-high cells are not misclassified neuron/astrocyte doublets.
Extended Data Fig. 3. ApoE and pathway correlations are highly similar across apoE genotype and age.
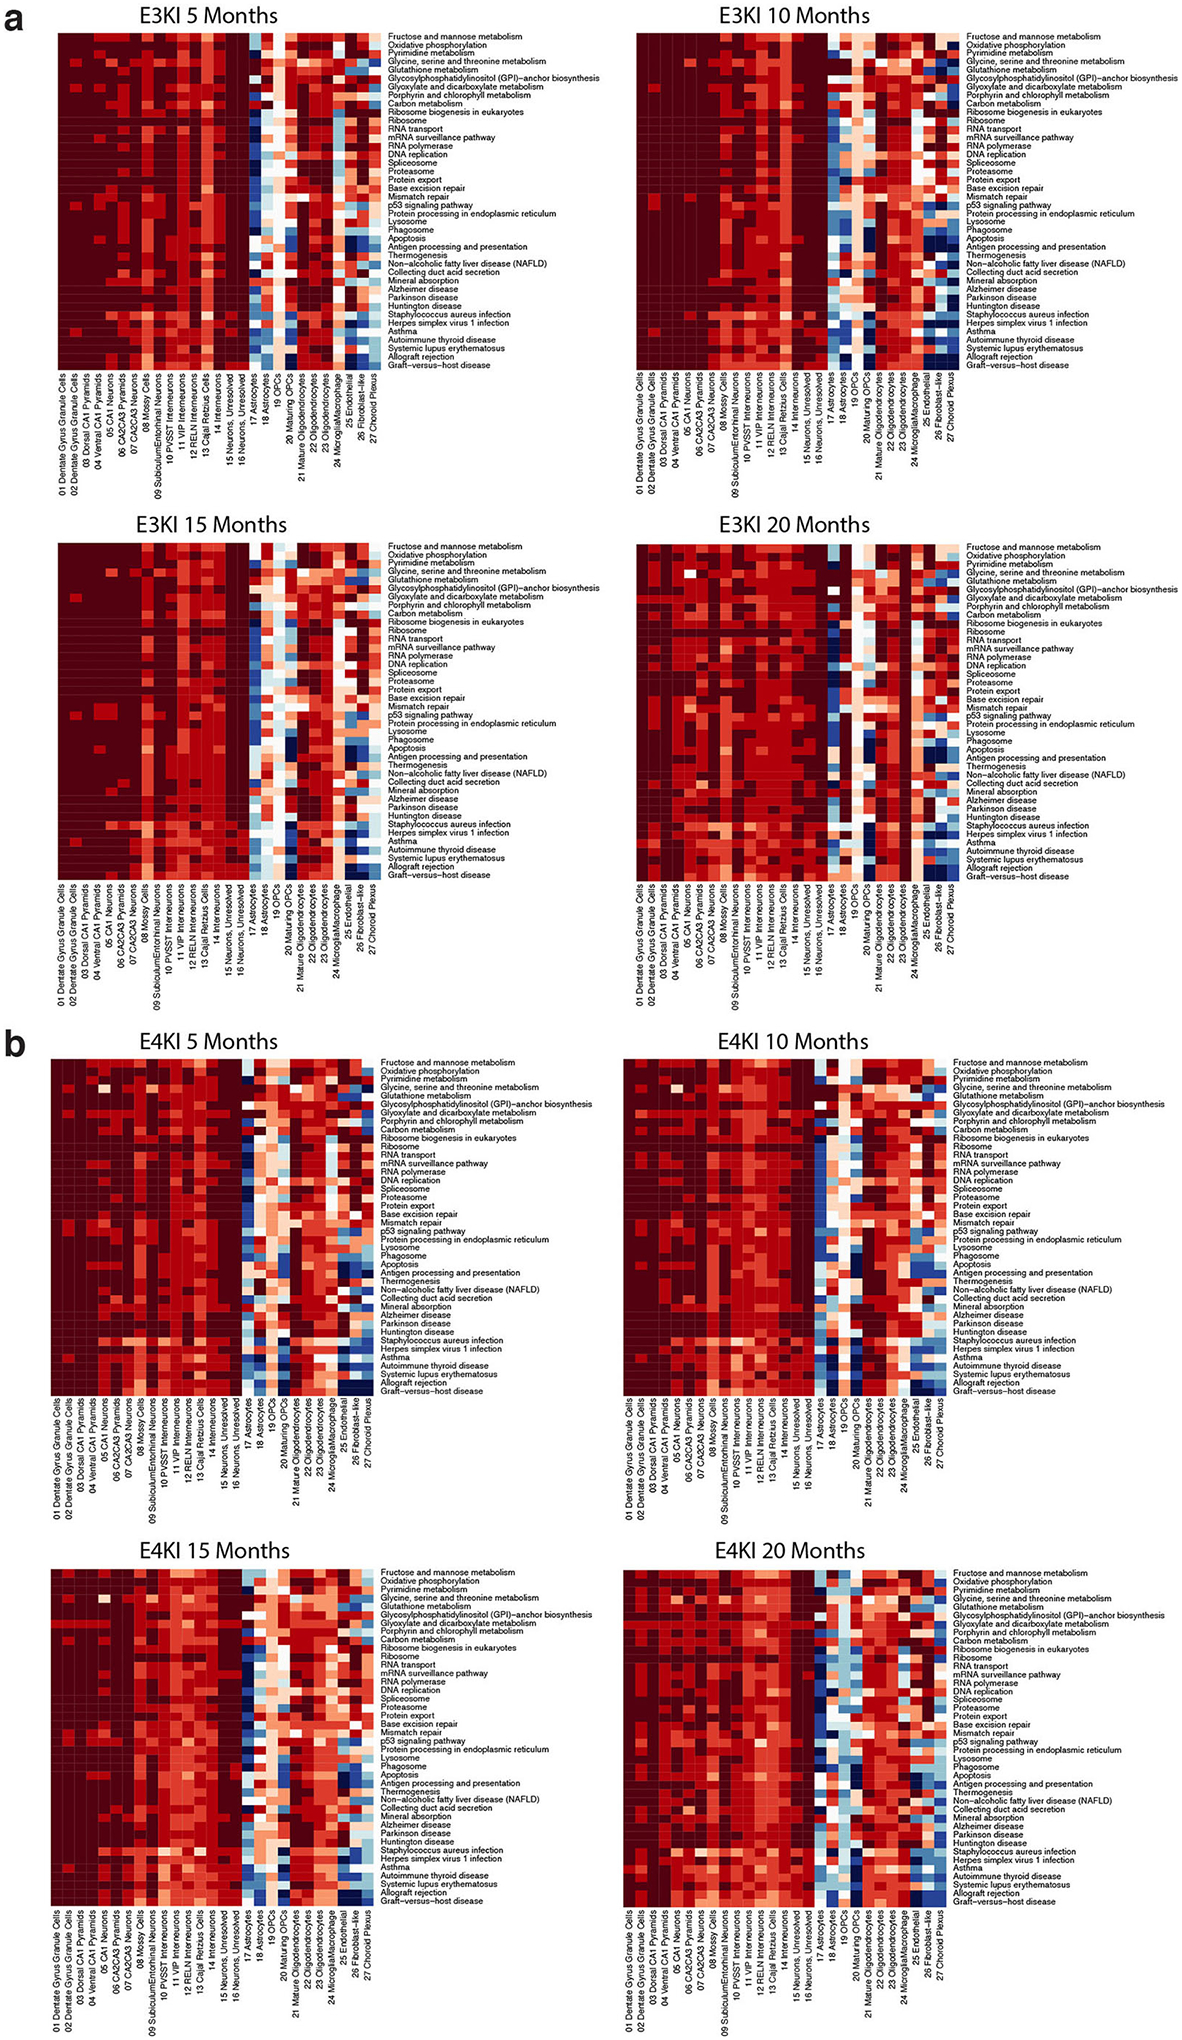
a,b, Heatmaps showing apoE and pathway correlation across cell types for the top 10 apoE-correlated pathways for each neuronal subtype, broken out by apoE genotype and mouse age, demonstrating a strong conservation of apoE and pathway relationships across apoE genotypes and ages.
Extended Data Fig. 4. Principal components analysis (PCA) of snRNA-seq data reveals the most prominent sources of cell-by-cell variation within each neuronal type in wildtype (WT) mouse cortex and the top correlates of neuronal apoE expression are enriched for cellular stress and immune response pathways in WT mouse cortical neurons.
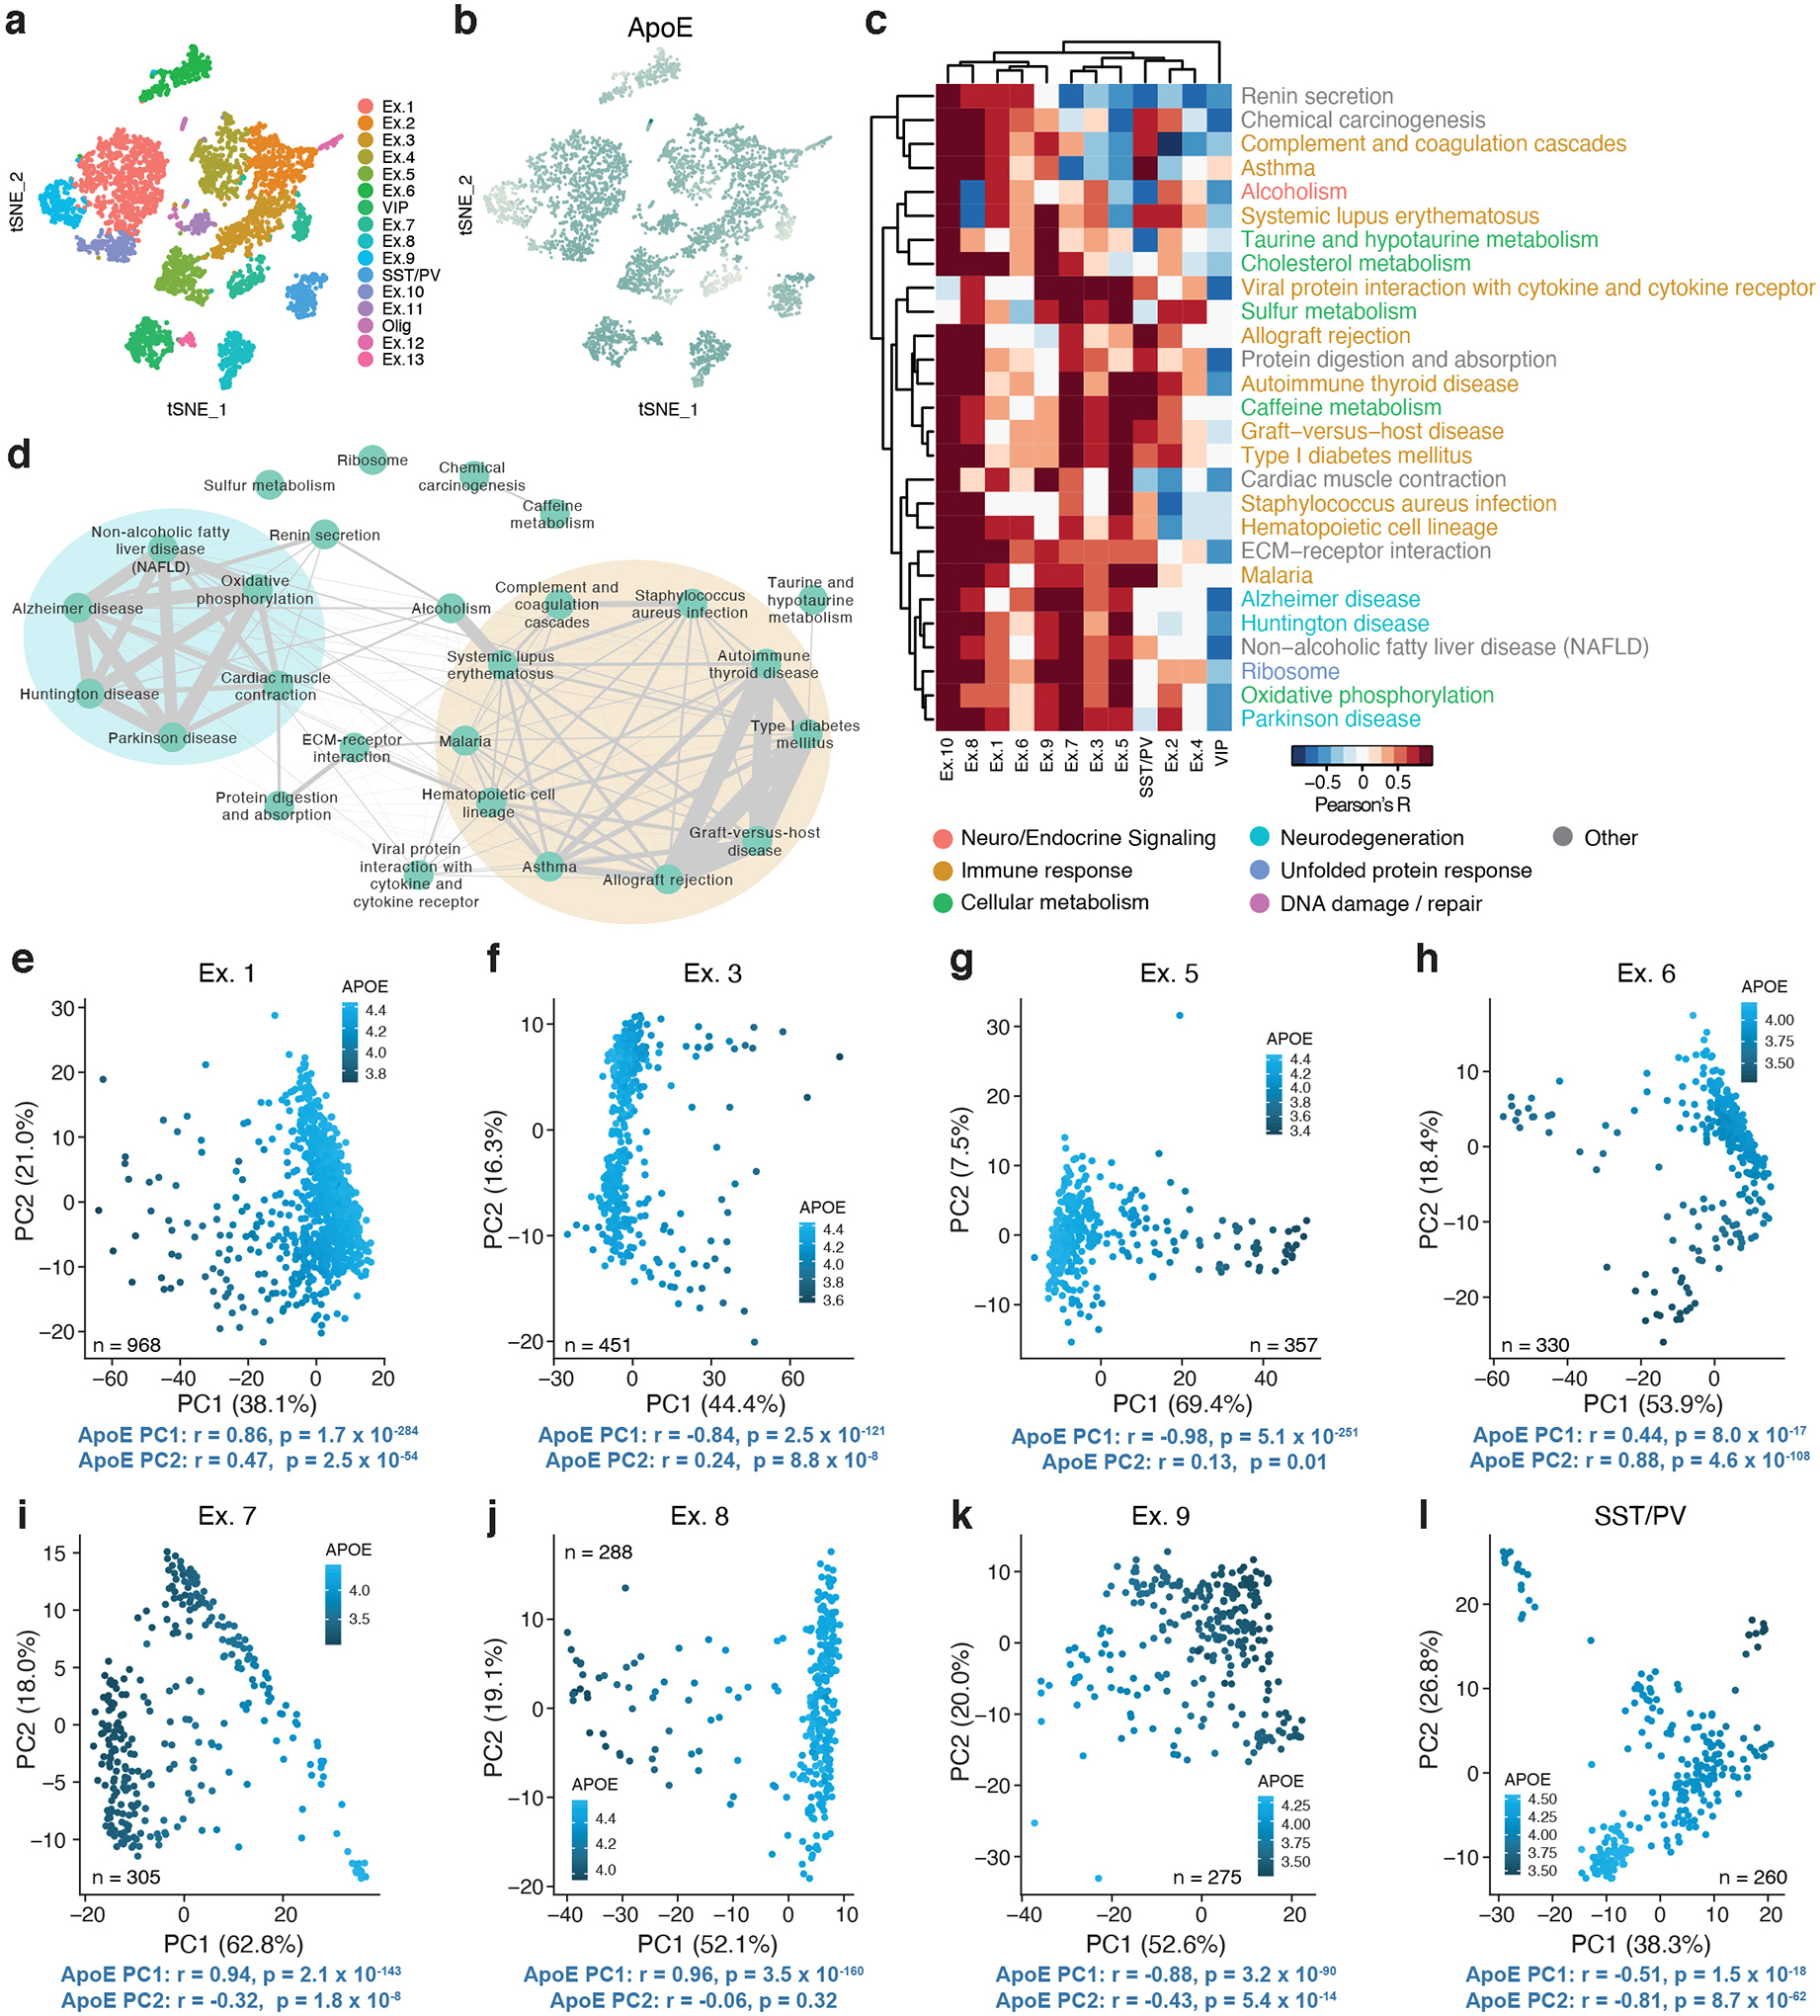
a, Clustering using the Seurat package revealed 16 distinct cellular populations in WT mouse cortex where neurons were purposefully enriched34. Marker gene analysis led to the identification of 15 neuronal clusters and one cluster of oligodendrocytes. b, ApoE expression across cell types, demonstrating expression of apoE across neuronal types. c, Heatmap illustrating the correlation between apoE expression and KEGG pathway expression scores for the top 10 apoE expression-correlated pathways from each subset of neurons. d, Network visualization of the proportion of shared genes amongst the pathways represented in c. There are two main modules of inter-related pathways. The blue module is related to neurodegenerative disease and includes the Alzheimer disease, Huntington disease, and Parkinson disease pathways. The orange module, consisting of ten apoE-correlated pathways, relates to immune response. e, In Cluster Ex. 1 cells, apoE expression is strongly correlated with PC1 (Pearson’s correlation coefficient; r = 0.86, p = 1.7 × 10−284) and PC2 (Pearson’s correlation coefficient; r = 0.47, p = 2.5 × 10−54). f, In Cluster Ex.3 cells, apoE expression is strongly correlated with PC1 (Pearson’s correlation coefficient; r = −0.84, p = 2.5 × 10−121) and PC2 (Pearson’s correlation coefficient; r = 0.24, p = 8.8 × 10⁻⁸). g, In Cluster Ex.5 cells, apoE expression is strongly correlated with PC1 (Pearson’s correlation coefficient; r = −0.98, p = 5.1 × 10−251) and PC2 (Pearson’s correlation coefficient; r = 0.13, p = 0.01). h, In Cluster Ex. 6 cells, apoE expression is strongly correlated with PC1 (Pearson’s correlation coefficient; r = 0.44, p = 8.0 × 10⁻¹⁷) and PC2 (Pearson’s correlation coefficient; r = 0.88, p = 4.6 × 10−108). i, In Cluster Ex. 7 cells, apoE expression is strongly correlated with PC1 (Pearson’s correlation coefficient; r = 0.94, p = 2.1 × 10−143) and PC2 (Pearson’s correlation coefficient; r = −0.32, p = 1.8 × 10⁻⁸). j, In Cluster Ex. 8 cells, apoE expression is strongly correlated with PC1 (Pearson’s correlation coefficient; r = 0.96, p = 3.5 × 10−160). k, In Cluster Ex. 9 cells, apoE expression is strongly correlated with PC1 (Pearson’s correlation coefficient; r = −0.88, p = 3.2 × 10−90) and PC2 (Pearson’s correlation coefficient; r = −0.43, p = 5.4 × 10⁻¹⁴). l, In SST Interneurons, apoE expression is strongly correlated with PC1 (Pearson’s correlation coefficient; r = −0.51, p = 1.5 × 10⁻¹⁸) and PC2 (Pearson’s correlation coefficient; r = −0.81, p = 8.7 × 10−62).
Extended Data Fig. 5. Principal components analysis (PCA) reveals the most prominent sources of cell-by-cell variation across neuronal types in the ROSMAP dataset.
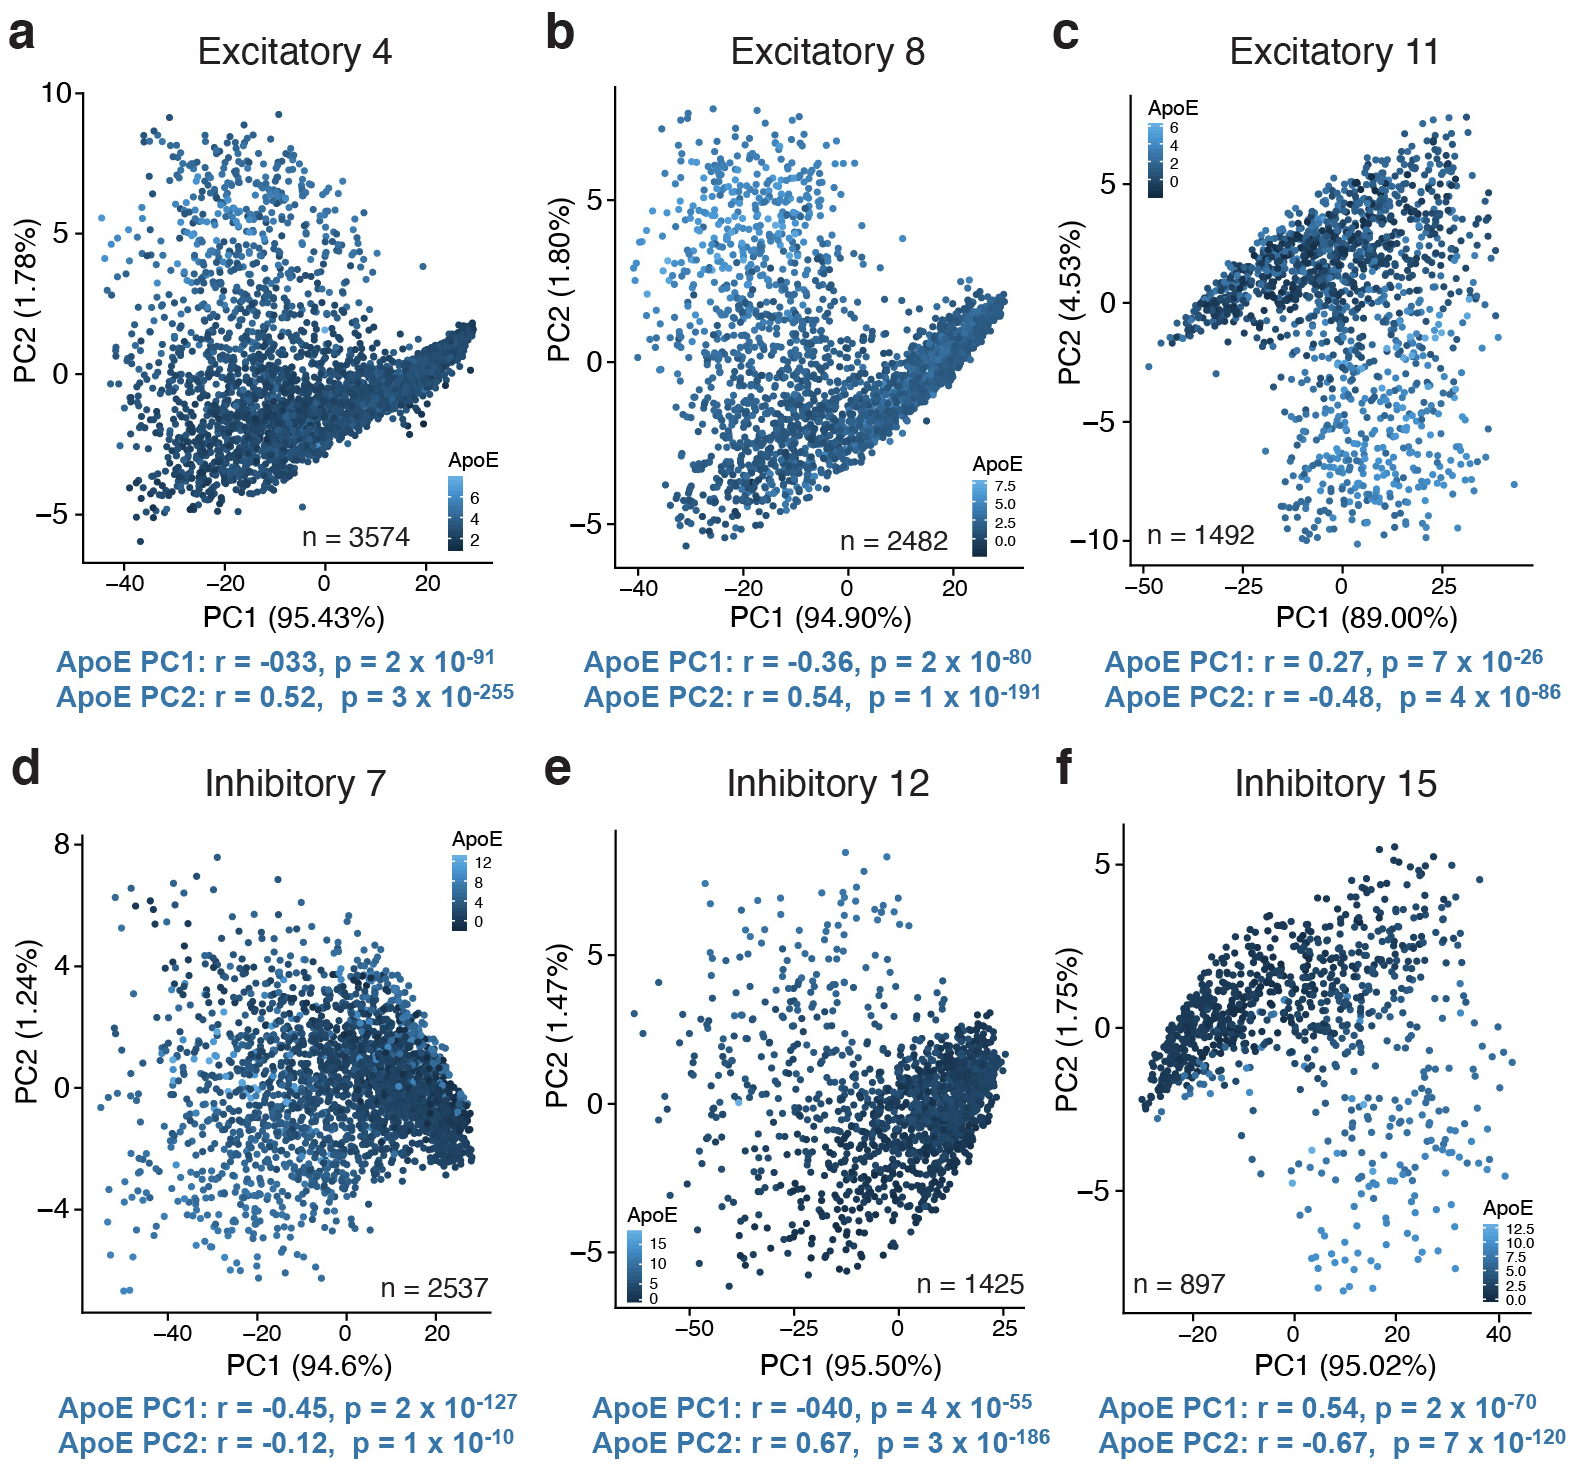
Across multiple human neuronal cell types, apoE expression levels correlate with the first two PCs. a, In Cluster 4 Excitatory neurons (n = 3574), apoE expression is correlated with PC1 (Pearson’s correlation coefficient; r = 0.33, p = 2 × 10−91) and PC2 (Pearson’s correlation coefficient; r = 0.52, p = 3 × 10−255). b, In Cluster 8 Excitatory neurons (n = 2482), apoE expression is correlated with PC1 (Pearson’s correlation coefficient; r = −0.36, p = 2 × 10−80) and PC2 (Pearson’s correlation coefficient; r = 0.54, p = 1 × 10−191). c, In Cluster 11 Excitatory neurons (n = 1492), apoE expression is correlated with PC1 (Pearson’s correlation coefficient; r = 0.27, p = 7 × 10⁻²⁶) and PC2 (Pearson’s correlation coefficient; r = −0.48, p = 4 × 10−86). d, In Cluster 7 Inhibitory neurons (n = 2537), apoE expression is correlated with PC1 (Pearson’s correlation coefficient; r = −0.45, p = 2 × 10−127) and PC2 (Pearson’s correlation coefficient; r = −0.12, p = 1 × 10⁻¹⁰). e, In Cluster 12 Inhibitory neurons (n = 1425), apoE expression is correlated with PC1 (Pearson’s correlation coefficient; r = −0.40, p = 4 × 10−55) and PC2 (Pearson’s correlation coefficient; r = 0.67, p = 3 × 10−186). f, In Cluster 15 Inhibitory neurons (n = 897), apoE expression is correlated with PC1 (Pearson’s correlation coefficient; r = 0.54, p = 2 × 10−70) and PC2 (Pearson’s correlation coefficient; r = −0.67, p = 7 × 10−120).
Extended Data Fig. 6. Relationships of neuronal apoE and cellular stress and immune response pathways are replicated in additional human brain snRNA-seq datasets.
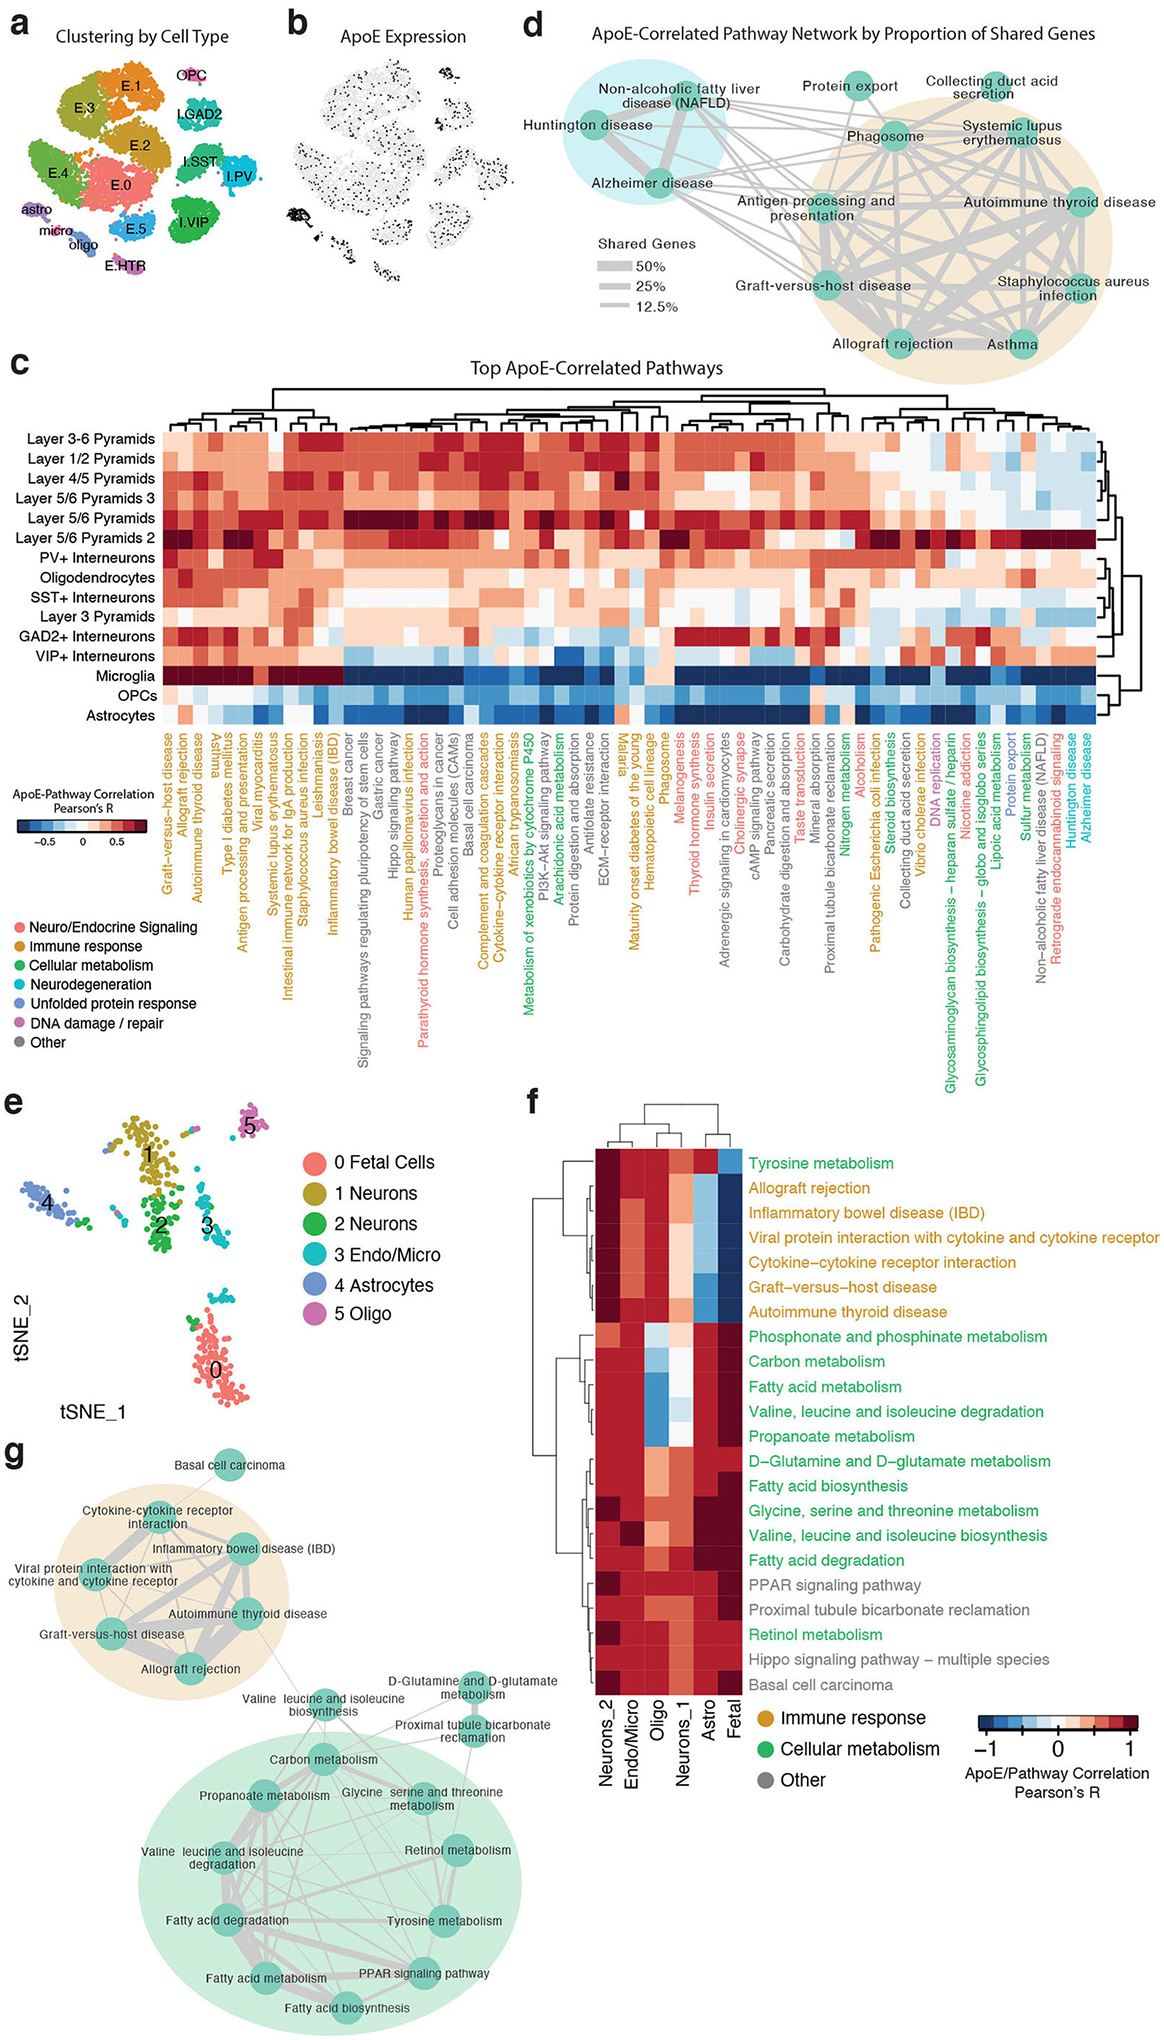
a, Clustering of a human brain dataset by cell type (https://portal.brain-map.org/atlases-and-data/rnaseq). b, ApoE expression across cell types, demonstrating expression of apoE across neuronal types. c, Heatmap illustrating the correlation between apoE expression and KEGG pathway expression scores for the top 10 apoE expression-correlated pathways from each subset of neurons. d, Network plot illustrating the proportion of shared genes amongst apoE expression-correlated pathways shared between human and mouse. Edge width represents proportion of shared genes. There are two main modules of inter-related pathways. One (blue) module is related to neurodegenerative disease and includes the Alzheimer disease and Huntington disease. The other (orange) module, consisting of eight apoE-correlated pathways, is related to immune response. e, Clustering of another human dataset by cell type36. f, Heatmap illustrating the correlation between apoE expression and KEGG pathway expression scores for the top 10 apoE expression-correlated pathways from each subset of neurons. g, Network plot illustrating the proportion of shared genes amongst apoE expression-correlated pathways. Edge width represents proportion of shared genes. There are two main modules of inter-related pathways. The larger (green) module is related to cellular metabolism. The other (orange) module, consisting of six apoE-correlated pathways, is related to immune response.
Extended Data Fig. 7. Cell cluster identification and apoE expression in the combined set of apoE-KI and apoE-KI/Syn-Cre data.
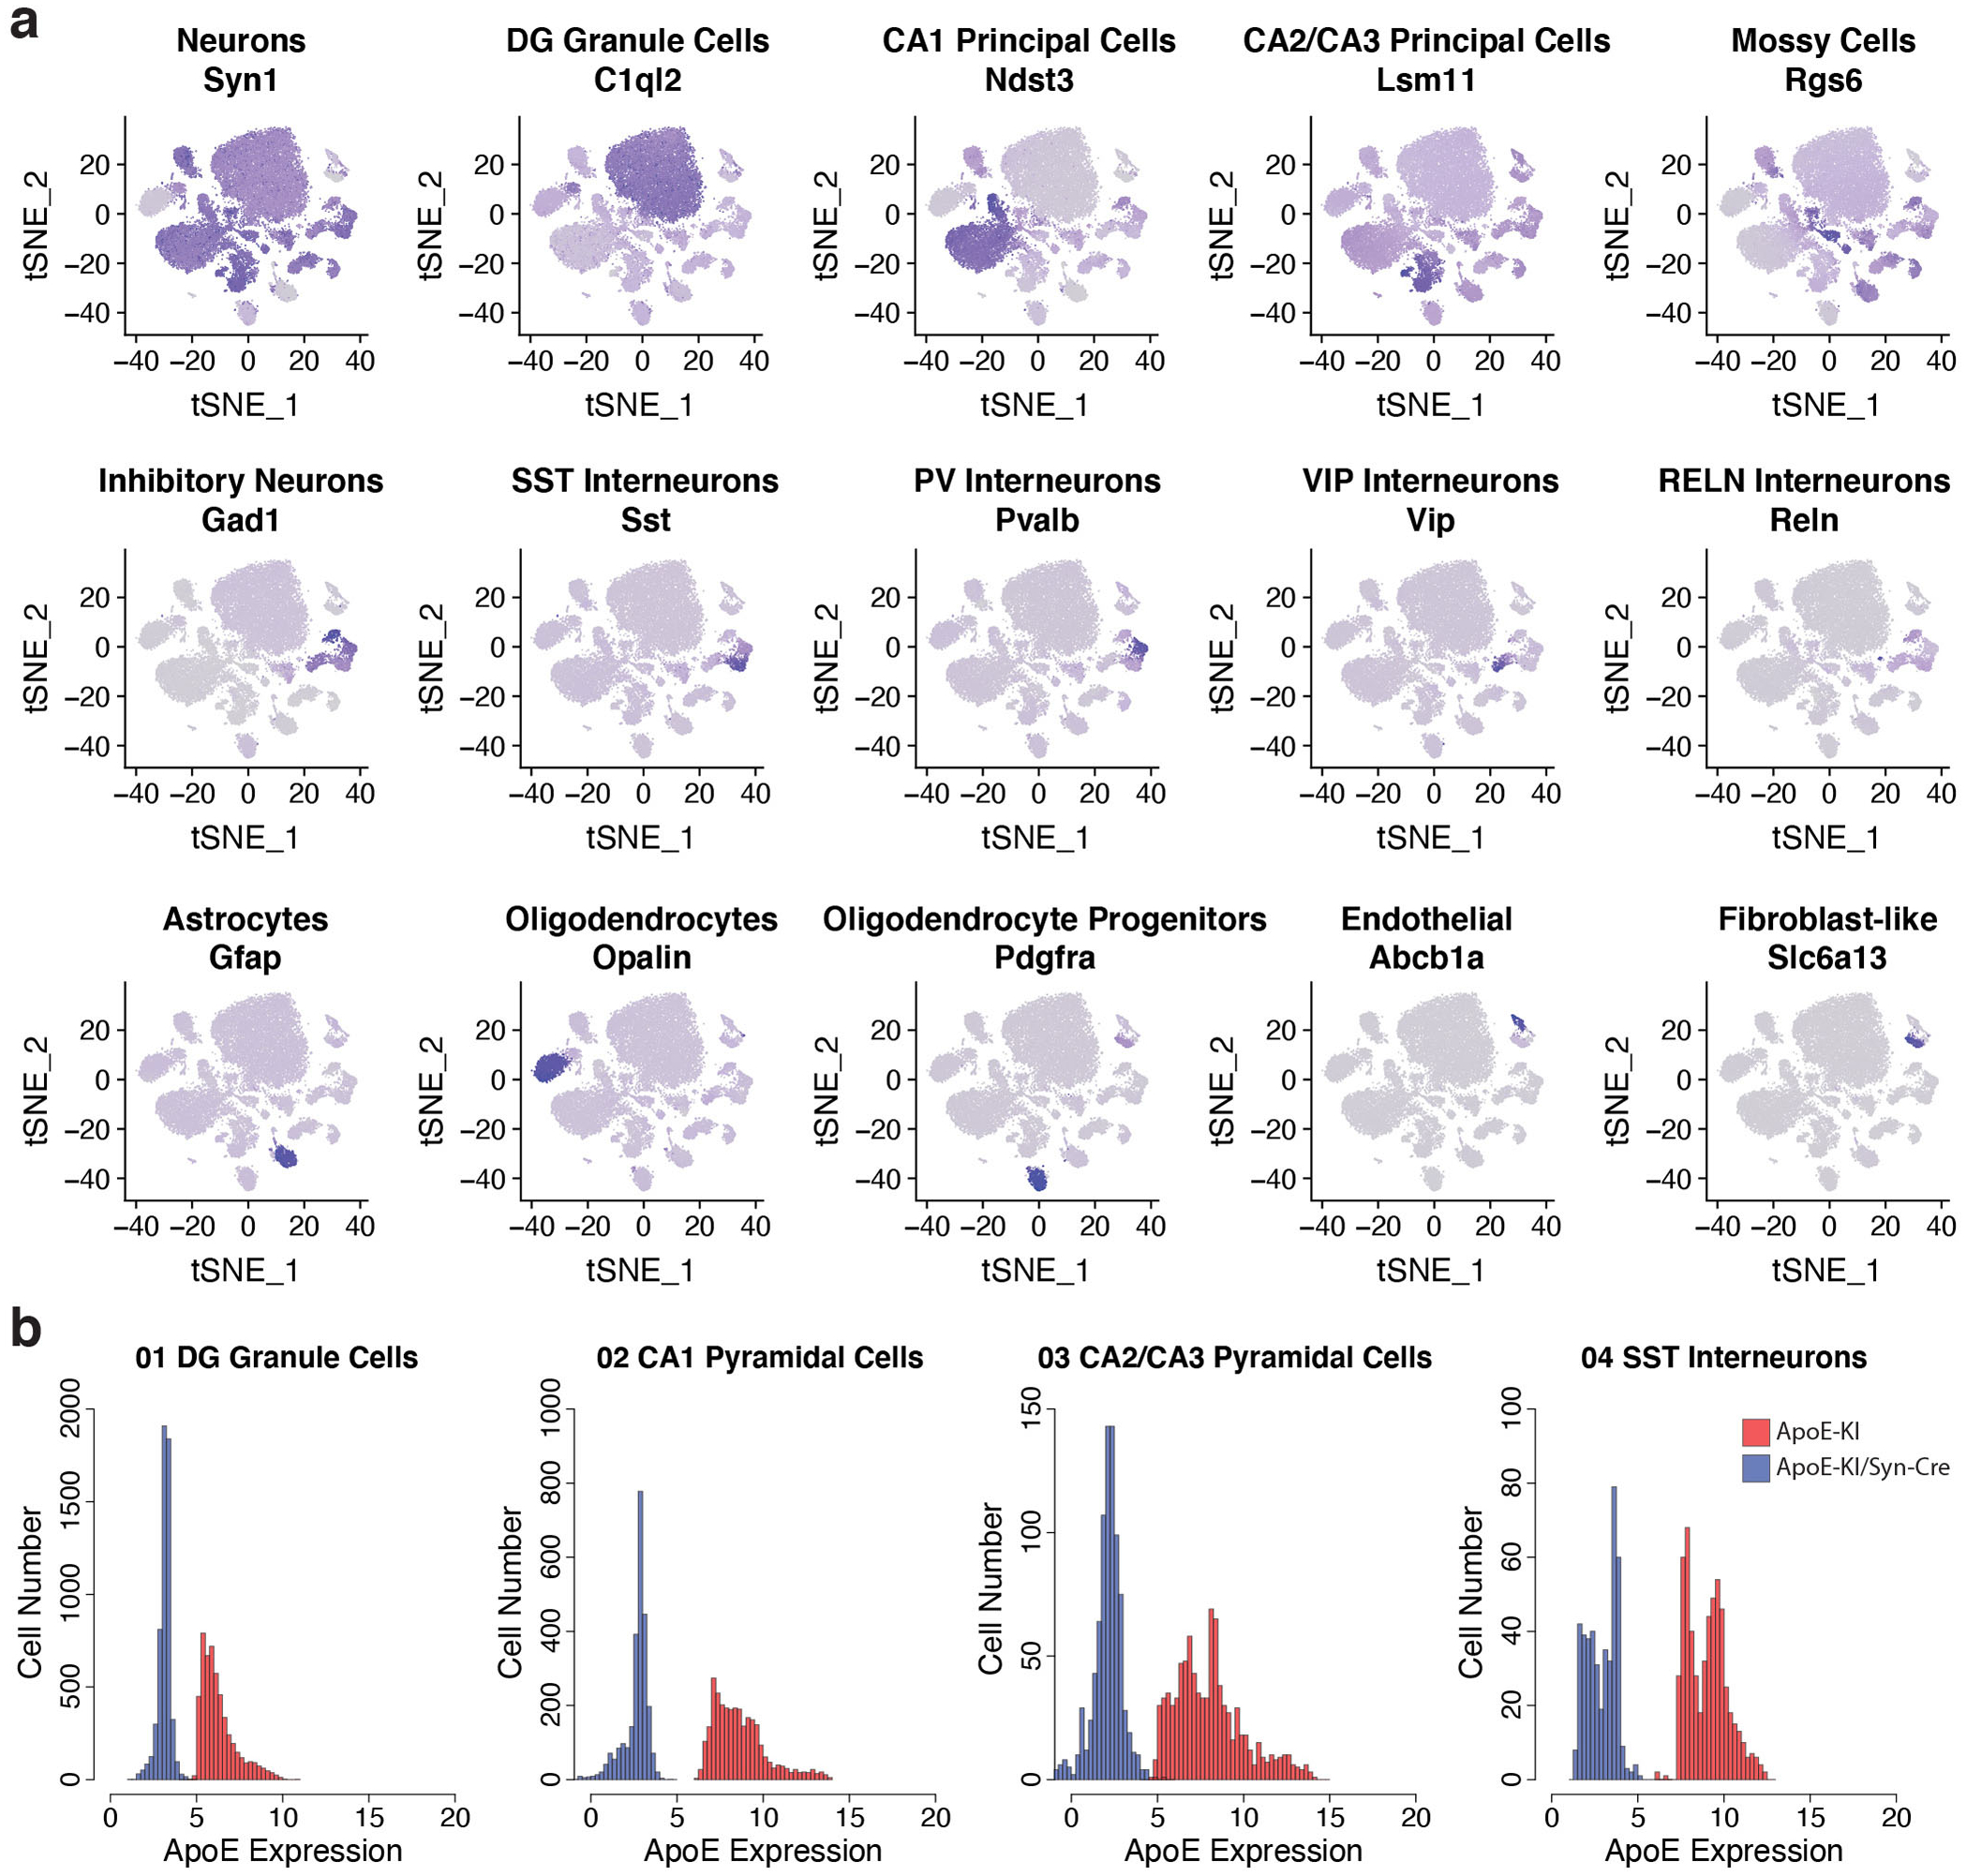
a, Feature plots of marker genes for major cell types in the combined apoE-KI and apoE-KI/Syn-Cre cell clustering. b, Histograms of apoE expression levels in the combined apoE-KI and apoE-KI/Syn-Cre cohort, showing that even the low levels of apoE expression measured in apoE-KI neurons are true expression, fully separated from the noise levels in apoE-KI/Syn-Cre neurons.
Extended Data Fig. 8. Neuronal expression of apoE predicts neuronal expression of MHC-I genes, and neuronal expression of MHC-I genes predicts Tau tangle, but not β-amyloid, pathology across patients with MCI or AD.
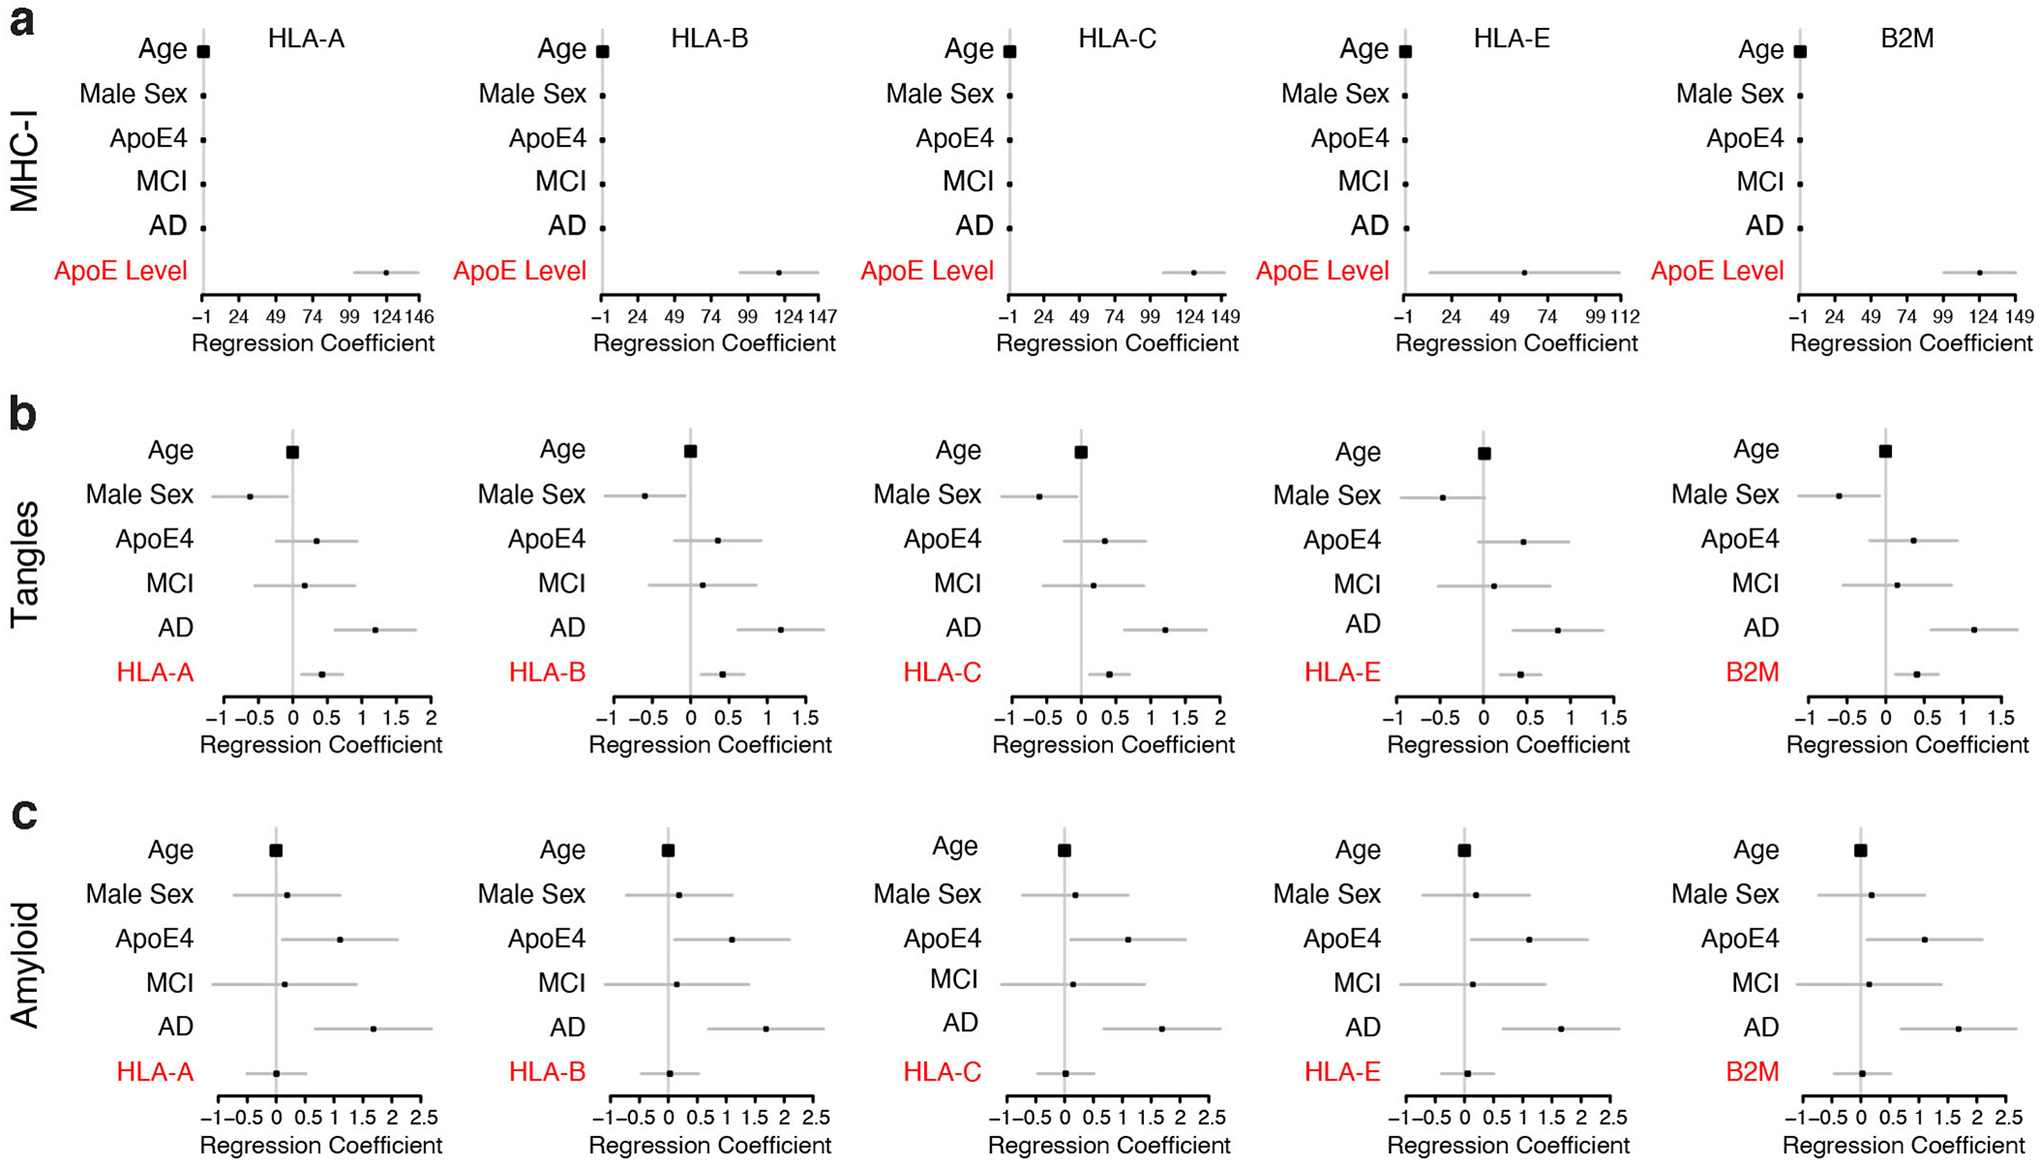
a, Linear regression coefficients (± 95% confidence intervals) for age, sex, apoE4 genotype, clinical diagnosis (MCI or AD relative to control) and average apoE expression level in neurons in predicting the expression of MHC-I genes and B2M gene in neurons of patients from the ROSMAP snRNA-seq cohort depicted in Figure 3. b, Linear regression coefficients (± 95% confidence intervals) for age, sex, apoE4 genotype, clinical diagnosis (MCI or AD relative to control), and MHC-I genes and B2M gene expression in predicting tau tangle pathology in patients from the ROSMAP snRNA-seq cohort depicted in Figure 3. c, Linear regression coefficients (± 95% confidence intervals) for age, sex, apoE4 genotype, clinical diagnosis (MCI or AD relative to control), and MHC-I genes and B2M gene expression in predicting β-amyloid pathology in participants from the ROSMAP snRNA-seq cohort depicted in Figure 3.
Extended Data Fig. 9. Quantification of B2M protein in B2M-shRNA-treated NSE-E4+/+ mouse primary neurons and B2M-KO mouse primary neurons.
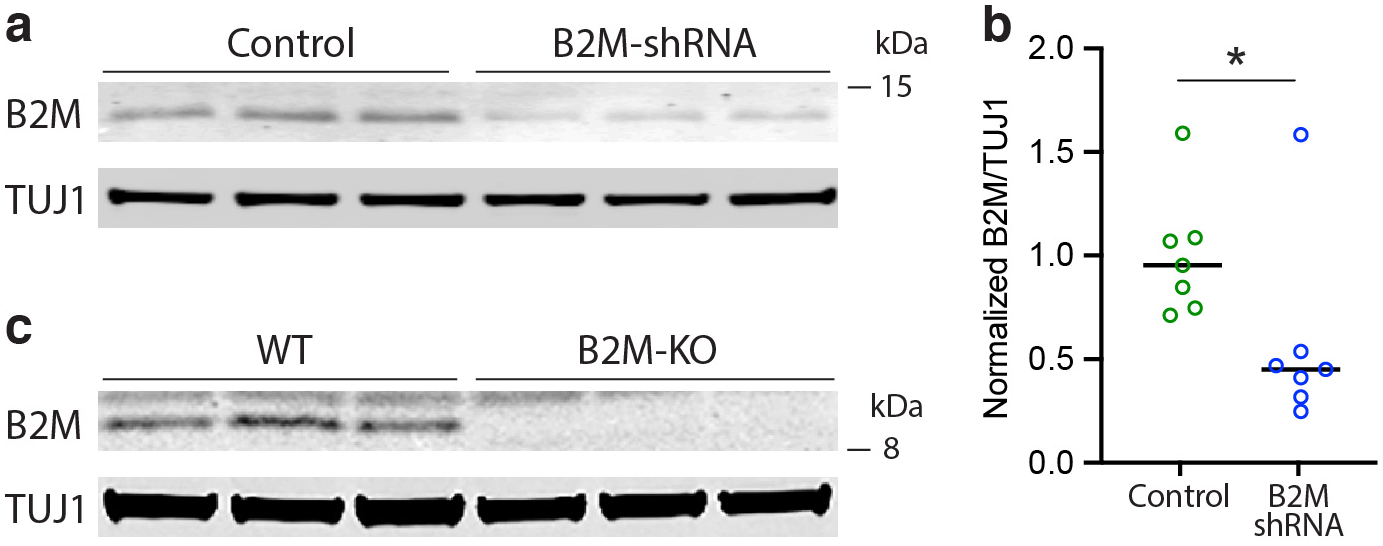
a, Western blot of B2M and TUJ1 protein in NSE-E4+/+ mouse primary neurons treated with Lenti-B2M-shRNA or Lenti-scrambled-shRNA control. Data are representative of two primary neuron culture experiments. b, Quantification of B2M/TUJ1 ratio from western blots. B2M protein is significantly reduced in B2M-shRNA-treated neurons as compared to control shRNA-treated neurons (two-sided t-test, p = 0.017, n = 7 per group). c, Western blot of B2M and TUJ1 protein in lysates of WT and B2M-KO mouse primary neurons, showing elimination of B2M in the B2M-KO neurons. The experiment was performed once.
Extended Data Fig. 10. Model of apoE upregulation of MHC-I driving Tau pathology and selective neuronal and synaptic degeneration/loss.
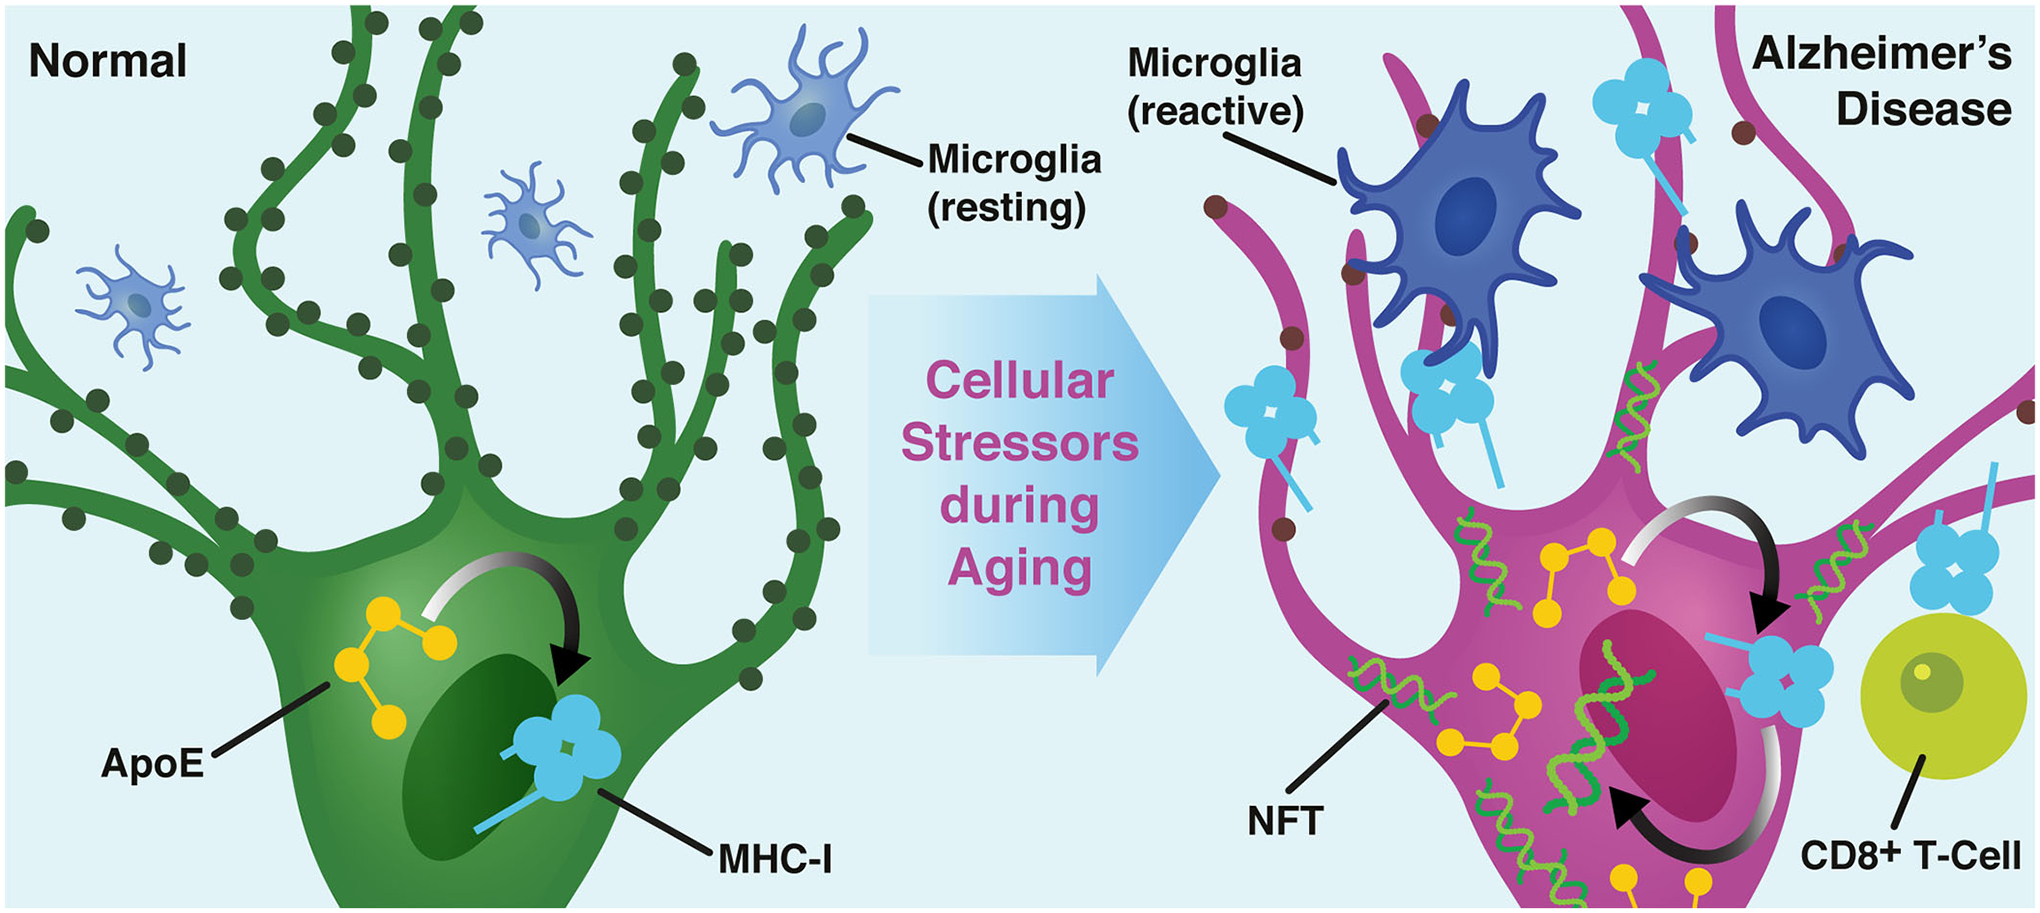
In response to various cellular stressors during aging, increase in neuronal apoE expression, as a molecular switch, triggers aberrant upregulation of neuronal MHC-I, driving Tau pathology and the selective destruction of individual synapses and neurons, potentially (as a hypothesis) by reactive microglia and/or, MHC’s classical partner, CD8+ T-cells. In the AD context, apoE4 exacerbates this process.
Supplementary Material
Acknowledgements
This work was partially supported by grants R01AG048017, RF1AG055421, and R01AG055682 to Y.H. from the National Institutes of Health. The results published here are in part based on data obtained from the AMP-AD Knowledge Portal accessed at doi:10.7303/syn2580853. We are grateful to the participants and data contributors in the Religious Order Study, the Memory and Aging Project (ROSMAP). ROSMAP data were provided by the Rush Alzheimer’s Disease Center, Rush University Medical Center, Chicago. ROSMAP data collection was supported through funding by NIA grants P30AG10161, R01AG15819, R01AG17917, R01AG36836, U01AG32984, U01AG46152, U01061356, the Illinois Department of Public Health, and the Translational Genomics Research Institute. The Gladstone Flow Cytometry Core FACSAria cell sorter is supported by NIH S10 RR028962 and the James B. Pendleton Charitable Trust. We thank Eric Chow and the staff at the UCSF CAT Core for advice and support with RNA sequencing; Natasha Carli, Jim McGuire, Po-Lin So, and Katherine Pollard of the Gladstone Genomics Core for advice on sample preparation and sequencing; Nandhini Raman of the Gladstone Flow Cytometry Core for sorting the nuclei; Steve Belunek and Wil Maguire of Gladstone Information Technology for server support; Julia Roudabush and Veronica Viray for contract support; Sidney Oduah and Linda Hagimori for purchasing; and Theodora Pak for editorial assistance.
Footnotes
Competing Interests Statement
Y.H. is a co-founder and scientific advisory board member of E-Scape Bio, Inc., GABAeron, Inc., and Mederon Bio, LLC. Other authors declare no competing financial interests.
Code Availability
All codes generated during this study are available upon request from the corresponding authors.
Data Availability
Mouse snRNA-seq data generated in association with this study are available in the Gene Expression Omnibus (GEO) under the accession number GSE167497. Source Data associated with Figures 4, 6–8 as well as Extended Data Figure 9 are available in the Supplementary Information.
snRNA sequencing data from the ROSMAP study referenced in Figure 3 as well as in Extended Data Figures 5 and 8 are available on The Rush Alzheimer’s Disease Center (RADC) Research Resource Sharing Hub at https://www.radc.rush.edu/docs/omics.htm (snRNA-seq PFC) or at Synapse (https://www.synapse.org/#!Synapse:syn18485175) under the doi 10.7303/syn18485175. The ROSMAP metadata can be accessed at https://www.synapse.org/#!Synapse:syn3157322.
Data from the Allen Institute for Brain Science, referenced in Extended Data Figure 6a–d, along with data visualization tools and associated metadata are available at: https://portal.brain-map.org/atlases-and-data/rnaseq.
Single-cell sequencing data from neurotypical human brain, referenced in Extended Data Figure 6e–g, are available in the Gene Expression Omnibus (GEO) database, www.ncbi.nlm.nih.gov/geo (accession no. GSE67835).
The Kyoto Encyclopedia of Genes and Genomes (KEGG) Pathways database is available at: https://www.genome.jp/kegg/pathway.html
References
- 1.Fu H, Hardy J & Duff KE Selective vulnerability in neurodegenerative diseases. Nat. Neurosci 21, 1350–1358 (2018). [DOI] [PMC free article] [PubMed] [Google Scholar]
- 2.Andrews-Zwilling Y et al. Apolipoprotein E4 causes age- and tau-dependent impairment of GABAergic interneurons, leading to learning and memory deficits in mice. J. Neurosci 30, 13707–13717 (2010). [DOI] [PMC free article] [PubMed] [Google Scholar]
- 3.Huang Y & Mucke L Alzheimer mechanisms and therapeutic strategies. Cell 148, 1204–1222 (2012). [DOI] [PMC free article] [PubMed] [Google Scholar]
- 4.Najm R, Jones EA & Huang Y Apolipoprotein E4, inhibitory network dysfunction, and Alzheimer’s disease. Mol. Neurodegener 14–24 (2019). [DOI] [PMC free article] [PubMed] [Google Scholar]
- 5.Farrer LA et al. Effects of age, sex, and ethnicity on the association between apolipoprotein E genotype and Alzheimer disease: A meta-analysis. JAMA 278, 1349–1356 (1997). [PubMed] [Google Scholar]
- 6.Ward A et al. Prevalence of apolipoprotein E4 genotype and homozygotes (APOE e4/4) among patients diagnosed with Alzheimer’s disease: A systematic review and meta-analysis. Neuroepidemiology 38, 1–17 (2012). [DOI] [PubMed] [Google Scholar]
- 7.Pitas RE, Boyles JK, Lee SH, Foss D & Mahley RW Astrocytes synthesize apolipoprotein E and metabolize apolipoprotein E-containing lipoproteins. Biochim. Biophys. Acta 917, 148–161 (1987). [DOI] [PubMed] [Google Scholar]
- 8.Wang C et al. Gain of toxic apolipoprotein E4 effects in human iPSC-derived neurons is ameliorated by a small-molecule structure corrector. Nat. Med 24, 647–657 (2018). [DOI] [PMC free article] [PubMed] [Google Scholar]
- 9.Xu P-T et al. Specific regional transcription of apolipoprotein E in human brain neurons. Am. J. Pathol 154, 601–611 (1999). [DOI] [PMC free article] [PubMed] [Google Scholar]
- 10.Xu Q et al. Profile and regulation of apolipoprotein E (apoE) expression in the CNS in mice with targeting of green fluorescent protein gene to the apoE locus. J. Neurosci 26, 4985–4994 (2006). [DOI] [PMC free article] [PubMed] [Google Scholar]
- 11.Knoferle J et al. Apolipoprotein E4 produced in GABAergic interneurons causes learning and memory deficits in mice. J. Neurosci 34, 14069–14078 (2014). [DOI] [PMC free article] [PubMed] [Google Scholar]
- 12.Brodbeck J et al. Structure-dependent impairment of intracellular apolipoprotein E4 trafficking and its detrimental effects are rescued by small-molecule structure correctors. J. Biol. Chem 286, 17217–17226 (2011). [DOI] [PMC free article] [PubMed] [Google Scholar]
- 13.Lin Y-T et al. APOE4 Causes Widespread molecular and cellular alterations associated with Alzheimer’s disease phenotypes in human iPSC-derived brain cell types. Neuron 98, 1141–1154 (2018). [DOI] [PMC free article] [PubMed] [Google Scholar]
- 14.Shi Y et al. ApoE4 markedly exacerbates tau-mediated neurodegeneration in a mouse model of tauopathy. Nature 549, 523–527 (2017). [DOI] [PMC free article] [PubMed] [Google Scholar]
- 15.Orr AL et al. Neuronal apolipoprotein E4 expression results in proteome-wide alterations and compromises bioenergetic capacity by disrupting mitochondrial function. J. Alzheimers Dis 68, 991–1011 (2019). [DOI] [PMC free article] [PubMed] [Google Scholar]
- 16.Mahley RW, Weisgraber KH & Huang Y Apolipoprotein E4: A causative factor and therapeutic target in neuropathology, including Alzheimer’s disease. Proc. Natl. Acad. Sci. USA 103, 5644–5651 (2006). [DOI] [PMC free article] [PubMed] [Google Scholar]
- 17.Adelson JD et al. Neuroprotection from stroke in the absence of MHCI or PirB. Neuron 73, 1100–1107 (2012). [DOI] [PMC free article] [PubMed] [Google Scholar]
- 18.Bombeiro AL et al. MHC-I and PirB upregulation in the central and peripheral nervous system following sciatic nerve injury. PLoS One 11, e0161463 (2016). [DOI] [PMC free article] [PubMed] [Google Scholar]
- 19.Corriveau RA, Huh GS & Shatz CJ Regulation of Class I MHC gene expression in the developing and mature CNS by neural activity. Neuron 21, 505–520 (1998). [DOI] [PubMed] [Google Scholar]
- 20.Mangold CA et al. CNS-wide sexually dimorphic induction of the major histocompatibility complex 1 pathway with aging. J. Gerontol. A. Biol. Sci. Med. Sci 72, 16–29 (2017). [DOI] [PMC free article] [PubMed] [Google Scholar]
- 21.Starkey HDV et al. Neuroglial expression of the MHCI pathway and PirB receptor is upregulated in the hippocampus with advanced aging. J. Mol. Neurosci 48, 111–126 (2012). [DOI] [PMC free article] [PubMed] [Google Scholar]
- 22.Datwani A et al. Classical MHCI molecules regulate retinogeniculate refinement and limit ocular dominance plasticity. Neuron 64, 463–470 (2009). [DOI] [PMC free article] [PubMed] [Google Scholar]
- 23.Lee H et al. Synapse elimination and learning rules co-regulated by MHC class I H2-Db. Nature 509, 195–200 (2014). [DOI] [PMC free article] [PubMed] [Google Scholar]
- 24.Leung L et al. Apolipoprotein E4 causes age- and sex-dependent impairments of hilar GABAergic interneurons and learning and memory deficits in mice. PLoS One 7, e53569 (2012). [DOI] [PMC free article] [PubMed] [Google Scholar]
- 25.Zhang Y et al. An RNA-sequencing transcriptome and splicing database of glia, neurons, and vascular cells of the cerebral cortex. J. Neurosci 34, 11929–11947 (2014). [DOI] [PMC free article] [PubMed] [Google Scholar]
- 26.Cembrowski MS, Wang L, Sugino K, Shields BC & Spruston N Hipposeq: a comprehensive RNA-seq database of gene expression in hippocampal principal neurons. eLife 5, e14997 (2016). [DOI] [PMC free article] [PubMed] [Google Scholar]
- 27.Saunders A et al. Molecular diversity and specializations among the cells of the adult mouse brain. Cell 174, 1015–1030 (2018). [DOI] [PMC free article] [PubMed] [Google Scholar]
- 28.Lein ES et al. Genome-wide atlas of gene expression in the adult mouse brain. Nature 445, 168–176 (2007). [DOI] [PubMed] [Google Scholar]
- 29.van Dijk D et al. Recovering gene interactions from single-cell data using data diffusion. Cell 174, 716–729 (2018). [DOI] [PMC free article] [PubMed] [Google Scholar]
- 30.Kanehisa M & Goto S KEGG: Kyoto Encyclopedia of Genes and Genomes. Nucleic Acids Res 28, 27–30 (2000). [DOI] [PMC free article] [PubMed] [Google Scholar]
- 31.Suberbielle E et al. Physiologic brain activity causes DNA double-strand breaks in neurons, with exacerbation by amyloid-β. Nat. Neurosci 16, 613–621 (2013). [DOI] [PMC free article] [PubMed] [Google Scholar]
- 32.Gerakis Y & Hetz C A decay of the adaptive capacity of the unfolded protein response exacerbates Alzheimer’s disease. Neurobiol. Aging 63, 162–164 (2018). [DOI] [PubMed] [Google Scholar]
- 33.Shi Y & Holtzman DM Interplay between innate immunity and Alzheimer disease: APOE and TREM2 in the spotlight. Nat. Rev. Immunol 18, 759 (2018). [DOI] [PMC free article] [PubMed] [Google Scholar]
- 34.Tasic B et al. Shared and distinct transcriptomic cell types across neocortical areas. Nature 563, 72–78 (2018). [DOI] [PMC free article] [PubMed] [Google Scholar]
- 35.Mathys H et al. Single-cell transcriptomic analysis of Alzheimer’s disease. Nature 570, 332–337 (2019). [DOI] [PMC free article] [PubMed] [Google Scholar]
- 36.Darmanis S et al. A survey of human brain transcriptome diversity at the single cell level. Proc. Natl. Acad. Sci. USA 112, 7285–7290 (2015). [DOI] [PMC free article] [PubMed] [Google Scholar]
- 37.Ohtsuka M, Inoko H, Kulski JK & Yoshimura S Major histocompatibility complex (Mhc) class Ib gene duplications, organization and expression patterns in mouse strain C57BL/6. BMC Genomics 9, 178 (2008). [DOI] [PMC free article] [PubMed] [Google Scholar]
- 38.Brecht WJ et al. Neuron-specific apolipoprotein E4 proteolysis is associated with increased Tau phosphorylation in brains of transgenic mice. J. Neurosci 24, 2527–2534 (2004). [DOI] [PMC free article] [PubMed] [Google Scholar]
- 39.Mondragón-Rodríguez S, Perry G, Luna-Muñoz J, Acevedo-Aquino MC & Williams S Phosphorylation of tau protein at sites Ser396–404 is one of the earliest events in Alzheimer’s disease and Down syndrome. Neuropathol. Appl. Neurobiol 40, 121–135 (2014). [DOI] [PubMed] [Google Scholar]
- 40.Braak H & Braak E Neuropathological stageing of Alzheimer-related changes. Acta Neuropathol 82, 239–259 (1991). [DOI] [PubMed] [Google Scholar]
- 41.Ballatore C, Lee VM-Y & Trojanowski JQ Tau-mediated neurodegeneration in Alzheimer’s disease and related disorders. Nat. Rev. Neurosci 8, 663–672 (2007). [DOI] [PubMed] [Google Scholar]
- 42.Germain RN & Margulies DH The biochemistry and cell biology of antigen processing and presentation. Ann. Rev. Immunol 11, 403–450 (1993). [DOI] [PubMed] [Google Scholar]
- 43.Hansen TH & Leet DR Mechanism of class I assembly with β2 microglobulin and loading with peptide. in Advances in Immunology (ed. Dixon FJ) vol. 64 105–137 (Academic Press, 1997). [DOI] [PubMed] [Google Scholar]
- 44.Harris FM et al. Carboxyl-terminal-truncated apolipoprotein E4 causes Alzheimer’s disease-like neurodegeneration and behavioral deficits in transgenic mice. Proc. Natl. Acad. Sci. USA 100, 10966–10971 (2003). [DOI] [PMC free article] [PubMed] [Google Scholar]
- 45.Tesseur I et al. Expression of human apolipoprotein E4 in neurons causes hyperphosphorylation of protein tau in the brains of transgenic mice. Am. J. Pathol 156, 951–964 (2000). [DOI] [PMC free article] [PubMed] [Google Scholar]
- 46.Goddard CA, Butts DA & Shatz CJ Regulation of CNS synapses by neuronal MHC class I. Proc. Natl. Acad. Sci. USA 104, 6828–6833 (2007). [DOI] [PMC free article] [PubMed] [Google Scholar]
- 47.Gate D et al. Clonally expanded CD8 T cells patrol the cerebrospinal fluid in Alzheimer’s disease. Nature 577, 399–404 (2020). [DOI] [PMC free article] [PubMed] [Google Scholar]
- 48.Huh GS et al. Functional requirement for class I MHC in CNS development and plasticity. Science 290, 2155–2159 (2000). [DOI] [PMC free article] [PubMed] [Google Scholar]
- 49.Kim T et al. Human LilrB2 is a β-amyloid receptor and its murine homolog PirB regulates synaptic plasticity in an Alzheimer’s model. Science 341, 1399–1404 (2013). [DOI] [PMC free article] [PubMed] [Google Scholar]
- 50.Brown GC & Neher JJ Microglial phagocytosis of live neurons. Nat. Rev. Neurosci 15, 209–216 (2014). [DOI] [PubMed] [Google Scholar]
- 51.Hamanaka H et al. Altered cholesterol metabolism in human apolipoprotein E4 knock-in mice. Hum. Mol. Genet 9, 353–361 (2000). [DOI] [PubMed] [Google Scholar]
- 52.Bien-Ly N, Gillespie AK, Walker D, Yoon SY & Huang Y Reducing Human Apolipoprotein E levels attenuates age-dependent Aβ accumulation in mutant human amyloid precursor protein transgenic mice. J. Neurosci 32, 4803–4811 (2012). [DOI] [PMC free article] [PubMed] [Google Scholar]
- 53.Bennett DA et al. Religious orders study and rush memory and aging project. J. Alzheimers Dis 64, S161–S189 (2018). [DOI] [PMC free article] [PubMed] [Google Scholar]
- 54.De Jager PL et al. A multi-omic atlas of the human frontal cortex for aging and Alzheimer’s disease research. Scientific Data 5, 180142 (2018). [DOI] [PMC free article] [PubMed] [Google Scholar]
- 55.10x Genomics. Isolation of nuclei for single cell RNA sequencing - demonstrated protocol - sample prep - single cell gene expression - official 10x genomics support. Isolation of Nuclei for Single Cell RNA Sequencing https://assets.ctfassets.net/an68im79xiti/6FhJX6yndYy0OwskGmMc8I/e2677be827e82cd954ecfb8b30278e5e/CG000124_SamplePrepDemonstratedProtocol_-_Nuclei_RevD.pdf (2018).
- 56.Allen Institute for Brain Science. Allen Cell Types Database Technical White Paper: Transcriptomics 1–15 (2018). [Google Scholar]
- 57.Butler A, Hoffman P, Smibert P, Papalexi E & Satija R Integrating single-cell transcriptomic data across different conditions, technologies, and species. Nat. Biotechnol 36, 411–420 (2018). [DOI] [PMC free article] [PubMed] [Google Scholar]
- 58.Stuart T et al. Comprehensive Integration of Single-Cell Data. Cell 177, 1888–1902 (2019). [DOI] [PMC free article] [PubMed] [Google Scholar]
- 59.Ritchie ME et al. limma powers differential expression analyses for RNA-sequencing and microarray studies. Nucleic Acids Res 43, e47:1–13 (2015). [DOI] [PMC free article] [PubMed] [Google Scholar]
- 60.Shannon P et al. Cytoscape: A Software Environment for Integrated Models of Biomolecular Interaction Networks. Genome Res 13, 2498–2504 (2003). [DOI] [PMC free article] [PubMed] [Google Scholar]
- 61.He Z et al. Comprehensive transcriptome analysis of neocortical layers in humans, chimpanzees and macaques. Nat. Neurosci 20, 886–895 (2017). [DOI] [PubMed] [Google Scholar]
Associated Data
This section collects any data citations, data availability statements, or supplementary materials included in this article.
Supplementary Materials
Data Availability Statement
Mouse snRNA-seq data generated in association with this study are available in the Gene Expression Omnibus (GEO) under the accession number GSE167497. Source Data associated with Figures 4, 6–8 as well as Extended Data Figure 9 are available in the Supplementary Information.
snRNA sequencing data from the ROSMAP study referenced in Figure 3 as well as in Extended Data Figures 5 and 8 are available on The Rush Alzheimer’s Disease Center (RADC) Research Resource Sharing Hub at https://www.radc.rush.edu/docs/omics.htm (snRNA-seq PFC) or at Synapse (https://www.synapse.org/#!Synapse:syn18485175) under the doi 10.7303/syn18485175. The ROSMAP metadata can be accessed at https://www.synapse.org/#!Synapse:syn3157322.
Data from the Allen Institute for Brain Science, referenced in Extended Data Figure 6a–d, along with data visualization tools and associated metadata are available at: https://portal.brain-map.org/atlases-and-data/rnaseq.
Single-cell sequencing data from neurotypical human brain, referenced in Extended Data Figure 6e–g, are available in the Gene Expression Omnibus (GEO) database, www.ncbi.nlm.nih.gov/geo (accession no. GSE67835).
The Kyoto Encyclopedia of Genes and Genomes (KEGG) Pathways database is available at: https://www.genome.jp/kegg/pathway.html