Abstract
Background
Breast cancer is one of the most common malignant tumors among women worldwide. This study aimed to screen key genes and pathways for breast cancer diagnosis and treatment.
Material/Methods
We obtained public data from the NCBI GEO database. The data were divided into a control group (normal breast tissue) and a treatment group (breast cancer tissue). We screened 32 differentially expressed genes (DEGs) between normal breast and cancerous tissues and used GO analysis and GSEA to identify the key pathways. We then combined LASSO and SVM-RFE analyses to screen key genes, and used CIBERSORT to obtain the proportion of 22 types of immune cells. The relationships between key genes and immune-infiltrating cells were further explored.
Results
We screened 32 DEGs from the 2 groups, including 27 downregulated genes and 5 upregulated genes. GO analysis indicated that the DEGs were mainly correlated with collagen-containing extracellular matrix (ECM), Wnt signaling pathway, and glycosaminoglycan binding. GSEA indicated that the treatment group was correlated with chromosome segregation and cell cycle while the control group was correlated with cornification, intermediate filament, and nuclear transcription. Through machine learning, SYNM, TGFBR3, and COL10A1 were screened as key genes. Numbers of CD8 T cells, gamma delta T cells, and M1 macrophages were significantly higher, while monocytes and follicular helper-T cells were significantly lower in the treatment group. The downregulated genes, SYNM and TGFBR3, were positively correlated with CD8 T cells and monocytes, but were negatively correlated with gamma delta T cells and M1 macrophages. The upregulated gene, COL10A1, was positively correlated with gamma delta T cells and M1 macrophages, and was negatively correlated with CD8 T cells, monocytes, and follicular helper-T cells.
Conclusions
SYNM, TGFBR3, and COL10A1 are diagnostic genes of breast cancer. They affect breast cancer cells by modulating immune-infiltrating cells.
Keywords: Breast Diseases, Medical Oncology, Psycho-Oncology
Background
Breast cancer is one of the most common malignant tumors in women and is the leading cause of female deaths worldwide. Although breast cancer surgery combined with comprehensive treatment can greatly improve the overall survival (OS) and disease-free survival (RFS) of breast cancer patients, some patients still have a poor prognosis [1]. Thus, the search for new biomarkers of cancer treatment is very important for such patients [2].
Bioinformatics analysis of tumors has become an important method for exploring mechanisms of tumor development [3,4]. Based on bioinformatics methods, we can learn about genes and pathways for the diagnosis and treatment of tumors. Recently, data analysis of primary and metastatic prostate cancer patients, combined with machine learning methods, for establishment of a model for predicting the status of prostate cancer patients, found new targets for cancer treatment and proved them using in vitro experiments [5]. Moreover, they suggested that this method could be further applied to progression of other tumors. In this study, we analyzed a public database using machine learning methods to find signature diagnostic genes for breast cancer.
Breast tumors consist of cancerous and non-cancerous cells, which have rarely been studied; moreover, enriched pathways were found to be related to the tumor microenvironment. Therefore, we identified the composition of immune cells in breast tumors, and investigated the correlation between the key genes and infiltrating immune cells in breast cancer patients [6–9].
Thus, we analyzed mechanisms of key genes that regulate infiltrating immune cells and have an effect on breast cancer progression, in combination with previous studies. We obtained new targets through cancer biology, together with machine learning methods, which provide new pathways for breast cancer treatment.
Material and Methods
Gene Expression Data Acquisition
This study used data from the public domain. We selected the keywords “primary breast cancer” in the NCBI Gene Expression Omnibus (GEO) public database and the samples were limited to “Homo sapiens.” We obtained 6 datasets that included both normal and cancerous breast tissues. The GSE54002 series matrix files had 433 samples (16 normal breast tissues and 417 breast cancer tissues), including large samples; hence, we could obtain comprehensive gene expression profiles. The GSE14548 series matrix files comprised 66 samples (28 normal breast tissues and 38 breast cancer tissues), which concentrated on breast cancer progression. The GSE5764 series matrix files had 30 samples in total (20 normal breast tissues and 10 breast cancer tissues) that supplemented lobular cancerous tissues and lobular cells. These were used as training sets to make the data more comprehensive. The GSE29044, GSE 29431, and GSE15852 series of matrix files consisted of 109 (66 normal breast tissues and 73 breast cancer tissues), 66 (12 normal breast tissues and 54 breast cancer tissues), and 86 (43 breast normal tissues and 43 breast cancer tissues) samples, respectively. These datasets are of moderate size and are not limited to a specific age or race.
Analysis of Differentially Expressed Genes
Differentially expressed genes (DEGs) in primary breast cancer tissues and normal tissues from GSE5764, GSE14548, and GSE54002 were selected using the R software package “limma.” We used a volcano plot to visualize the DEGs. We set |logFC| ≥2 and P<0.05 as the thresholds for DEGs, and P values were adjusted for multiple testing correction using the false discovery rate (FDR).
We screened breast cancer signature genes (key genes) that might be used as breast cancer diagnostic markers from the DEGs using the lasso logistic regression (R package “glmnet”) and SVM-RFE algorithm methods (R package e1071). Diagnostic genes were obtained from the overlap of the 2 methods and the plotted Venn diagram using R software (package “Venn”). We used these signature diagnostic genes as key genes for breast cancer, and screened genes that were also differentially expressed in the test datasets using boxplots to visualize the outcomes; the ROC curve was then used to prove the accuracy of the results (R package “pROC”).
Enrichment Analysis
The samples were divided into 2 groups: a normal breast tissue group (control group) and a breast cancer tissue group (treatment group). DEGs were used for gene ontology (GO) enrichment analysis. GO enrichment analysis is widely used to identify the functions and pathways of genes, including biological progress (BP), cellular components (CC), and molecular functions (MF). Gene set enrichment analysis (GSEA) was used to explore the biological functions of the 2 groups.
The R software package “clusterProfiler” was used to analyze GO, the “ggplot2” package was used to make the barplots, and GSEA was run for the “c5.go.v7.4.symbols.gmt” gene sets. P<0.05 was considered to be significant enrichment with an FDR>2.
Immune Cell Infiltration Analysis
The tumor microenvironment (TME) plays an important role in tumor antagonism and promotion; immune cells are a critical part of the TME. Using the cell-type identification by estimating relative subsets of RNA transcripts (CIBERSORT) algorithm, this study evaluated the quantity of 22 immune cells in the control and treatment groups, and identified differential proportions of infiltrating immune cells in both groups, and further explored the relationship between key genes and the infiltrating immune cells.
Statistical Analysis
The t test was used for comparison between both groups, and online gene expression profiling interactive analysis (GEPIA) was used to plot the survival analysis and Kaplan-Meier curves. We used R 4.1.1 to analyze all data and visualize outcomes. Statistical significance was defined as P<0.05.
Results
Identification of Key Genes
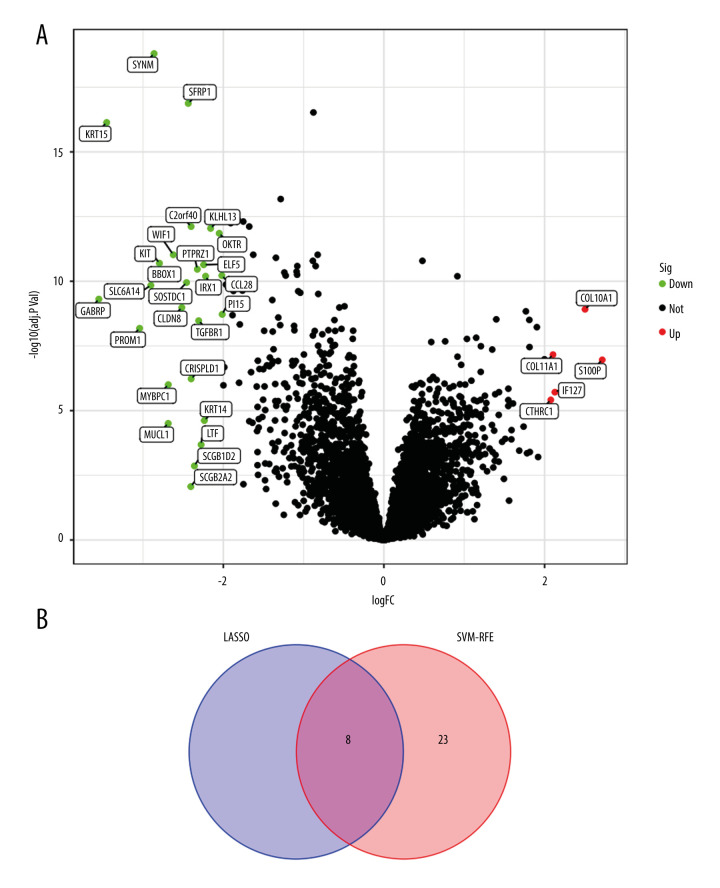
There were 32 DEGs between cancerous and normal breast tissues in the GSE5764, GSE 54002, and GSE14548 datasets, including 27 downregulated genes and 5 upregulated genes. A volcano plot (Figure 1A) shows the DEGs. Eight and 23 DEGs were screened using LASSO regression and SVM-RFE regression, respectively.
Figure 1.
(A) The DEGs between Koeberg breast cancer tissues and normal breast tissues. (B) The Venn diagram showed the 8 overlapping genes.
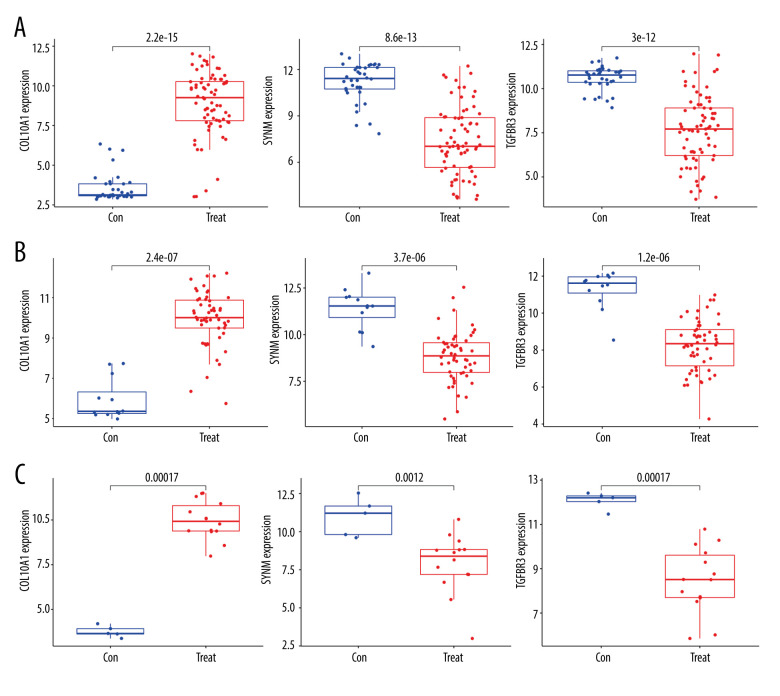
Finally, we identified 8 signature diagnostic genes (key genes) from the overlapping genes of the 2 methods between the 2 groups (Figure 1B). The 7 downregulated genes were SYNM, KRT15, ELF5, CCL28, PI15, TGFBR3, and KRT14, and the only upregulated gene was COL10A1. We further analyzed the differential expression of the 8 genes in breast cancer and normal tissues in the test datasets (GSE29044, GSE 29431, and GSE15852), and the results showed that only TGFBR3, SYNM, and COL10A1 were still differentially expressed (Figure 2A–2C). The ROC curves showed that all areas under the curve (AUC) were >0.7, indicating good accuracy.
Figure 2.
(A) Expression of the 3 key genes in the GSE29044. (B) Expression of the 3 key genes in the GSE29431. (C) Expression of the 3 key genes in the GSE15852.
GO Analysis and GSEA Enrichment
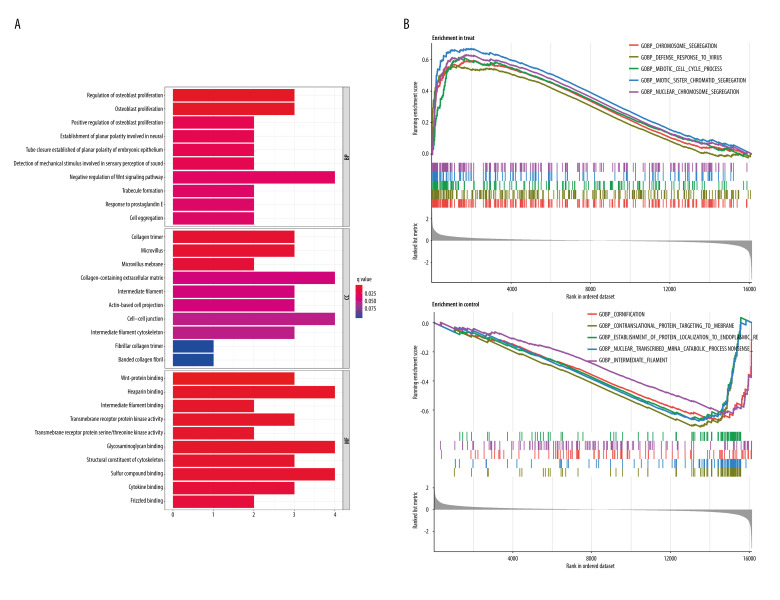
GO enrichment analysis showed that DEGs mainly existed on collagen-containing extracellular matrices, intermediate filaments, and cell–cell junctions.
Biological processes were mainly related to epithelial tube morphogenesis and negative regulation of the Wnt signaling pathway. Molecular functions were mainly related to glycosaminoglycan binding, sulfur compound binding, and Wnt-protein binding (Figure 3A). GSEA indicated that the pathway enrichment of the treatment group was mainly related to chromosome segregation and the cell cycle process (Figure 3B), while the control group was associated with cornification, nuclear transcription, and intermediate filaments.
Figure 3.
(A) GO enrichment analysis of the DEGs. (B) GSEA of the breast cancer group and normal breast group.
Infiltrating Immune Cells
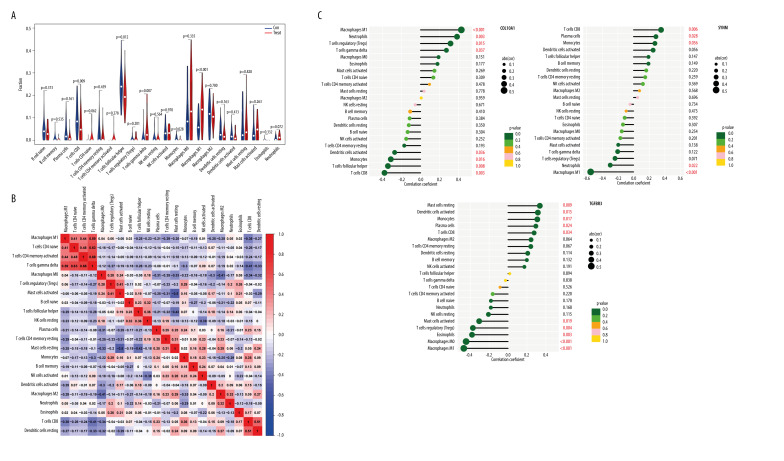
The volplot shows the distributions of immune cells in the control and treatment groups (Figure 4A), and the relationship between immune cells (Figure 4B). The results indicated that the proportions of CD8 T cells, gamma delta T cells, and M1 macrophages were significantly higher in breast cancer tissues, while the proportions of monocytes and follicular helper-T cells were significantly lower in breast cancer tissues. In addition, by further exploring the expression of these 3 key genes in immune cells, the results indicated that the downregulated genes, SYNM and TRGBF3, in the breast cancer tissues were positively correlated with CD8 T cells and monocytes, and negatively correlated with M1 macrophages; TGFBR3 was negatively correlated with M1 macrophages. Conversely, the upregulated gene in the breast cancer tissues, COL10A1, was positively correlated with gamma delta T cells and M1 macrophage, and negatively correlated with CD8 T cells, monocytes, and follicular helper-T cells. The relationship between the key genes and immune cells is shown in Figure 4C. The results suggested that the genes we selected were highly related to the level of immune cell infiltration, which is a critical component of the microenvironment.
Figure 4.
(A) Distribution of 22 immune cells in breast cancer tissues and normal breast tissues. (B) The relationship between 22 immune cells. (C) The relationship between 3 key genes and immune cells.
Relationships Between Key Genes and Overall Breast Cancer Survival
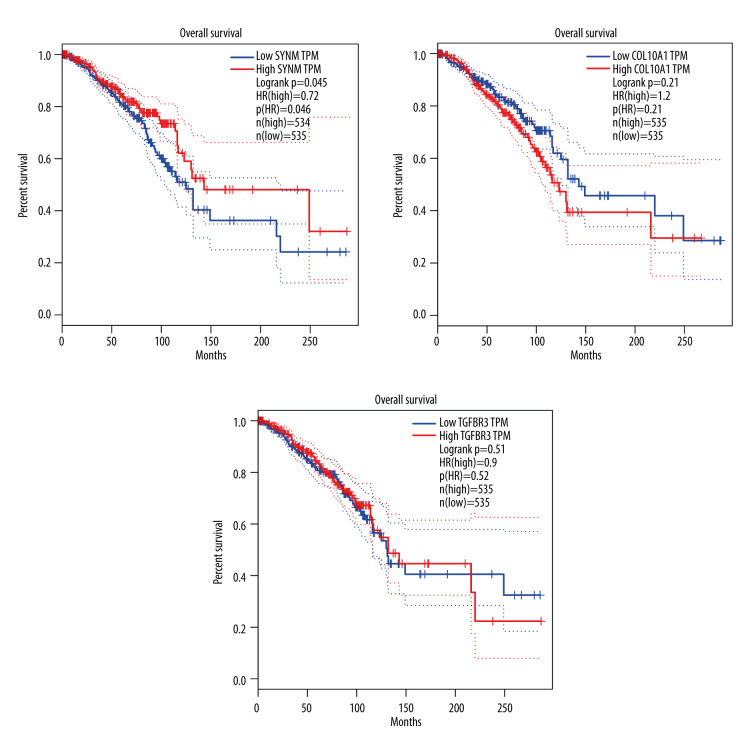
In our study, we explored the relationships between the expression levels of the 3 genes and the survival rate of breast cancer using Kaplan-Meier survival analysis through online GEPIA. Breast cancer patients were divided into 2 groups (high- and low-risk groups), and the results were visualized (Figure 5). The results indicated that low expression levels of SYNM were significantly related to poor prognosis in patients with breast cancer, indicating that they might act as tumor-suppressor genes. High expression levels of COL10A1 and low expression levels of TGFBR3 improved the prognosis of breast cancer, although the results were not significant.
Figure 5.
The overall survival (OS) associated with 3 key genes.
Discussion
In this study, we identified 32 DEGs in cancerous and normal breast tissues. By comparing the expression levels of DEGs between the control and treatment groups, GO analysis showed that the DEGs were related to the extracellular matrix (ECM), thus indicating that the tumor microenvironment (TME) plays a vital role in breast cancer. The ECM provides physical support for cells and affects cell adhesion and infiltration, and the immune status of the TME is an important factor that affects tumor progression. With different infiltrating immune cells or molecules, the TME has a differentiated effect on tumor progression, and through TME-targeted immunotherapy, tumor progression can be suppressed [9–12].
We found that the proportion of CD8 T cells, M1 macrophages M1, and gamma delta T cells were significantly higher in breast cancer tissues, while monocyte and follicular helper-T cell proportions were significantly lower. M1 macrophages and gamma delta T cells were positively correlated; however, they were negatively correlated with CD8 T cells, monocytes, and follicular helper-T cells. In addition, the proportion of M0 macrophages in breast cancer tissues was higher than that in normal tissues, although this difference was not significant. A previous study has suggested that tumor-associated macrophages (TAMs) are one of the largest components of inflammatory cells in the TME [13]. Macrophages can differentiate into different types of TAMs, M1, and M2 macrophages, which are affected by the TME cytokines. M1 macrophages kill tumor cells, whereas M2 macrophages promote tumor proliferation, angiogenesis, and metastasis. Studies have shown that the early stage of tumors is mainly M1-TAM, and the middle and late stages are mainly M2-TAM. Promoting the polarization of M2-TAM to M1-TAM can inhibit tumor development [14]. Generally, TAM is positively correlated with tumor development and metastasis, which indicates that TAM could be further explored in tumor immune therapy [15]. The results also suggest that the negative correlation of M1 macrophages with CD8 T cells has an anti-tumor effect. A recent study showed that patients with kidney cancer with CD8 T cell infiltration less than 2.2% are more likely to have a poor prognosis after surgery. This also indicates that CD8 T cells may have an effect on breast cancer prognosis [16].
Through GSEA, the results indicated that the treatment group was correlated with chromosome segregation and cell cycle, and the enrichment pathway was correlated with the downregulated DEGs in breast cancer tissues. Chromosome replication and segregation are essential steps of the cell cycle. Chromosomal instability (CIN) leads to uncontrolled division of cells into tumors. However, scholars have recently proven that if this erroneous segregation is extreme, it can lead to cell death – the mechanism by which paclitaxel kills tumor cells by enlarging the chromosome segregation errors of tumor cells, thus overturning previous views [17]. The results indicated that these downregulated DEGs enriched in chromosome segregation and cell cycle pathways could act as target genes for aiding the effect of paclitaxel.
Furthermore, using machine learning methods, we found that the 3 genes could be used to diagnose breast cancer. Among them, COL10A1 was upregulated and SYNM and TGFBR3 were both downregulated in breast cancer tissues. Furthermore, COL10A1 was positively correlated with M0 and M1 macrophages and gamma delta T cells, but was negatively correlated with CD8 T cells, monocytes, and follicular helper-T cells. A previous study illustrated that as a member of the collagen family, COL10A1 expression was higher in human breast cancer tissues than in normal human breast tissues; thus, COL10A1 overexpression could advance the proliferation, migration, and invasion of breast cancer cells, leading to poor prognosis. This is consistent with our findings, which indicate that COL10A1 is an oncogene in breast cancer and should be further explored as a target for cancer therapy [18]. Thus, we speculated that knocking out COL10A1 could be a novel method for treating breast cancer; however, there are still many problems to be solved in this field [19].
A previous study proved that type III TGF-β receptor (TGFBR3) inhibits tumor cell migration and invasion, and suppresses the development of antigen-specific immune responses through the TGF-β signaling pathway in the early stage of breast cancer in the TME [20]. SYNM acts as a type-IV intermediate filament that regulates cell adhesion and motility. GO analysis indicated that SYNM was mainly correlated with the morphology and functionality of myoepithelial cells, which play an important role in maintaining breast cell structure by regulating luminal cell growth and differentiation. We found that high expression levels of SYNM could improve the prognosis of breast cancer patients, and SYNM has been confirmed as a breast tumor-suppressor gene by real-time PCR analysis, through the regulation of cell adhesion and cell motility. Our study showed that TGFBR3 and SYNM were negatively correlated with TAM-M1 and TAM-M0, but positively correlated with TAM-M2. Therefore, we suspected that they could regulate the polarization of TAM. TGFβ2 has been shown to suppress T cell-mediated immunity by promoting Treg responses, and our results indicated that low TGFBR3 expression could regulate the specific immunity in the breast TME, making it a promising biomarker for breast cancer drug treatment [21,22].
Overall, an important future direction for breast cancer treatment is exact targeted therapy. Our study identified DEGs related to breast cancer through bioinformatics methods and found 3 diagnostic genes using machine learning methods, and further explored their mechanisms and pathways. The results will hopefully serve as useful information for breast cancer diagnosis and therapy.
Conclusions
SYNM, TGFBR3, and COL10A1 can act as diagnostic breast cancer genes. Breast cancer is associated with ECM, the Wnt signaling pathway, and glycosaminoglycan binding. Chromosome segregation and cell cycle processes can also affect breast cancer. SYNM, TGFBR3, and COL10A1 may regulate TAM polarization and affect the development of breast cancer.
Footnotes
Conflict of interest: None declared
Declaration of Figures’ Authenticity
All figures submitted have been created by the authors, who confirm that the images are original with no duplication and have not been previously published in whole or in part.
Financial support: None declared
References
- 1.Soerjomataram I, Louwman MW, Ribot JG, et al. An overview of prognostic factors for long-term survivors of breast cancer. Breast Cancer Res Treat. 2008;107(3):309–30. doi: 10.1007/s10549-007-9556-1. [DOI] [PMC free article] [PubMed] [Google Scholar]
- 2.Ross JS, Linette GP, Stec J, et al. Breast cancer biomarkers and molecular medicine. Expert Rev Mol Diagn. 2003;3(5):573–85. doi: 10.1586/14737159.3.5.573. [DOI] [PubMed] [Google Scholar]
- 3.Fu-Jun L, Shao-Hua J, Xiao-Fang S. Differential proteomic analysis of pathway biomarkers in human breast cancer by integrated bioinformatics. Oncol Lett. 2012;4(5):1097–103. doi: 10.3892/ol.2012.881. [DOI] [PMC free article] [PubMed] [Google Scholar]
- 4.Jia R, Li Z, Liang W, et al. Identification of key genes unique to the luminal a and basal-like breast cancer subtypes via bioinformatic analysis. World J Surg Oncol. 2020;18(1):268. doi: 10.1186/s12957-020-02042-z. [DOI] [PMC free article] [PubMed] [Google Scholar]
- 5.Elmarakeby HA, Hwang J, Liu, et al. Biologically informed deep neural network for prostate cancer classification and discovery. Nature. 2021;598:348–52. doi: 10.1038/s41586-021-03922-4. [DOI] [PMC free article] [PubMed] [Google Scholar]
- 6.Wei J, Huang XJ, Huang Y, et al. Key immune-related gene ITGB2 as a prognostic signature for acute myeloid leukemia. Ann Transl Med. 2021;9(17):1386. doi: 10.21037/atm-21-3641. [DOI] [PMC free article] [PubMed] [Google Scholar]
- 7.Li Y, Dong W, Zhang P, et al. Comprehensive analysis of regulatory factors and immune-associated patterns to decipher common and BRCA1/2 mutation-type-specific critical regulation in breast cancer. Front Cell Dev Biol. 2021;9:750897. doi: 10.3389/fcell.2021.750897. [DOI] [PMC free article] [PubMed] [Google Scholar]
- 8.Guo L, Jing Y. Construction and identification of a novel 5-gene signature for predicting the prognosis in breast cancer. Front Med (Lausanne) 2021;8:669931. doi: 10.3389/fmed.2021.669931. [DOI] [PMC free article] [PubMed] [Google Scholar]
- 9.Ali HR, Chlon L, Pharoah PD, et al. Patterns of immune infiltration in breast cancer and their clinical implications: A gene-expression-based retrospective study. PLoS Med. 2016;13(12):e1002194. doi: 10.1371/journal.pmed.1002194. [DOI] [PMC free article] [PubMed] [Google Scholar]
- 10.Chen DS, Mellman I. Elements of cancer immunity and the cancer-immune set point. Nature. 2017;541(7637):321–30. doi: 10.1038/nature21349. [DOI] [PubMed] [Google Scholar]
- 11.Hanahan D, Coussens LM. Accessories to the crime: functions of cells recruited to the tumor microenvironment. Cancer Cell. 2012;21(3):309–22. doi: 10.1016/j.ccr.2012.02.022. [DOI] [PubMed] [Google Scholar]
- 12.Turley SJ, Cremasco V, Astarita JL. Immunological hallmarks of stromal cells in the tumour microenvironment. Nat Rev Immunol. 2015;15(11):669–82. doi: 10.1038/nri3902. [DOI] [PubMed] [Google Scholar]
- 13.Liu Y, Li L, Li Y, et al. Research progress on tumor-associated macrophages and inflammation in cervical cancer. Biomed Res Int. 2020;2020:6842963. doi: 10.1155/2020/6842963. [DOI] [PMC free article] [PubMed] [Google Scholar]
- 14.Zanganeh S, Hutter G, Spitler R, et al. Iron oxide nanoparticles inhibit tumour growth by inducing pro-inflammatory macrophage polarization in tumour tissues. Nat Nanotechnol. 2016;11(11):986–94. doi: 10.1038/nnano.2016.168. [DOI] [PMC free article] [PubMed] [Google Scholar]
- 15.Binnewies M, Abushawish M, Dash S, et al. Targeting trem2 on tumor associated macrophages enhances efficacious immunotherapy. Cell Rep. 2021;37(3):109844. doi: 10.1016/j.celrep.2021.109844. [DOI] [PubMed] [Google Scholar]
- 16.Jansen CS, Prokhnevska N, Master VA, et al. An intra-tumoral niche maintains and differentiates stem-like CD8 t cells. Nature. 2019;576(7787):1–6. doi: 10.1038/s41586-019-1836-5. [DOI] [PMC free article] [PubMed] [Google Scholar]
- 17.Scribano CM, Wan J, Esbona K, et al. Chromosomal instability sensitizes patient breast tumors to multipolar divisions induced by paclitaxel. Sci Transl Med. 2021;13(610):eabd4811. doi: 10.1126/scitranslmed.abd4811. [DOI] [PMC free article] [PubMed] [Google Scholar]
- 18.Zhang M, Chen H, Wang M, et al. Bioinformatics analysis of prognostic significance of COL10A1 in breast cancer. Biosci Rep. 2020;40(2):BSR20193286. doi: 10.1042/BSR20193286. [DOI] [PMC free article] [PubMed] [Google Scholar]
- 19.Petty AJ, Yang Y. Tumor-associated macrophages: Implications in cancer immunotherapy. Immunotherapy. 2017;9:289–302. doi: 10.2217/imt-2016-0135. [DOI] [PMC free article] [PubMed] [Google Scholar]
- 20.Dong M, How T, Kirkbride KC, et al. The type III TGF-β receptor suppresses breast cancer progression. J Clin Invest. 2007;117(1):206–17. doi: 10.1172/JCI29293. [DOI] [PMC free article] [PubMed] [Google Scholar]
- 21.Xiao Z, Hu L, Yang L, et al. TGFβ2 is a prognostic-related biomarker and correlated with immune infiltrates in gastric cancer. J Cell Mol Med. 2020;24:7151–62. doi: 10.1111/jcmm.15164. [DOI] [PMC free article] [PubMed] [Google Scholar]
- 22.Pekny M, Wilhelmsson U. Intermediate filaments. Springer; Boston, MA: 2006. Intermediate filaments in astrocytes in health and disease. [DOI] [Google Scholar]


