

Abstract
Community structure of bacterioplankton was studied during the major growth season for phytoplankton (April to October) in the epilimnion of a temperate eutrophic lake (Lake Plußsee, northern Germany) by using comparative 5S rRNA analysis. Estimates of the relative abundances of single taxonomic groups were made on the basis of the amounts of single 5S rRNA bands obtained after high-resolution electrophoresis of RNA directly from the bacterioplankton. Full-sequence analysis of single environmental 5S rRNAs enabled the identification of single taxonomic groups of bacteria. Comparison of partial 5S rRNA sequences allowed the detection of changes of single taxa over time. Overall, the whole bacterioplankton community showed two to eight abundant (>4% of the total 5S rRNA) taxa. A distinctive seasonal succession was observed in the taxonomic structure of this pelagic community. A rather-stable community structure, with seven to eight different taxonomic units, was observed beginning in April during the spring phytoplankton bloom. A strong reduction in this diversity occurred at the beginning of the clear-water phase (early May), when only two to four abundant taxa were observed, with one taxon dominating (up to 72% of the total 5S rRNA). The community structure during summer stagnation (June and July) was characterized by frequent changes of different dominating taxa. During late summer, a dinoflagellate bloom (Ceratium hirudinella) occurred, with Comamonas acidovorans (β-subclass of the class Proteobacteria) becoming the dominant bacterial species (average abundance of 43% of the total 5S rRNA). Finally, the seasonal dynamics of the community structure of bacterioplankton were compared with the abundances of other major groups of the aquatic food web, such as phyto- and zooplankton, revealing that strong grazing pressure by zooplankton can reduce microbial diversity substantially in pelagic environments.
One of the best-understood seasonal dynamics of natural communities is that of planktonic algae and metazoa during the course of the seasons in temperate lakes (43, 45). The mechanistic PEG (Plankton Ecology Group) model predicts the seasonal successions of phyto- and zooplankton in lakes along a trophic gradient (45). In contrast to the community structures of phyto- and zooplankton, very little is known about the community structure of bacterioplankton and its spatiotemporal dynamics (16, 46, 50). This gap in ecological knowledge exists because bacteria cannot be identified morphologically and because a generally accepted taxonomy of bacteria did not exist until relatively recently. The advent during the last decade of molecular methods for the taxonomy of bacteria has made possible a phylogenetically valid taxonomy of bacteria that allows the analysis of the taxonomic structures of natural microbial communities (35, 38, 55, 57). In the present study we examined the taxonomic structures of microbial communities in an attempt to determine quantitative species composition by molecular methods, i.e., to identify molecularly defined taxonomic units and to determine their abundances.
The universal basis of the molecular determination of the structure of microbial communities is the analysis of indicative macromolecules, generally rRNA, obtained directly from environmental samples and the comparison of these data with the results for pure cultures (23, 29, 54). The relative abundances of single taxonomic groups of bacteria can be estimated based on the amounts of single nucleic acids from the environment, in general 16S rRNA or 5S rRNA or their respective genes (1, 18, 48, 49). With partial or total sequence analysis of these rRNAs, an identification and phylogenetic taxonomy of the single bacterial groups is possible (52, 53, 57).
This molecular biological approach has revolutionized microbial ecology during the last decade and provided new insights into the structures of aquatic bacterial communities (13, 14, 31, 37, 41). The current scenario indicates a community for the marine as well as for the limnic pelagial environment of approximately 5 to 20 abundant (more than 1% of the total community) bacterial taxa (21, 31). Most of these studies were based on single discrete measurements in time and space. There are at least two reasons for this limitation as follows: (i) an analysis of the taxonomic structure of a single sample of a natural bacterial community by 16S rRNA cloning and sequencing is still laborious, and (ii) frequent, long-term sampling is very difficult at most marine stations. To circumvent both these problems, we used a community fingerprinting technique and a well-studied and easily accessible lake to investigate the seasonal dynamics of the community structure of bacterioplankton.
We chose to use 5S rRNA profiling and sequencing for community fingerprinting because this technique enables the immediate comparison of many samples and the quantitation of single taxa and has been successfully applied to the study of the community dynamics of lake bacterioplankton (17, 18, 20). We chose Lake Plußsee as an example of a freshwater ecosystem because we could obtain weekly samples during the whole growth season of the phytoplankton and because a large amount of physical, chemical, and biological background data is available for this lake (24, 32, 36). Our analysis of the 5S rRNA of bacterioplankton from the epilimnion of eutrophic Lake Plußsee showed a distinctive seasonal dynamic for the taxonomic structure of this community. A relatively diverse bacterioplankton was apparent during the spring phytoplankton bloom. With the beginning of the clear-water phase, this diversity was substantially reduced, with one species dominating in the most extreme case, with a relative abundance of 72% of the total 5S rRNA. To elucidate the ecological factors that regulate these changes in bacterioplankton, its community structure was compared with the abundances of phyto- and zooplankton.
MATERIALS AND METHODS
Sampling.
Water samples were collected weekly at a depth of 1 m from the central part of Lake Plußsee (Schleswig-Holstein, Germany; 54°10.0′N, 10°0.23′E) during April through October 1989 by using a 2.5-liter Ruttner sampler. Bacterioplankton were filtered onto a sandwich of a glass microfiber filter (type GF/F; diameter, 90 mm; Whatman Corp.) on top of a polycarbonate filter (0.2-μm pore size; Nuclepore Corp.) and stored frozen (−70°C) for later RNA analysis. Samples had been prefiltered through a 3-μm-pore-size polycarbonate filter (Nuclepore Corp.) to eliminate higher organisms.
Biological background parameters.
Biological background parameters, such as the total bacterial count, total heterotrophic nanoflagellate count, and total particulate chlorophyll a concentration, were measured by standard techniques; more details are given elsewhere (7).
LMW RNA profiles of bacterioplankton.
Low-molecular-weight (LMW) RNA analysis of bacterioplankton began with the extraction of the total RNA directly from the frozen sandwich consisting of the glass microfiber filter and the polycarbonate filter. This extraction consists of mechanical extraction with glass beads in a bead beater combined with chemical extraction by phenol and sodium dodecyl sulfate (SDS) (9, 18). In short, total environmental RNA was extracted from the sandwiches by using 4 g of 2- and 3-mm-diameter glass beads, a high-speed cell disrupter (Microdismembrator; Braun-Diessel Corp.) with a Teflon extraction cell, and a mixture of 5 ml of RNA extraction buffer and 5 ml of buffer-saturated phenol (19). Extraction buffer consisted of 50 mM sodium acetate, 10 mM EDTA, and 1% SDS at a pH of 4.5. Phenol was saturated with that buffer lacking the 1% SDS. A thin slurry of the two filters and the extraction mixture was generated by vibration for 2 min with the cell disrupter. This slurry was then centrifuged for 10 min at 8,500 × g. After repeated phenol extraction of the pellet, the supernatants were pooled and treated twice with 5 ml of chloroform. Total RNA was precipitated from the last supernatant by the addition of ethanol (2.5 times the volume of the supernatant) and storage at −20°C overnight.
The total RNA obtained from the filter extraction was 3′ end labeled with cytidine 3′,5′-[5′-32P]bisphosphate by using RNA ligase (11). The radioactively labeled RNA was subjected to denaturing high-resolution electrophoresis on a 10% polyacrylamide gel (Sequicel; Bio-Rad Corp.) (gel size, 0.4 mm by 38 cm by 80 cm; running condition, stepwise increase over 5 h from 100 to 300 W). After electrophoresis, the gel was exposed to X-ray film or a storage phosphor screen (Molecular Probes Corp.) for 30 min to several hours. More details on RNA extraction and electrophoretic analysis are given elsewhere (9, 18, 19, 22).
The 5S rRNA fraction was evaluated quantitatively by scanning the autoradiograms with an optical gel scanner (Hirschmann Corp.) or by using a PhosphorImager (Molecular Probes Corp.). In this way, the abundances of single 5S rRNA bands were quantified in terms of baseline-corrected peak areas or numbers of pixels per band, respectively. These arbitrary units were used to calculate the relative abundance of each 5S rRNA band with respect to its contribution to the total amount of 5S rRNA.
The diversity of the community is described in two ways as follows: first, simply as the number of 5S rRNA bands per sample and second, by the Shannon diversity index, H. H was calculated according to equation 1:
 |
1 |
where ni is the relative abundance of a single taxon (a single 5S RNA band), N is the total abundance of all taxa, and S is the total number of abundant species. Only bands that contributed more than 4% of the total amount of 5S rRNA were included in the calculation of the diversity index and the total number of bands. This 4% threshold is not based on the detection limit of the 5S rRNA analysis, which is below 0.1% but, rather, was set arbitrarily for abundant taxa to make data analysis more comprehensive. By using this threshold, we were able to compare each successive sample for the diversity of its bacterioplankton community.
Sequence analysis of single environmental 5S rRNA.
After high-resolution electrophoresis, 32P-labeled 5S rRNA bands were excised from the gel, eluted with 150 μl of elution buffer (0.5 M sodium acetate, 0.1% SDS, 1 mM magnesium chloride, and 100 μM EDTA at pH 7.8), and ethanol precipitated at −20°C overnight. Before being applied to the sequencing gel, 5S rRNA was enzymatically digested with base-specific RNases (10, 18). The cleaved 5S rRNA of a single excised band was run on a high-resolution sequencing gel (size, 80 by 40 cm, 0.4 mm thick; 10% acrylamide) (LongRanger; FMC Corp.) prepared according to the protocol of the manufacturer to determine the positions of the bases relative to totally hydrolyzed 5S rRNA of Escherichia coli, the molecular size marker. This sequencing gel provided information about the positions of almost all bases of the 5S rRNA from the 5′ end. Only around 2% of the molecule, i.e., two to three nucleotides at the 3′ end, could not be read. Comparison of these sequences may lead finally to the classification or identification of the taxon represented by a single band, provided the reference sequence of a known bacterial species is available in the 5S rRNA sequence database (47). Also, this sequence information was used to determine the homogeneity of the band, i.e., if a band consists of one taxon or more than one. Furthermore, it allows the comparison of 5S rRNA bands with the same number of nucleotides across samples from different times of the season. These relative comparisons were also possible with partial sequences; e.g., RNase T1 was used to compare the positions of all guanine residues within a 5S rRNA of a specific size.
Nucleotide sequence accession numbers.
5S rRNA sequences of the reference strains given in Fig. 7 were submitted to the EMBL database under accession no. AJ 131583 to AJ 131602.
FIG. 7.

Phylogenetic position of the C. acidovorans 5S rRNA sequence, identical to the sequence obtained from the 116-nt bands of bacterioplankton from Lake Plußsee, within the β subclass of the class Proteobacteria. The phylogenetic tree is based on comparison of full-length 5S rRNA sequences of the reference strains indicated, by using the Jukes and Cantor algorithm and Thiobacillus thioparus as the outgroup. Species names in capital letters represent sequences from the 5S rRNA sequence database (11a). Species names in italics represent 5S rRNA sequences that were generated by us and were submitted to the EMBL database under the accession numbers provided in Materials and Methods.
RESULTS
Assessment of the overall community structure by 5S rRNA community fingerprinting.
The basic aim of this study was to understand the seasonal dynamics of the quantitative taxonomic structure of a natural microbial community, i.e., to assess relative changes in the composition of the community at the species and genus levels. To this end, total RNA from bacterioplankton sampled weekly from the epilimnion of Lake Plußsee was analyzed for its LMW RNA profiles on a high-resolution polyacrylamide gel (Fig. 1). Quantitative analysis of these LMW RNA profiles concentrated on the 5S rRNA range of the profile, because in complex natural communities tRNA patterns can be used for the quantification of the community structure only in rare cases when a single taxon dominates the community (18). The detected 5S rRNA bands, ranging from 108 to 123 nucleotides (nt) in size, were compared by using a gel scanner (Fig. 2). In the four April samples, the gel scans indicated a rather high degree of similarity in terms of the number of bands and the intensity of the single peaks (Fig. 2A), whereas in the four September samples the banding pattern changed substantially from week to week (Fig. 2B). Also, fewer bands were observed in September than in April (four to five compared to seven to eight abundant 5S rRNA bands). Furthermore, in the beginning of September, the 116-nt band was most abundant, with 43% of the total 5S rRNA. The intensity of the 116-nt band decreased steadily during the course of September, so that by the end of September the 123-nt size band was the most abundant 5S rRNA band (31%).
FIG. 1.

High-resolution gel electrophoresis of the LMW RNA fraction obtained directly from bacterioplankton at a depth of 1 m from Lake Plußsee in 1989. Bands were detected by autoradiography after 3′-end labeling of the RNA with 32P. The black arrow indicates a major decrease in the number of 5S rRNA bands at the end of the spring phytoplankton bloom.
FIG. 2.

Comparison of selected gel scans from the autoradiogram of environmental 5S rRNA shown in Fig. 1 from samples drawn in April (A) and September (B). The numbers of nucleotides were determined from the molecular weight markers in Fig. 1. OD, optical density.
The relative abundances of all abundant 5S rRNA bands are given in Fig. 3. For purposes of comparability and presentability, bands comprising more than 4% of the total 5S rRNA were considered abundant. These abundant 5S rRNA bands comprised 84 to 102% of the total 5S rRNA, with an average of 96% during the whole study period, and allowed quantitative comparison of the banding patterns. In addition to the shifts in prominent bands on a monthly scale, as e.g., during September (Fig. 2B), substantial changes in the banding pattern as a whole were observed toward the end of the spring phytoplankton bloom. By 8 May, all the bands above 118 nt had disappeared, and the first four samples drawn in May were dominated (43 to 72%) by the 118-nt 5S rRNA band (dark blue areas in Fig. 3). By the end of May, the upper bands (123 to 119 nt) had reappeared, but never as completely as before their disappearance in early May. For the rest of the year, the bands ranged in size from 116 to 123 nt, with various bands dominating; the bands never became as uniformly abundant as they were during the spring phytoplankton bloom.
FIG. 3.

Relative amounts of single 5S rRNA bands compared with the total amount of 5S rRNA as quantified by gel scanning and PhosphorImaging from the gel shown in Fig. 1. Only bands with a relative abundance higher than 4% are shown. Different colors indicate the different size classes of the individual 5S rRNA bands.
The number of abundant bands, ranging from two to eight, was compared with the Shannon index calculated according to equation 1 as a measure of overall community diversity (Fig. 4). The number of abundant bands seemed to be quite consistent with the Shannon index, indicating that the number of bands of a 5S rRNA community fingerprint is a first and obvious measure of the community’s diversity.
FIG. 4.

Comparison of the total number of abundant 5S rRNA bands (>4% of the total 5S rRNA) of the bacterioplankton (open squares), its Shannon index H (filled triangles), and chlorophyll a (filled diamonds) concentration of samples from Lake Plußsee collected at a depth of 1 m in 1989. Arrows indicate the three minima of diversity on 17 May, 19 June, and 21 August.
Three major decreases in diversity were observed during the course of the season (Fig. 4) as follows: (i) on 17 May, with only two abundant bands (H = 0.26), (ii) on 19 June, with three abundant bands (H = 0.40), and (iii) on 21 August, with two abundant bands (H = 0.27). The first decrease occurred at the end of the spring phytoplankton bloom, during which overall diversity was high and constant. This decrease lasted for about 2 weeks and coincided with the so-called clear-water phase of the lake, when the grazing pressure of macrozooplankton, primarily cladocerans, reached a maximum and eliminated most of the particulate organic matter in the lake (44). This first decrease in diversity was followed by a strong increase in diversity and then by a continuous decrease that ended in the second minimum of diversity on the 19 June. Afterwards, a month of high diversity followed that subsequently changed to a steady decline to the third minimum in diversity on 24 August. This last minimum occurred between the two chlorophyll a maxima of the late-summer phytoplankton bloom, more than 95% of which was the dinoflagellate Ceratium hirudinella (44). After this last minimum, the diversity increased to medium levels and remained at medium to high levels until the end of the phytoplankton growth season.
Abundance and identification of single taxa.
It is apparent from Fig. 3 that the 116-nt and the 118-nt 5S rRNA bands (the yellow and the dark blue areas, respectively) were the most-abundant single 5S rRNA bands during the time studied. Both bands together comprised 88% of the total 5S rRNA of the first diversity minimum in May and contributed approximately 50% or more to the total 5S rRNA of the two other minima, whereby the 118-nt band contributed 46% to the second minimum and the 116-nt band contributed 70% to the third minimum. The ranges of abundance of the two bands were comparable, being 5 to 70% for the 116-nt band and 0 to 72% for the 118-nt band (Fig. 5). The sum of the two bands often accounted for more than 80% of the total 5S rRNA, with an average of 53% during the whole study period (Fig. 5B). The 116-nt band never dropped below the threshold for abundant bands, in contrast to the 118-nt band, which fell below the threshold twice (12 June and 21 August). The increase of the 116-nt band from July 17th by a factor of about four over a 2-week period corresponded well to the increase in chlorophyll a during the late-summer dinoflagellate bloom (Fig. 5A). The relative abundance of this band remained high throughout this late-summer phytoplankton bloom (mean abundance, 43%) and reached a maximum (70%) level during the mid-bloom minimum.
FIG. 5.

Relative abundance of major single 5S rRNA bands of the bacterioplankton during different seasons compared to total chlorophyll a concentration as an indicator of algal biomass. (A) Chlorophyll a concentration (filled diamonds) and relative abundance of the 116-nt 5S rRNA band (open squares). (B) Relative abundance of the 118-nt 5S rRNA band (open squares) and relative abundance of both the 116- and 118-nt 5S rRNA bands (filled triangles).
For an ecological interpretation of these very abundant 5S rRNA bands, it is important to know whether they are homogeneous, i.e., whether they have identical sequences at different sampling times. The homogeneity of single 5S rRNA bands was checked by comparison of their partial sequences as shown in Fig. 6. From these results, it is apparent that the 116-nt band was homogeneous most of the time, except for samples from 22 May, 24 June, and 24 October, that contained additional guanidine residues as well as the consensus sequence. These extra G bands all looked alike, indicating that they represent the same taxon and relate to the lake isolate used as the reference marker (Fig. 6, lane 1).
FIG. 6.
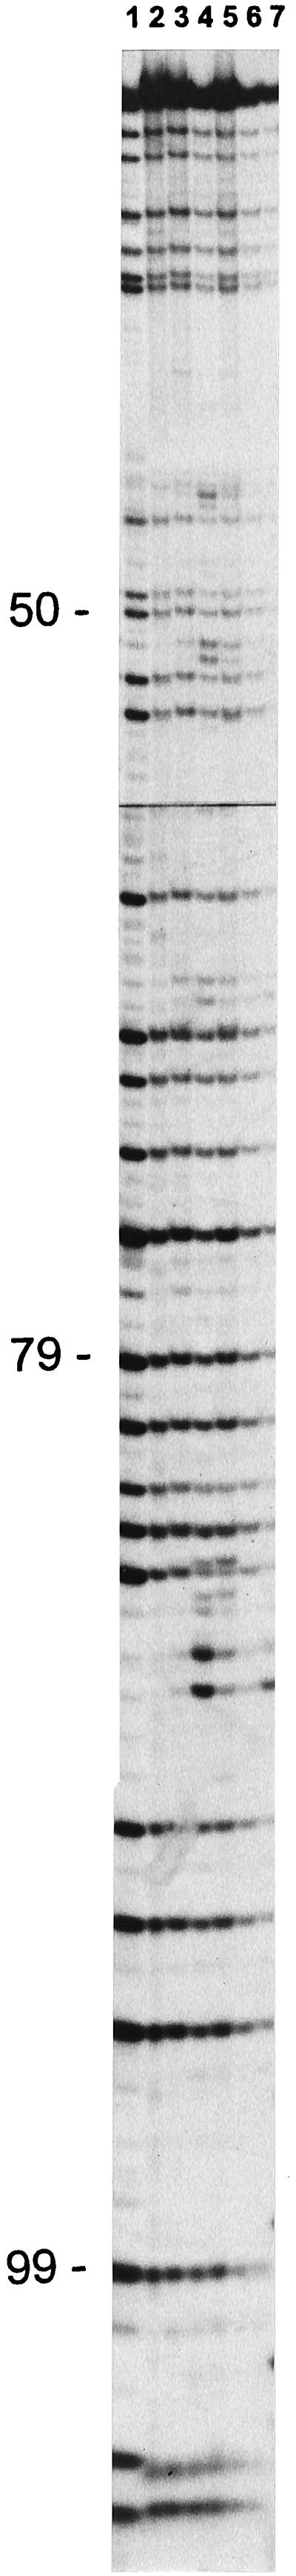
Partial sequences of 5S rRNA bands of 116 nt obtained after RNase T1 digestion. Sources of the 5S rRNA are as follows: isolate C. acidovorans PX54 (lane 1) and bacterioplankton from Lake Plußsee from 10 April (lane 2), 2 May (lane 3), 22 May (lane 4), 24 June (lane 5), 2 October (lane 6), and 24 October (lane 7). Numbers along the left side of the gel indicate the positions of the G in relation to the 5′ end of the 5S rRNA sequence.
Identification of single environmental 5S rRNA bands is possible if corresponding sequences are found in the international 5S rRNA sequence database (47) or in isolates from the same habitat. We were able to show the 116-nt bands had a 5S rRNA sequence that was identical with Comamonas acidovorans PX54, an isolate obtained from Lake Plußsee and identified by 16S rRNA sequence analysis and LMW RNA fingerprinting (12). Of about 500 heterotrophic bacterial strains isolated on agar media, this was the only isolate we obtained from Lake Plußsee with a 116-nt size 5S rRNA. All these isolates were obtained during the seasonal study and from a set of mesocosm experiments, and their genotypes were screened by LMW RNA fingerprinting (18, 19). The second major 5S rRNA band, with a size of 118 nt, could not be identified due to the limited unambiguous sequence information obtained, which did not allow the inference of the closest phylogenetic neighbor by using the reference sequences from the international database.
For a better understanding of the taxonomic resolution of 5S rRNA sequence analysis, we sequenced another 20 reference strains from the β subclass of the class Proteobacteria that were known from their 16S rRNA sequence analysis to be in the phylogenetic vicinity of C. acidovorans (Fig. 7). The 5S rRNA sequence of C. acidovorans was identical to the sequences of Comomonas testosteroni, Acidovorax temperans, and Acidovorax facilis but different from those of Acidovorax delafieldii and Comamonas terrigena (Fig. 7). All other β-subclass genera sequenced, such as Hydrogenophaga, Alcaligenes, Burkholderia, and Ralstonia, were well separated from C. acidovorans, and all species of these genera except for Hydrogenophaga taeniospiralis and Hydrogenophaga palleronii differed by more than 1 nt. We will use the name C. acidovorans for the taxonomic identification of the 116-nt band, both for simplicity’s sake and because this species (and no other genus of the β subclass of the class Proteobacteria) was the only one we were able to isolate from Lake Plußsee with a 5S rRNA of 116 nt.
Ecosystematic factors regulating community structure.
The bacterioplankton community is an integrated part of the aquatic food web, and its abundance is controlled by the grazing of protozoa and/or metazoa (control from the top down) and by the supply of dissolved organic carbon (DOC) from algae (control from the bottom up) according to the microbial loop paradigm (2). Because of the tight association between bacterial numbers and the numbers of heterotrophic nanoflagellates (HNFs) in freshwater ecosystems, the abundance of HNFs represents a good estimate of protozoan grazing pressure (4). During the first 3 months of the study, the abundances of bacteria and HNFs were measured and are depicted in relation to chlorophyll a (Fig. 8). During the spring phytoplankton bloom, these data were as expected; i.e., the phytoplankton (chlorophyll a) maximum was accompanied by the bacterioplankton maximum, followed by the HNF maximum, which induced a reduction of the bacteria the following week (2 May). A comparison of this situation with the bacterioplankton community structure indicates that at the highest HNF grazing pressure (24 April), the bacterioplankton still had a high diversity (Fig. 1 and 3). The first significant decrease in diversity was observed on 2 May, when bacterial numbers reached a first minimum due to HNF grazing. The following week (10 May), bacterial numbers recovered, grazing pressure by HNFs remained high, and community diversity was already substantially reduced. On 17 May, the first diversity minimum was reached, accompanied by a strong reduction in the numbers of HNF and algae (compare Fig. 3, 4, and 8). This decrease was followed the next week by a reduction in bacterial numbers. By this time (22 May), the lake had reached its maximum transparency and entered the clear-water phase (28).
FIG. 8.

Seasonal dynamics of total bacterial numbers (filled circles), numbers of HNFs (open triangles), and chlorophyll a concentrations (filled diamonds) from samples of Lake Plußsee collected at a depth of 1 m in 1989.
DISCUSSION
Seasonal dynamics of the community structure of lake bacterioplankton.
During this seasonal study, we observed changes in the overall community structure of bacterioplankton, i.e., diversity of the community as indicated by the number of abundant 5S rRNA bands or the Shannon index, as well as changes in the abundances of individual taxonomic groups (Fig. 4 and 5). The diversity of the bacterioplankton was reduced on three occasions during the growth season of the phytoplankton by a factor of 3 to 4 in the number of abundant bands or the Shannon index, leading in two cases to the absolute dominance (>50%) of a single 5S rRNA. We think the number of abundant bands provides a good first estimate of the diversity of the bacterioplankton if diversity is defined as the total number of species in a given sample (26). This definition of diversity stems from the ecology of plants and animals, in which a complete inventory of an environmental sample is, in principle, always feasible. For the application of this definition in the microbial world, the following two prerequisites must be met: a lower detection of the abundance of a taxonomic unit should be set, and (ii) taxonomic units such as species must be defined operationally. A lower limit for the abundance of a taxonomic unit is quite reasonable, considering that the number of bacterial cells per liter of water from Lake Plußsee is on the order of several billion. As stated earlier, abundant species were defined as those with a relative abundance of 4%, i.e., 80 to 600 million bacterial cells per liter of water from Lake Plußsee. All other taxa were considered less-abundant members of the bacterioplankton community and were not addressed in this study. We have operationally defined the taxonomic unit as a single 5S rRNA band with a homogenous sequence. This definition is rather simple and arbitrary, considering the amount of literature about the problem of defining taxonomic units, such as species and genera, in bacteriology (for a review, see reference 52), but we think that for the analysis of environmental microbial communities, a defined rRNA sequence obtained from the environment with no amplification is a good basic operational taxonomic unit (OTU).
Two technical aspects of considering a homogenous 5S rRNA band as an OTU must be discussed: (i) the efficiency of extracting RNA from natural bacterioplankton and (ii) the efficiency of labeling 5S rRNA bands of different taxonomic groups by 3′-end labeling with 32P. We tested the extraction procedure with a set of reference bacteria and demonstrated that gram-negative bacteria do not vary by more than a factor of 2.5 in terms of total RNA extraction efficiency (9). Additionally, we showed by thin sectioning and electron microscopy that the bacterioplankton of Lake Plußsee contained a negligible amount of gram-positive cells, i.e., far less than 1% (8). Also, 32P-labeling efficiency of 5S rRNA was tested for a variety of different taxonomic groups and demonstrated to be, on average, more than 60% of an E. coli standard (8). These methodological analyses, together with the fact that the described procedure is based on the direct analyses of environmental 5S rRNA with no further molecular amplification steps, make us confident of the accuracy of our quantitative determination of the amounts of single 5S rRNA bands. Since the 5S rRNA represents a constant fraction of the rRNA, single 5S rRNA bands are a reliable measure of the relative abundances of different rRNAs from bacterioplankton. The amount of rRNA can be considered a good measure for the active members of the bacterioplankton community, since the amount of rRNA is well correlated with the growth rate of bacteria (6).
Along with the relative abundances of single rRNAs, the Shannon index, considered a global measure of biological diversity, can be calculated because the only measurement it requires is the determination of the relative abundance of all taxa in a given habitat or sample (26). The Shannon index H reflects the information content of a community, meaning that the larger the value, the greater the probability that a given species will not be encountered within a sample. The Shannon index is rather insensitive to minor components of the community and is determined primarily by a community’s major components. Therefore, we think this index is a better estimate of diversity than simply the estimation of the number of bands and that it makes molecular data comparable with the diversity of other microbiota, such as microalgae, obtained by conventional cell counts. The composition of the phytoplankton of Lake Plußsee in 1989 was studied by Sommer (44), and its Shannon indices were calculated (28). During its spring bloom, the phytoplankton community showed a high and constant diversity (H = 2) that dropped by a factor of two during the clear-water phase. After the clear-water phase, phytoplankton diversity increased to a second maximum that was reached by mid-June. From that point on, diversity declined continuously until mid-August, when H was very low (H = 0.1 to 0.2) because the dinoflagellate C. hirudinella completely dominated the phytoplankton. Phytoplankton diversity remained low for about a month and rose at the end of the phytoplankton bloom, reaching by mid-October values as high as those in spring. In comparison, bacterioplankton diversity had the same two minima, i.e., during the clear-water phase and in the late-summer phytoplankton bloom. A much stronger reduction in diversity was noticed for bacterioplankton during the clear-water phase than for phytoplankton, as indicated by a fourfold reduction of H for bacterioplankton compared to a reduction of only twofold for phytoplankton. Also, the late-summer diversity minimum lasted much longer for phytoplankton (about 2 months) than for bacterioplankton (2 weeks). The most obvious discrepancy occurred in mid-June, when bacterioplankton diversity was relatively low and phytoplankton diversity was high. In summary, seasonal events, such as grazing by cladocerans during the clear-water phase, can influence phytoplankton and bacterioplankton community structure in the same manner. On the other hand, no close correlation between phytoplankton and bacterioplankton community structures was apparent during the whole growth season of the phytoplankton, as indicated by several opposing trends.
Also apparent from the comparison of the community structure of phytoplankton with that of bacterioplankton was the fact that the changes in the bacterioplankton community structure occurred rather rapidly and never lasted longer than 4 weeks, whereas the changes in the overall diversity of the phytoplankton occurred over a much longer period, i.e., up to 3 months. These different time scales could be due to the lower growth rates of algae compared with those of heterotrophic bacteria. Another reason for these differences could be that phytoplankton growth is more dependent on physical factors, such as light, that do not fluctuate as rapidly as the supply of organic nutrients that drives the growth of bacterioplankton.
The dominance of individual bacterial taxa at certain times was the most interesting finding in this seasonal study, concurring with the minima found in the overall community structure of bacterioplankton. This dominance of individual taxa is a logical consequence of reduced overall diversity and can best be illustrated by the C. acidovorans-like 116-nt 5S rRNA band (Fig. 5). The seasonal dynamic of this taxon of β-subclass of the class Proteobacteria was characterized by two peaks (22 May and 19 June) of a relative abundance of around 30% and a plateau of high abundance during the C. hirudinella bloom from 24 July to 18 September, averaging an abundance of 43%, with a peak of 70% (21 August). The same late-summer maximum was detected very recently for the β subclass of the class Proteobacteria by Pernthaler et al. (39) in an oligotrophic high alpine lake by using fluorescently labeled 16S rRNA-targeted oligonucleotides specific for the whole β subclass. The first two maxima of the 116-nt band occurred at or 1 week after the minima of overall diversity, when a strong grazing pressure from higher trophic levels was exerted. The competitive advantage of Lake Plußsee isolate C. acidovorans PX54 at high grazing pressure was demonstrated recently in a set of chemostat experiments and could explain the first two maxima of this taxon in Lake Plußsee (15). The long phase of high abundance in late summer could be explained by the good growth of isolate PX54 on refractory DOC fractions and its general life strategy as a K strategist, as shown recently (56). These traits, explaining the success of C. acidovorans, could also help elucidate the general importance of the β subclass of the class Proteobacteria for freshwater ecosystems as opposed to marine ecosystems that was emphasized recently (30).
Regulatory factors of the community structure of lake bacterioplankton.
Seasonal cycles in temperate lakes, such as Lake Plußsee, are driven by the basic physical parameters of light, temperature, and wind. These physical factors control the dynamics of all biota via nutrient upwelling and primary production. The primary producers in lakes are normally microalgae that are connected by a microbial loop with bacterioplankton and grazing proto- or metazoa (2). The microbial loop as we presently understand it provides three regulatory factors for growth and abundance of bacterioplankton, as follows: (i) the dissolved organic matter (DOM) produced by microalgae, (ii) the grazing pressure exerted by zooplankton (HNFs and macrozooplankton), and (iii) viral lysis induced by phages or prophages (40, 42, 51). In the epilimnic part of the water column of Lake Plußsee, viral lysis was of minor relevance for the mortality of bacterioplankton, as demonstrated recently by Weinbauer and Höfle (56). In contrast to viral lysis, grazing by HNFs accounted for 80 to 100% of the mortality of bacterioplankton in the upper epilimnion (56). But even the high grazing pressure of the HNFs during the spring phytoplankton bloom did not reduce the overall diversity of the bacterioplankton (compare Fig. 4 and 8).
The situation changed when the lake approached the clear-water phase. This event is a well-known limnological phenomenon in temperate lakes and is caused by the enormous grazing pressure of filter-feeding macrozoplankton, such as cladocerans, on all particles larger than 0.2 μm in diameter (27). The cladoceran population in Lake Plußsee takes about 2 weeks to reach a grazing pressure that is high enough to clear the lake completely (3, 25). Therefore, there was a certain overlap in terms of the grazing pressure exerted by the HNFs and the cladocerans before the first diversity minimum of bacterioplankton on 17 May (compare Fig. 4 and 8). The high grazing pressure of the HNFs ended when the HNFs became grazed down by the cladocerans, as on 17 May (Fig. 8). The continued low diversity on 22 May indicates that the grazing pressure from the cladocerans had a stronger effect on the diversity of the bacterioplankton community than the grazing pressure of the HNFs. Therefore, only if the nonselective and enormous grazing pressure of the cladocerans was considered in conjunction with that of the HNFs was the overall diversity of bacterioplankton substantially reduced. It seems that during this phase, only a few taxa can withstand the huge grazing pressure, most likely by very high growth rates. High growth rates of these taxa could be supported by the significant increase in dissolved free amino acids (DFAA) or other easily available organic substrates observed during the clear-water phase due to the excretion and sloppy feeding of zooplankton (34).
DOM, the other major regulatory factor of bacterial growth, has a significant seasonal cycle in Lake Plußsee but is a very complex parameter if not only the total DOC but also detailed organic compounds, such as amino acids and carbohydrates, are considered (33). DOM or, in a narrower sense, DOC can be divided in terms of its usefulness as a microbial substrate into two categories, easily available and recalcitrant. Whereas the easily available substrates can be chemically defined reasonably well as DFAA, dissolved free carbohydrates (DFCHO) and dissolved fatty acids, the recalcitrant substrates, usually representing the bulk of the DOC, are chemically very difficult to define and comprise mainly polyphenols and humic compounds of higher molecular weight. Even for DFAA and DFCHO, however, only general seasonal trends are known, such as higher values in spring, late summer, and fall (33). Therefore, we can only speculate that the diverse spring phytoplankton bloom releases more different substrates that provide increased niches for the more diverse bacterioplankton observed than does the phytoplankton bloom of a single alga in late summer. To understand the control of the diversity of microbial communities from the bottom up, more studies on the chemistry of the same samples are necessary and new experimental approaches are needed. Such a new approach could be the incorporation of specifically labeled substrates into biomarkers as demonstrated recently for 13C-labeled acetate into fatty acids of natural sediment communities (5). Therefore, a combination of molecular biological and organic chemical approaches might help unravel the major driving forces behind the seasonal successions of microbial communities and the competition among its individual bacterial components.
ACKNOWLEDGMENTS
We thank C. Krambeck and D. Albrecht for providing background data, I. Fritz for the calculation of the 5S rRNA tree, and M. G. Weinbauer for valuable discussions.
This project was supported by funds from Bundesministerium für Bildung, Wissenschaft, Forschung und Technologie grant BEO-0319433B and Deutsche Forschungsgemeinschaft grant Ho 930/2-1.
REFERENCES
- 1.Amann R, Ludwig W, Schleifer K H. Phylogenetic identification and in situ detection of individual microbial cells without cultivation. Microbiol Rev. 1995;59:145–169. doi: 10.1128/mr.59.1.143-169.1995. [DOI] [PMC free article] [PubMed] [Google Scholar]
- 2.Azam F, Fenchel T, Field J G, Gray J S, Meyer-Reil L A, Thingstad F. The ecological role of water-column microbes in the sea. Mar Ecol Prog Ser. 1983;10:257–263. [Google Scholar]
- 3.Bemmer A, Overbeck J. Zooplankton grazing on bacteria. In: Overbeck J, Chróst R J, editors. Microbial ecology of Lake Plußsee. New York, N.Y: Springer; 1994. pp. 229–250. [Google Scholar]
- 4.Berninger U-G, Finlay B J, Kuuppo-Leinikki P. Protozoan control of bacterial abundances in freshwater. Limol Oceanogr. 1991;36:139–147. [Google Scholar]
- 5.Boschker H T S, Nold S C, Wellsbury P, Bos D, de Graaf W, Pel R, Parkes R J, Cappenberg T E. Direct linking of microbial populations to specific biogeochemical processes by 13C-labelling of biomarkers. Nature (London) 1998;392:801–804. [Google Scholar]
- 6.Bremer H, Dennis H H. Modulation in chemical composition and other parameters of the cell by growth rate. In: Neidhardt F C, editor. Escherichia coli and Salmonella: cellular and molecular biology. 2nd ed. Vol. 2. Washington, D.C: ASM Press; 1996. pp. 1553–1569. [Google Scholar]
- 7.Brettar I, Höfle M G. Influence of ecosystematic factors on survival of Escherichia coli after large-scale release into lake water mesocosms. Appl Environ Microbiol. 1992;58:2201–2210. doi: 10.1128/aem.58.7.2201-2210.1992. [DOI] [PMC free article] [PubMed] [Google Scholar]
- 8.Dominik K. Vergleichende 5S rRNA-Analyse der zeitlichen und räumlichen Dynamik von Bakterioplankton aus dem Plußsee und anderen ostholsteinschen Seen. Ph.D. thesis. Braunschweig, Germany: Technical University; 1998. [Google Scholar]
- 9.Dominik K, Höfle M G. Extraction of total RNA from bacterioplankton. In: Akkermans A D L, van Elsas J D, de Bruijn F J, editors. Molecular microbial ecology manual. Dordrecht, The Netherlands: Kluwer Academic Publishers; 1998. pp. 1.2.2:1–9. [Google Scholar]
- 10.Donis-Keller H. Site specific enzymatic cleavage of RNA. Nucleic Acids Res. 1979;7:179–192. doi: 10.1093/nar/7.1.179. [DOI] [PMC free article] [PubMed] [Google Scholar]
- 11.England T E, Bruce A G, Uhlenbeck O C. Specific labeling of 3′ termini of RNA with T4 RNA ligase. Methods Enzymol. 1980;65:65–85. doi: 10.1016/s0076-6879(80)65011-3. [DOI] [PubMed] [Google Scholar]
- 11a.Erdmann, V. A. 1999. 5S rRNA sequence database [Online.] http://www.chemie.fu-berlin.de/fb_chemie/ibc/agerdmann/5S_rRNA.html.
- 12.Faude U, Höfle M G. Development and application of monoclonal antibodies for in-situ detection of indigenous bacterial strains in aquatic ecosystems. Appl Environ Microbiol. 1997;63:4534–4542. doi: 10.1128/aem.63.11.4534-4542.1997. [DOI] [PMC free article] [PubMed] [Google Scholar]
- 13.Fuhrman J A, McCallum K, Davis A A. Novel major archaebacterial group from marine plankton. Nature (London) 1992;356:148–149. doi: 10.1038/356148a0. [DOI] [PubMed] [Google Scholar]
- 14.Giovannoni S J, Britschgi T B, Moyer C L, Field G K. Genetic diversity in Sargasso Sea bacterioplankton. Nature (London) 1990;345:60–63. doi: 10.1038/345060a0. [DOI] [PubMed] [Google Scholar]
- 15.Hahn M W, Höfle M G. Grazing pressure by a bacteriovorous flagellate reverses the relative abundance of Comamonas acidovorans PX54 and Vibrio strain CB5 in chemostat cocultures. Appl Environ Microbiol. 1998;64:1910–1918. doi: 10.1128/aem.64.5.1910-1918.1998. [DOI] [PMC free article] [PubMed] [Google Scholar]
- 16.Hobbie J E. A comparison of the ecology of planktonic bacteria in fresh and salt water. Limnol Oceanogr. 1988;33:750–768. [Google Scholar]
- 17.Höfle M G. Estimation of the taxonomic structure of natural bacterial assemblages by low molecular RNA profiles. In: Hattori T, Ishida Y, Maruyama Y, Morita R Y, Uchida A, editors. Recent advances in microbial ecology. Tokyo, Japan: Japan Scientific Societies Press; 1989. pp. 692–696. [Google Scholar]
- 18.Höfle M G. Bacterioplankton community structure and dynamics after large-scale release of nonindigenous bacteria as revealed by low-molecular-weight-RNA analysis. Appl Environ Microbiol. 1992;58:3387–3394. doi: 10.1128/aem.58.10.3387-3394.1992. [DOI] [PMC free article] [PubMed] [Google Scholar]
- 19.Höfle M G. Genotyping of bacterial isolates from the environment using low-molecular-weight RNA fingerprints. In: Akkermans A D L, van Elsas J D, de Bruijn F J, editors. Molecular microbial ecology manual. Dordrecht, The Netherlands: Kluwer Academic Publishers; 1998. pp. 3.3.7:1–23. [Google Scholar]
- 20.Höfle M G. Direct detection of nutrient induced changes in the community structure of bacterioplankton using low-molecular-weight RNA analysis. Arch Hydrobiol Spec Issues Adv Limnol. 1999;54:199–211. [Google Scholar]
- 21.Höfle M G, Brettar I. Taxonomic diversity and metabolic activity of microbial communities in the water column of the central Baltic Sea. Limnol Oceanogr. 1995;40:868–874. [Google Scholar]
- 22.Höfle M G, Brettar I. Genotyping of heterotrophic bacteria from the central Baltic Sea by use of low-molecular-weight RNA profiles. Appl Environ Microbiol. 1996;62:1383–1390. doi: 10.1128/aem.62.4.1383-1390.1996. [DOI] [PMC free article] [PubMed] [Google Scholar]
- 23.Hugenholtz P, Pitulle C, Hershberger K L, Pace N R. Novel division level bacterial diversity in a Yellowstone hot spring. J Bacteriol. 1998;180:366–376. doi: 10.1128/jb.180.2.366-376.1998. [DOI] [PMC free article] [PubMed] [Google Scholar]
- 24.Krambeck H-J. Longterm monitoring and modelling of the nutrient cycle in a Baltic lake. Verh Int Verein Limnol. 1981;21:460–465. [Google Scholar]
- 25.Krambeck H-J, Albrecht D, Hickel B, Hofmann W, Arzbach H-H. Limnology of the Plußsee. In: Overbeck J, Chróst R J, editors. Microbial ecology of Lake Plußsee. New York, N.Y: Springer; 1994. pp. 1–23. [Google Scholar]
- 26.Krebs C J. Ecology: the experimental analysis of distribution and abundance. 4th ed. New York, N.Y: Harper Collins College Publishers; 1994. [Google Scholar]
- 27.Lampert W, Fleckner W, Rai H, Taylor B E. Phytoplankton control by grazing zooplankton: a study on the spring clearwater phase. Limnol Oceanogr. 1986;31:478–490. [Google Scholar]
- 28.Lampert W, Sommer U. Limnoökologie. Stuttgart, Germany: Georg Thieme Verlag; 1993. [Google Scholar]
- 29.Maidak B L, Olsen G J, Larsen N, Overbeek R, McCaughey M J, Woese C R. The RDP (Ribosomal Database Project) Nucleic Acids Res. 1997;25:109–110. doi: 10.1093/nar/25.1.109. [DOI] [PMC free article] [PubMed] [Google Scholar]
- 30.Methé B, Hiorns W D, Zehr J P. Contrasts between marine and freshwater bacterial community composition: analyses of communities in Lake George and six other Adirondack lakes. Limnol Oceanogr. 1998;43:368–374. [Google Scholar]
- 31.Mullins T D, Britschgi T B, Kerst R L, Giovannoni S J. Genetic comparisons reveal the same unknown bacterial lineages in Atlantic and Pacific bacterioplankton communities. Limnol Oceanogr. 1995;40:145–158. [Google Scholar]
- 32.Münster U. Arch. Hydrobiol. Suppl. 70:429–480. 1985. Investigations about structure, distribution and dynamics of different organic substrates in the DOM of Lake Plußsee. [Google Scholar]
- 33.Münster U. Concentrations and fluxes of organic carbon substrates in the aquatic environment. Antonie Leeuwenhoek. 1993;63:243–274. doi: 10.1007/BF00871222. [DOI] [PubMed] [Google Scholar]
- 34.Münster U, Albrecht D. Dissolved organic matter: analysis of composition and function by a molecular-biochemical approach. In: Overbeck J, Chróst R J, editors. Microbial ecology of Lake Plußsee. New York, N.Y: Springer; 1994. pp. 24–62. [Google Scholar]
- 35.Olsen G J, Lane D J, Giovannoni S J, Pace N R. Microbial ecology and evolution: a ribosomal RNA approach. Annu Rev Microbiol. 1986;40:337–365. doi: 10.1146/annurev.mi.40.100186.002005. [DOI] [PubMed] [Google Scholar]
- 36.Overbeck J, Chróst R J, editors. Microbial ecology of Lake Plußsee. New York, N.Y: Springer; 1994. [Google Scholar]
- 37.Øvreås L, Forney L, Daae L F L, Torsvik V. Distribution of bacterioplankton in meromictic lake Sælenvannet, as determined by denaturing gradient gel electrophoresis of PCR-amplified gene fragments coding for 16S rRNA. Appl Environ Microbiol. 1997;63:3367–3373. doi: 10.1128/aem.63.9.3367-3373.1997. [DOI] [PMC free article] [PubMed] [Google Scholar]
- 38.Pace N R, Stahl D A, Lane D J, Olsen G J. The analysis of natural microbial populations by ribosomal RNA sequences. Adv Microb Ecol. 1986;8:1–55. [Google Scholar]
- 39.Pernthaler J, Glöckner F-O, Unterholzner S, Alfreider A, Psenner R, Amann R. Seasonal community and population dynamics of pelagic bacteria and archaea in a high mountain lake. Appl Environ Microbiol. 1998;64:4299–4306. doi: 10.1128/aem.64.11.4299-4306.1998. [DOI] [PMC free article] [PubMed] [Google Scholar]
- 40.Pomeroy L R, Wiebe W J. Energetics of microbial food webs. Hydrobiologia. 1988;159:7–18. [Google Scholar]
- 41.Schmidt T M, DeLong E F, Pace N R. Analysis of a marine picoplankton community by 16S rRNA gene cloning and sequencing. J Bacteriol. 1991;173:4731–4378. doi: 10.1128/jb.173.14.4371-4378.1991. [DOI] [PMC free article] [PubMed] [Google Scholar]
- 42.Sherr E, Sherr B. Role of microbes in pelagic food webs: a revised concept. Limnol Oceanogr. 1988;33:1225–1227. [Google Scholar]
- 43.Sommer U, editor. Plankton ecology: succession in plankton communities. Berlin, Germany: Springer-Verlag; 1989. [Google Scholar]
- 44.Sommer U. Phytoplankton competition in Plußsee: a field test of the resource-ratio hypothesis. Limnol Oceanogr. 1993;38:838–845. [Google Scholar]
- 45.Sommer U, Gliwicz Z M, Lampert W, Duncan A. The PEG-model of seasonal succession on planktonic events in fresh waters. Arch Hydrobiol. 1986;106:433–471. [Google Scholar]
- 46.Southwood T R E. The concept and nature of the community. In: Gee J H R, Giller P S, editors. Organisation of communities—past and present. Oxford, England: Blackwell Scientific Publications; 1986. pp. 3–27. [Google Scholar]
- 47.Specht T, Szymansji M, Barciszewska M Z, Barciszewski J, Erdmann V A. Compilation of 5S rRNA and 5S rRNA gene sequences. Nucleic Acids Res. 1997;25:96–97. doi: 10.1093/nar/25.1.96. [DOI] [PMC free article] [PubMed] [Google Scholar]
- 48.Stahl D A. Molecular approaches for the measurement of density, diversity, and phylogeny. In: Hurst C J, editor. Manual of environmental microbiology. Washington, D.C: ASM Press; 1997. pp. 102–114. [Google Scholar]
- 49.Stahl D A, Lane D J, Olsen G J, Pace N R. Characterization of a Yellowstone hot spring microbial community by 5S rRNA sequences. Appl Environ Microbiol. 1985;49:1079–1084. doi: 10.1128/aem.49.6.1379-1384.1985. [DOI] [PMC free article] [PubMed] [Google Scholar]
- 50.Staley J T. Diversity of aquatic heterotrophic bacterial communities. In: Schlesinger D, editor. Microbiology—1980. Washington, D.C: American Society for Microbiology; 1980. pp. 321–322. [Google Scholar]
- 51.Thingstad T F, Heldal M, Bratbak G, Dundas I. Are viruses important partners in pelagic food webs? Trends Ecol Evol. 1993;8:209–213. doi: 10.1016/0169-5347(93)90101-T. [DOI] [PubMed] [Google Scholar]
- 52.Vandamme P, Pot B, Gills M, De Vos P, Kersters K, Swings J. Polyphasic taxonomy, a consensus approach to bacterial systematics. Microbiol Rev. 1996;60:407–438. doi: 10.1128/mr.60.2.407-438.1996. [DOI] [PMC free article] [PubMed] [Google Scholar]
- 53.Van de Peer Y, Jansen J, De Rijk P, De Wachter R. Database on the structure of small ribosomal subunit RNA. Nucleic Acids Res. 1997;25:111–116. doi: 10.1093/nar/25.1.111. [DOI] [PMC free article] [PubMed] [Google Scholar]
- 54.Ward D M, Bateson M M, Weller R, Ruff-Roberts A L. Ribosomal RNA analysis of microorganisms as they occur in nature. Adv Microb Ecol. 1992;12:220–286. [Google Scholar]
- 55.Wayne L G, Brenner D J, Colwell R R, Grimont P A D, Kandler O, Krichevsky M I, Moore L H, Moore W E C, Murray R G E, Stackebrandt E, Starr M P, Trüper H G. Report of the ad hoc committee on reconciliation of approaches to bacterial systematics. Int J Syst Bacteriol. 1987;37:463–464. [Google Scholar]
- 56.Weinbauer M, Höfle M G. Distribution and life strategies of two bacterial populations in a eutrophic lake. Appl Environ Microbiol. 1998;64:3776–3783. doi: 10.1128/aem.64.10.3776-3783.1998. [DOI] [PMC free article] [PubMed] [Google Scholar]
- 57.Woese C R. Bacterial evolution. Microbiol Rev. 1987;51:221–271. doi: 10.1128/mr.51.2.221-271.1987. [DOI] [PMC free article] [PubMed] [Google Scholar]