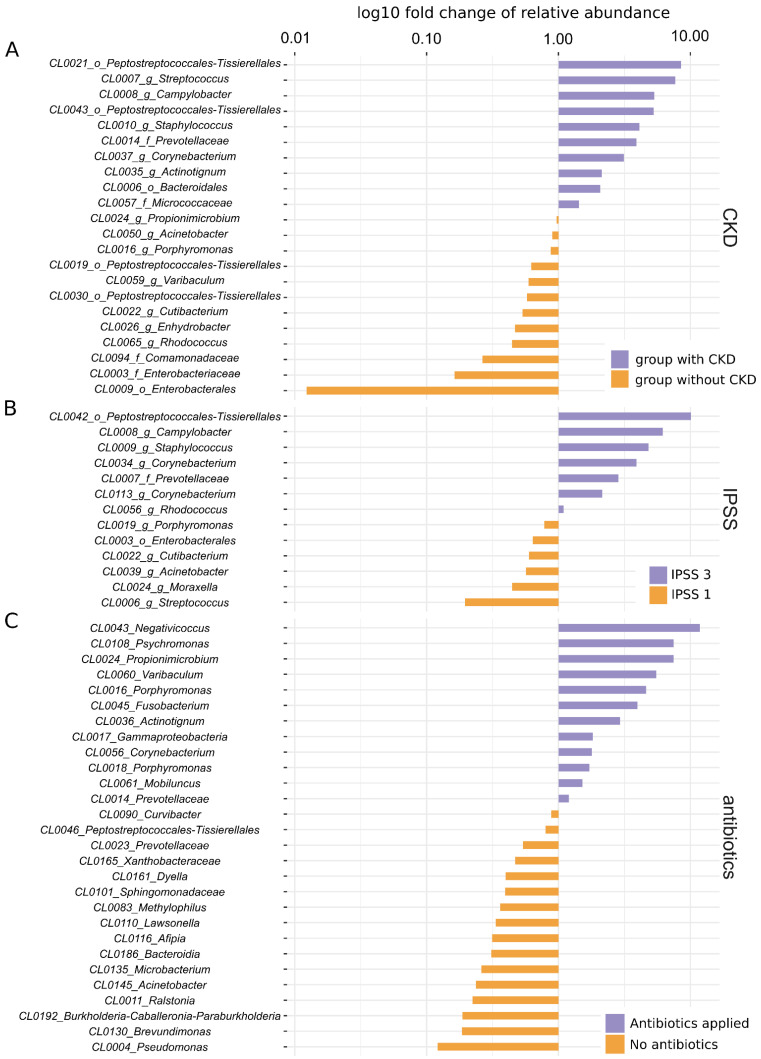
Figure 2.
Key OTUs and their distribution in individual groups of patients. (A) Key OTUs for patients with CKD and without CKD. (B) Key OTUs for patients with IPSS 3 and IPSS 1. (C) Key OTUs for patients with and without antibiotic prophylaxis. Names of OTUs denote ID of the OTU together with the nearest assigned taxon, X-axis shows fold change of relative abundance of the taxa, enrichment in an individual group is colour-coded; values were log10 transformed. Note that the PIME algorithm puts emphasis on the prevalence of individual OTUs rather than their mean relative abundance; even the OTUs with the largest differential abundance between two groups may in fact have very low relative abundances.

