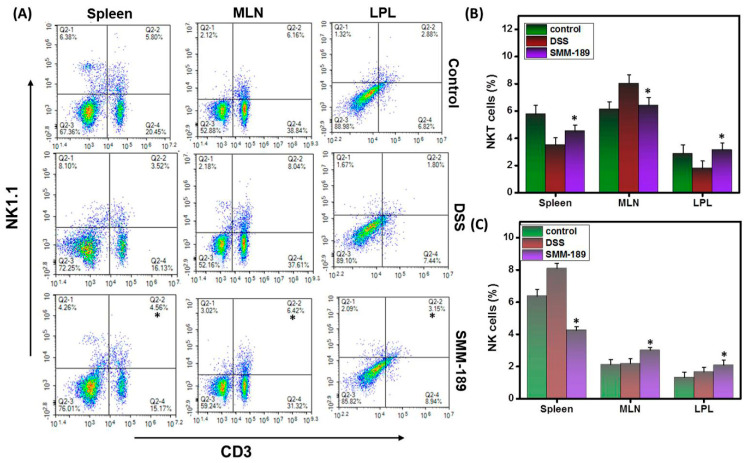
Figure 4.
Alteration in NKT and NK cells after SMM-189 treatment during DSS-induced colitis. Spleens, MLNs, and LPLs were harvested from the three groups of mice described in the legend for Figure 1 and single-cell suspensions were prepared from each tissue. Cells were stained with antibodies specific for T cell marker CD3 and natural killer cell marker NK1.1. Panel (A), changes in the mean percentage of NK and NKT cells relative to CD3− or CD3+ T cells from spleen, MLNs, and LPLs were compared between the DSS and SMM-189-treated groups. In Panel (B), the numbers from the upper right quadrants of the plots in panel (A), indicating the total percentage of NKT cells, were collected for three experiments in a bar graph. Panel (C), the numbers from the upper left quadrants of the plots in Panel (A), indicating NK cells, were collected for three experiments in a bar graph. Data represent the total number of cells ± SEM from three independent experiments, each involving six mice per group (n = 18). Asterisks (*) indicate statistically significant differences at p < 0.01 between the DSS and SMM-189-treated groups.

