Figure 1.
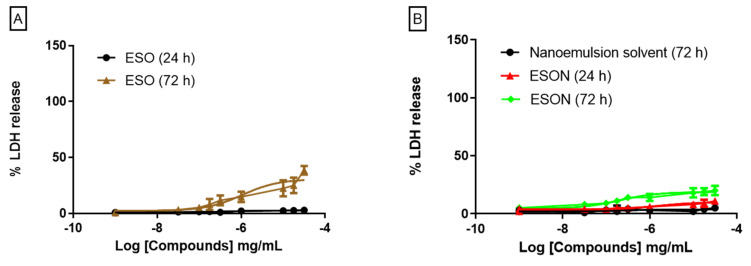
Cytotoxicity effect of ESO and ESON on mammalian cells evaluated by LDH release. (A) LDH release quantification after the stimulus with crescent ESO concentrations for 24 and 72 h; (B) LDH release quantification after the stimulus with crescent ESON concentrations for 24 and 72 h. Profiles are representative of 3–4 independent experiments for LDH release.

