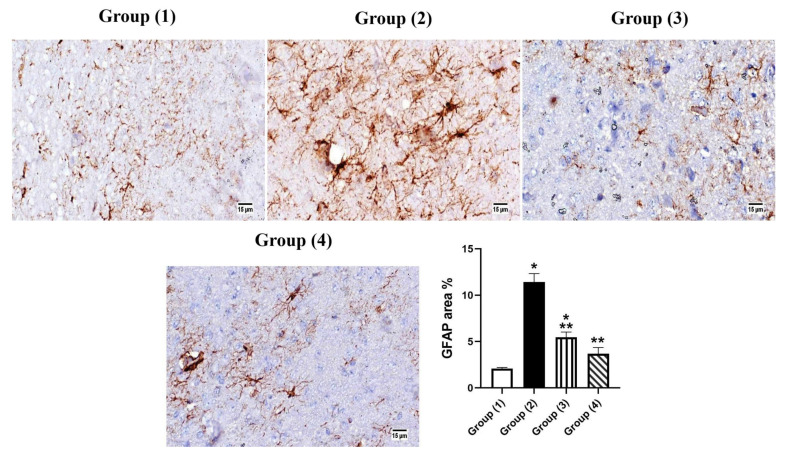
Figure 9.
Photomicrograph immunohistochemistry of GFAP expression in brain tissue. Group (2) shows marked expression of GFAP; however, morphological difference between the two treated groups was not observed. The graph shows that the area % of GFAP was significantly elevated in group (2); values are expressed as means ± SE. Significant difference was considered at p < 0.05. *: Statistically significant difference from the normal group at p < 0.05, **: Statistically significant difference from the positive control group (STZ, 3 mg/kg) at p < 0.05.

