

Abstract
Prior to the advent of modern medicine, humans have used botanicals extensively for their therapeutic potential. With the majority of newly approved drugs having their origins in natural products, plants remain at the forefront of drug discovery. Continued research and discovery necessitate the use of high-throughput analytical methods to screen and identify bioactive components and potential therapeutic molecules from plants. Utilizing a pre-generated plant extract library, we subjected botanicals to LC-MS/MS-based molecular networking to determine their chemical composition and relatively quantify already known metabolites. The LC-MS/MS-based molecular networking approach was also used to authenticate the composition of dietary supplements against their corresponding plant specimens. The networking procedures provided concise visual representations of the chemical space and highly informative assessments of the botanicals. The procedures also proved to define the composition of the botanical supplements quickly and efficiently. This offered an innovative approach to metabolite profiling and authentication practices and additionally allowed for the identification of new, putatively unknown metabolites for future isolation and biological evaluation.
Keywords: Echinacea, black cohosh, ashwagandha, molecular networking, LC-MS/MS
GRAPHICAL ABSTRACT

1. Introduction
Medicines derived from natural sources make up the majority of our therapeutic arsenal with 75% of all new approved drugs from 1981-2019 being natural products, natural product derivatives, biological macromolecules, vaccines, synthetic agents inspired by natural products or agents with natural product pharmacophores [1]. Between 2000 and 2010, 38 natural product-derived drugs were approved for various medical indications [2]. Of the more than 100 natural product-derived drugs in clinical development during this time, 91 were plant derived [3]. Well before the age of modern medicine, humans have known about the therapeutic potential of plants for thousands of years. This historical usage gives botanical and herbal sources of new drugs somewhat of an advantage over other drug sources since discovery is often based on historical observations of patient experiences (i.e., an herbal treatment has been anecdotally associated with a particular symptom alleviation, setting the stage for the isolation of a potentially active component). While the isolation of a single agent is typically the approach in Western medicine, herbal treatments and ethnobotanical approaches may include whole plant extracts, mixtures of plant extracts, supplements, and the healing potential of functional foods [4–7]. Thus, plants can be used in drug discovery both for the isolation of a single bioactive chemical agent and at the extract level where the multiple components in natural product mixtures may be associated with beneficial interactions [8]. Herbal supplement sales in the United States in 2020 reached over 11 billion USD as consumers turned to these products during the COVID-19 pandemic [9]. These multifunctional uses, along with the chemical complexity of herbals, necessitate the improvement of analytical procedures for efficient identification and quantification of plant components as well as the discovery of potentially new molecules. Additionally, these approaches are necessary to ultimately standardize herbal products for medicinal use to ensure safety, efficacy, and quantitative measurements of active components. Furthermore, screening extensive libraries of plant extracts has the potential to discover new bioactive chemical entities and provide insights into new functions for previously discovered molecules.
One analytical approach to metabolite profiling is LC-MS/MS-based molecular networking. This is a tool whereby a metabolic inventory can be accomplished by analyzing extracts and chromatography fractions via LC-MS/MS analysis and linking molecules into families or clusters based on common MS/MS fragmentation patterns. Similarities between fragment ions, relative intensities, and m/z ratios of paired spectra are compared, and similarity of compounds is determined using a modified cosine calculation as a similarity score [10,11]. Molecules with similar fragmentation patterns are grouped together while those with different fragmentation patterns are grouped separately. Molecules that do not cluster into groups are shown as single nodes. Networks can be created using the online platform available at gnps.ucsd.edu [12]. Computational scripts are available on the Global Natural Products Social Molecular Networking (GNPS) site to provide a relative quantification of metabolites which can provide an in-depth visual data piece with respect to small molecules by detailing abundance and composition of these metabolites. There are many relevant examples of the applications of LC-MS/MS-based molecular networking and other metabolomic approaches to the study of medicinal plants and botanical supplements. Molecular networking has been used to illustrate the metabolite composition of different closely related species [13,14], to visualize the components in complex plant extracts and plant parts [15,16], to discover novel biologically relevant metabolites [17], and to authenticate botanical products such as saffron spice [18]. However, knowledge gaps remain in how this molecular networking approach can capture the full chemical space of botanical extracts, and there is a need to generate more LC-MS/MS data of widely used botanicals and botanical supplements to be publicly available and “mineable.” The use of authentic standards and comprehensive spectral comparisons to confidently identify metabolites, as we have done in this report, overcome previous gaps in publicly available data, i.e., lack of data curation and annotation.
The University of Rhode Island’s Heber W. Youngken Jr. Medicinal Garden holds a collection of over 200 medicinal plant species, representing an enormous reservoir of molecular potential. Not only can it serve as a platform to generate a rich library of samples which can then be screened in biological assays, but it also represents complex collections of metabolites for new analytical approaches for metabolite annotation and visualization. A screening library has already been generated in the form of the Principal Rhode Island Secondary Metabolite (PRISM) library, a collection of extracts from the garden created by upper-division undergraduate students with new additions occurring every year [19]. This library includes many specimens which are also popular in the herbal industry. In the current work, we focused on Echinacea, ashwagandha, and black cohosh, whose herbal supplements were all in the top 20 of those used in the United States in 2020 (Echinacea, 7; ashwagandha, 12; black cohosh, 17) [9]. Echinacea is primarily used for its immunity boosting and anti-inflammatory activity [20], while ashwagandha is used to reduce stress and promote wellbeing [21]. Black cohosh is commercially used to treat symptoms of menopause and gynecological disorders [22]. The ease of access to complex botanical extracts in this new library afforded our laboratory the opportunity to subject them to LC-MS/MS-based molecular networking to determine the composition of many of these extracts and to relatively quantify important known metabolites in the various plant parts (e.g., root components vs. leaf components). Furthermore, we probed approaches for uncovering the most chemical space available by comparing botanical extracts to chromatography fractions created from these extracts. Finally, we used the LC-MS/MS-based molecular networking approach to annotate metabolites in commercial botanical supplements and compared the composition of the supplements to their corresponding plant specimens. The networking procedure provided a concise visual representation of the chemical space of these specimens, and it quickly and efficiently defined the composition of botanical supplements.
2. Results and Discussion
2.1. Annotation of antioxidant metabolites in botanicals
The chromatography fractions with antioxidant activity, which were originally derived from plants representing some of the top botanical supplements used in the United States [19], were subjected to LC-MS/MS-based molecular networking. The raw files for analysis were retrieved from the MassIVE database (MSV000088444). Several well-known metabolites with documented antioxidant activity were identified in the GNPS library including rutin (elderberry, ashwagandha), eriodictyol-7-O-glucoside (black cohosh), quercetin (elderberry, black cohosh, ashwagandha), aloin A/B (aloe), anthocyanidin glycosides (elderberry), chlorogenic acid (elderberry and ashwagandha), and numerous additional flavonoids (all samples). Compound identifications followed manual inspection of the MS/MS product ion match using the GNPS online platform. Additionally, certain analyses were “seeded” with pure compound standards to confirm certain identifications for antioxidants such as aloin A/B (in aloe samples), and echinacoside (in Echinacea samples) (Figure S1). Network visualization clearly color-coded the specialized metabolites by species (Figure 1), and many of these metabolites are likely responsible for the antioxidant activity documented from these chromatography fractions. Elderberry anthocyanins, aloin, echinacoside, and many of the flavonoids identified have shown antioxidant activity in a variety of models [23–26].
Figure 1.
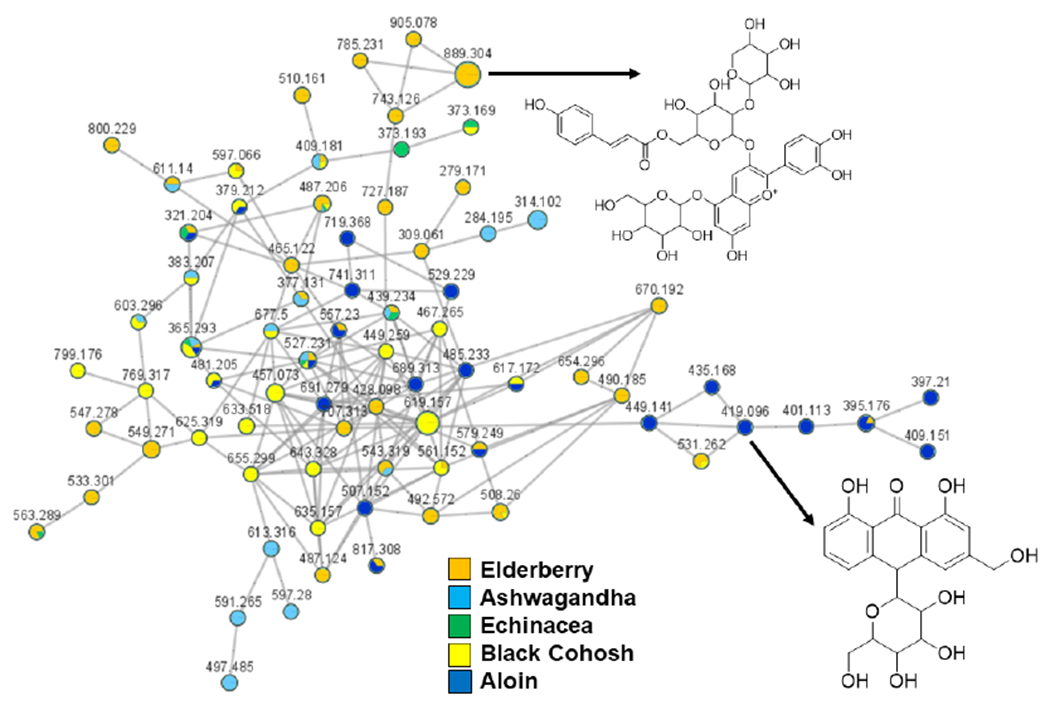
Annotation of antioxidant metabolites from plant specimens. Chromatography fractions from plant extracts possessing antioxidant activity were subjected to LC-MS/MS-based molecular networking. Nodes are colored by plant and labeled with their precursor m/z values. Identifications of an anthocyanin from elderberry and aloin from aloe are shown. Node size is relative to ion count.
2.2. Annotation of metabolites in plant parts
Alkylamides, the major lipophilic metabolites in Echinacea, are found in the highest concentrations in the plant roots with lower concentrations in the aerial plant parts [27]. While both the roots and the aerial parts of Echinacea are used for medicinal purposes, studies are lacking in distinguishing the efficacy of the different plant parts [28]. Alkylamides have shown cannabinoid type-2 receptor binding, anti-inflammatory, and immunomodulatory properties [29]. Furthermore, reports indicate that the roots contain the highest amounts of echinacoside [27]. Comparing the metabolite distribution in the roots, leaves, and cones of Echinacea clearly showed that the roots contained the greatest number of alkylamides, and these metabolites were most abundant in the roots (Figure 2). Comparisons of the MS/MS fragmentation patterns for the putative alkylamides in our networks showed very strong matches (at least 6 matched product ions) to those of undeca-2E,4E-diene-8,10-diynoic acid isobutylamide (m/z 230), undeca-2E,4E-diene-8,10-diynoic acid 2-methylbutylamide (m/z 244), deca-2E,4E,8Z-trienoic acid isobutylamide (m/z 222), tetradeca-2E,4E,12Z-triene-8,10-diynoic acid isobutylamide (m/z 270), and tetradeca-2E,4E-diene-8,10-diynoic acid isobutylamide (m/z 272) [30]. In addition to visualizing the distribution of the alkylamides in the various plant parts, the networking approaches also putatively identified unknown alkylamides such as m/z 194 and m/z 290. These metabolites can now be targeted for isolation and structure elucidation. Interestingly, we identified echinacoside in the aerial portions of the plant but not in the roots. This identification was confirmed with chromatographic comparison to an authentic standard.
Figure 2.

Alkylamide molecular network. Pie slices indicate the presence of analytes in various plant parts. The structures of two putative alkylamides are shown near their respective nodes.
While the alkylamides were the major specialized metabolites in Echinacea, the triterpene glycosides were the major specialized metabolite class in black cohosh, and these compounds are used to authenticate and standardize black cohosh botanical products with the acteins and cimiracemosides, some of the most well-described compounds [31]. The triterpenoid glycosides were generally distributed amongst the root and aerial parts of the plants (Figure S2). 23-epi-26-deoxyactein was detected in each plant part tested and this compound is often used for standardization in black cohosh botanical products [31]. This identification was confirmed via comparison to an authentic commercial standard. Additionally, m/z values consistent with cimiracemosides C (m/z 621) and D (m/z 679) were also detected in black cohosh specimens. These triterpenoid glycosides were all found in the same molecular networking cluster along with a GNPS library hit for another triterpenoid glycoside ([17-(2,6-dihydroxy-6-methyl-3-oxoheptan-2-yl)-3-hydroxy-4,4,9,13,14-pentamethyl-2-[3,4,5-trihydroxy-6-(hydroxymethyl)oxan-2-yl]oxy-2,3,7,8,10,11,12,15,16,17-decahydro-1H-cyclopenta[a]phenanthren-16-yl] acetate).
The most well-studied group of specialized metabolites from ashwagandha are the steroidal lactones with common names such as withaferins, withanones, withanolides, and withanosides (glycosylated steroidal lactones). Withaferin A was identified in the aerial extracts of ashwagandha following chromatographic comparison to an authentic standard and examining the molecular network of the extract containing withaferin A showed a large grouping of related metabolites, likely including dihydrowithaferin A (m/z 473) (Figure S3).
2.3. Comparison of chemical space available from extracts and chromatography fractions
Extracts were subjected to reversed-phase fractionation to generate more rarefied pools of metabolites for analysis. We hypothesized that fractionating extracts would lead to more available chemical space for annotation. If these analytes are in low abundance in the extract, they may not be detected and fragmented in a data-dependent MS/MS method. Fractionating would allow for more metabolites to be detected and ultimately fragmented. This increased chemical space is important in efforts to obtain an organism’s full metabolome. Additionally, networking fractions against each other would show which elution system is most effective for isolating certain groups of metabolites, an important step during purification procedures when isolating new bioactive components. Focusing on bioactive metabolites of interest from Echinacea and black cohosh, the fractionation step revealed additional putative alkylamides and terpenoid glycosides, respectively. Several metabolites which were not initially detected in the cluster containing 23-epi-26-deoxyactein (m/z 661) from the black cohosh extract were present in the fractionated set (Figure 3).
Figure 3.

Comparison of black cohosh metabolite content between extract and chromatography fractions in the triterpenoid glycoside cluster. Metabolites observed in fractions that were not initially observed in the crude seed extract are designated by black boxes behind the nodes.
This same phenomenon was also observed in the alkylamide cluster when comparing the Echinacea extract to its fractions, although to a lesser extent as only two new ions were present in the fractions that were not identified in the extract (Figure S4). Access to these new metabolites can ultimately uncover new additions to molecular families and improve structure-activity relationship studies. Networking the fractions themselves showed that the majority of the alkylamides eluted in the 20% H2O: 80% CH3OH fraction, which could provide important information regarding the solvent systems to be used for the isolation of analytes of interest (Figure 4).
Figure 4.

Distribution of alkylamides in chromatography fractions. Networking shows that the majority of alkylamides were present in the 20% H2O: 80% CH3OH fraction.
2.4. Annotation of metabolites in botanical supplements and comparison to plant specimens
The commercial supplements from all vendors (2 for each specimen) were very similar to each other in terms of metabolite content. Examining the terpenoid glycoside cluster from both black cohosh supplements networked together showed identical metabolite composition (Figure S5). Comparison of these supplement extracts with an authentic standard of 23-epi-26-deoxyactein (m/z 683, M+Na+) confirmed its presence in each supplement (Figure 5). Interestingly, many additional precursor ions were observed in the network from each supplement and not observed in the black cohosh plant samples, which illustrated how important sourcing information is in dietary supplement production, and the potential for metabolite variability in source material. Additionally, feruoyl tyramine was identified by the GNPS library search for the black cohosh plant extracts and both of the supplement extracts (m/z 314) (Figure S6). This metabolite and its glycoside derivatives are marker compounds used for the authentication of black cohosh samples [32]. We sought to compare the chemical space of the supplements to that of the plant type from which they were derived. The two black cohosh supplements were replete with terpenoid glycosides (Figure S5), while the major alkylamides detected in the Echinacea plant samples were present in each supplement (Figure S7).
Figure 5.

Identification of 23-epi-26-deoxyactein in black cohosh botanical supplements. The panel on the left shows the comparison of the authentic standard to both black cohosh supplements extracting M+Na+ m/z 683. The panel on the right shows the network of the precursor m/z 683 molecule (black star) clearly present in the standard (orange) and both supplement samples (light blue and yellow) as well as in the black cohosh plant sample (dark blue).
Both Echinacea supplements were derived from aerial portions of the plant, and the alkylamides that were present in the aerial plant portions of our garden specimens were also observed in the supplements (e.g., m/z values 230, 244, 246, 248, 258) (cf. Figure 2 and Figure S7) showing intriguing consistency. Withaferin A was identified in both the ashwagandha plant samples and the botanical supplements (Figure 6). While plant samples were replete with many analytes and many putative withaferin A analogs (Figure S3), the supplements did not contain the same number of analytes. However, both supplements contained several metabolites with m/z 471 (Figure 6), all which had similar MS/MS fragmentation patterns. The most abundant metabolites were identified as withaferin A, withanone, and withanolide A based on comparison of MS/MS fragmentation patterns from a previously published report [33].
Figure 6.

Analysis of ashwagandha metabolites in supplements and plant parts. The top panel shows LC-MS/MS analysis of the withaferin A standard. The middle panels show the composition of analytes with m/z 471 in an ashwagandha supplement sample. These metabolites were identified as withaferin A, and putatively as withanone and withanolide A. The inset shows retention times for the analytes. The table shows the MZmine filtering process based on m/z values (471) and retention times for these analytes with gray indicating presence and white indicating absence in samples. Std = withaferin A standard; Ash = ashwagandha; Suppl = supplement; BC = black cohosh; Ech = Echinacea.
Additionally, we putatively identified viscosalactone B in both supplements and the aerial and root portions of ashwagandha based on MS/MS fragments m/z 453, m/z 317, m/z 299 and m/z 281 [33]. We were unable to discriminate between withanone and withanolide A based on their similarities in MS/MS fragmentation patterns (Figure S8). Because there is a limitation when annotating MS/MS networks of isomers or metabolites with very similar MS/MS fragmentation patterns, we implemented a retention time filtering procedure that could discriminate between isomers and compounds which share the same m/z value. The data processing was performed using the publicly available program MZmine [34]. We used this tool to identify different ashwagandha metabolites in ashwagandha plant parts and supplements using the supplements of Echinacea and black cohosh as controls. The gray (detected) and white (not detected) annotation approach could be applied widely to a constructed library of analytes and then used to verify and authenticate plant specimens and supplements per a researcher’s needs.
3. Conclusion
In this work, we have shown the utility of LC-MS/MS-based molecular networking for profiling plant metabolites in a variety of ways from bioactivity-based analysis to the distribution of metabolites in plant parts to the uncovering of chemical space by fractionation procedures and finally, the comparison of plant specimens and botanical supplements. This work could be further used to rapidly identify adulterants in supplements by comparing known metabolite profiles of plants and supplements to samples that could cause human illness. For instance, in Figure 5 an m/z 681 precursor ion was observed in the standard, which is likely a byproduct of synthesis in standard creation. The networking procedure offers high information analysis and can abrogate the need for manual interrogation of dozens or hundreds of individual spectra by “layering” analyses throughout the network (i.e., answering multiple scientific questions in one network run). We have completed definitive level 1 metabolomic identification of withaferin A in ashwagandha plants and supplements, 23-epi-26-deoxyactein in black cohosh plants and supplements, and echinacoside in Echinacea [35]. Furthermore, we have provided putative annotation of several alkylamides from Echinacea plant specimens and botanical supplements, triterpenoid glycosides from black cohosh, and withaferin analogs in ashwagandha. All these LC-MS/MS files are publicly available in the MassIVE database and can be mined and analyzed by other investigators (MSV000088895). Additionally, we have added the MS/MS spectrum of 23-epi-26-deoxyactein to the GNPS library (spectrum ID: CCMSLIB00009918929). Future investigations will focus on isolating the new alkylamides, withaferins, and triterpenoid glycosides from Echinacea, ashwagandha, and black cohosh, respectively. For instance, a recent study showed that certain triterpenoid glycosides isolated from Actaea racemosa have in vitro activity against multiple myeloma cells, and that this activity is related to aspects of structure such as the specific sugar moiety and positions of certain methyl groups [36]. The number of potential triterpenoid glycosides we have identified in our networks can enhance these types of structure-activity relationship studies tremendously. Recent research has pointed to withaferin A as a potential agent to treat SARS-CoV-2 infections and new discoveries of withaferin A analogs have the potential to probe these relationships further [37]. We will continue to accumulate and share mass spectrometric data of plant specimens in repositories and databases to enhance the confidence and accuracy of metabolite identifications.
4. Experimental
4.1. General experimental procedures.
LC-MS/MS analysis was performed using a Thermo Scientific LTQ XL mass spectrometer with an electrospray ionization (ESI) source (Thermo Fisher Scientific, Waltham, MA, USA) coupled to a Dionex Ultimate 3000 HPLC system equipped with a micro vacuum degasser, an autosampler, and diode-array detector (DAD) (Thermo Fisher Scientific, Waltham, MA, USA). All extractions were carried out with HPLC grade solvents. Sample preparation was performed using C18 SPE columns purchased from Agilent Technologies (Wilmington, DE, USA). Standard compounds aloin, echinacoside, and withaferin A were purchased from Sigma-Aldrich (St. Louis, MO, USA). 23-epi-26-deoxyactein was purchased from Cayman Chemical Company (Ann Arbor, MI, USA). The following botanical supplements were purchased by mail order from Amazon.com: Black cohosh-1 (540 mg, root), Black cohosh-2 (540 mg, root), Ashwagandha-1 Ksm-66 tablets (600 mg, root - standardized to contain 5% withanolides and 200 mg of L-theanine), Ashwagandha-2 Ksm-66 capsules (900 mg, root), Echinacea-1 (400 mg, Echinacea purpurea aerial components), and Echinacea-2 (400 mg, Echinacea purpurea aerial components).
4.2. Sample collection, extraction, and preparation.
Plant specimens (Withania somnifera, Echinacea purpurea, and Actaea racemosa) were harvested from the Heber W. Youngken Jr. Medicinal Garden, the plants were divided into leaves, roots, cones, and seeds parts, and portions of each part were extracted separately with CH3OH and H2O. For LC-MS/MS analysis of extracts, following solvent removal, samples were passed over a C18 SPE cartridge eluting with 100% CH3OH. For botanical supplements, the casings were removed, and the sample powder was weighed and extracted with CH3OH, and supplement samples were prepared for LC-MS/MS analysis in the same fashion as plant extracts. Black cohosh seeds, Ashwagandha roots, and Echinacea roots were further fractionated using C18 SPE cartridges to generate a series of chromatography fractions before additional LC-MS/MS analysis and molecular networking. Five fractions were produced from the crude extracts, beginning with the most polar (80% H2O: 20% CH3OH) and following a gradient (60% H2O: 40% CH3OH; 40% H2O: 60% CH3OH; 20% H2O: 80% CH3OH) ending with the least polar (100% CH3OH). All plant extract, supplement, and chromatography fractions were reconstituted at 0.6 mg/mL for LC-MS/MS analysis. All collected plant species have accompanying voucher specimens held in the KIRI herbarium at the University of Rhode Island.
4.3. LC-MS/MS analysis and molecular networking
Each prepared sample was subjected to LC-MS/MS analysis with a specific scan event recording MS/MS spectra in data-dependent acquisition mode. A Kinetex 5 μm C18 column (150 x 4.6 mm) was used for separation of analytes in the extracts and chromatography fractions. The LC method consisted of a 5 min hold at initial conditions (85% H2O and 15% CH3CN each modified with 0.1 formic acid) and was followed by a linear gradient from 15% to 100% CH3CN in H2O + 0.1% formic acid over 20 min. Next, a hold at 100% CH3CN was held for 5 min. Initial conditions returned from min 31 to 38. The flow rate was held constant at 0.4 mL/min. The MS spray voltage was 3.5 kV with a capillary temperature of 325 °C. For the MS/MS component, the CID isolation width was 1.0 and the collision energy was 35.0 eV. Following acquisition, the raw data files were converted to .mgf or .mzXML format using MSConvert from the ProteoWizard suite (http://proteowizard.sourceforge.net/tools.shtml). Library searching and molecular networking were performed using the online platform at Global Natural Products Social Molecular Networking website (gnps.ucsd.edu) [8]. The data were filtered by removing all MS/MS fragment ions within +/− 17 Da of the precursor m/z. MS/MS spectra were window filtered by choosing only the top 6 fragment ions in the +/− 50 Da window throughout the spectrum. The precursor ion mass tolerance was set to 2.0 Da and a MS/MS fragment ion tolerance of 0.5 Da. Instrument blank spectra were filtered before networking. Networks were then created where edges were filtered to have a cosine score above 0.7 and more than 6 matched peaks, except for the network created for Figure 5 in which a cosine score of 0.95 was used and 6 matched peaks. Furthermore, edges between two nodes were kept in the network only if each of the nodes appeared in each other’s respective top 10 most similar nodes. Finally, the maximum size of a molecular family was set to 100, and the lowest scoring edges were removed from molecular families until the molecular family size was below this threshold. The spectra in the network were then searched against the GNPS spectral libraries. The library spectra were filtered in the same manner as the input data. All matches kept between network spectra and library spectra were required to have a score above 0.7 and at least 6 matched peaks. Network files were imported into Cytoscape for additional processing [38]. All files that were used to create Figures 2–6 and the supplementary figures are available under MassIVE dataset MSV000088895 (doi:10.25345/C5X05XD5R).
4.4. MZmine Processing
Raw LC-MS/MS data were converted to the .mzXML format using RawConverter [39]. The converted files were uploaded into the MZmine 2.53 program [34]. To build a mass list for each file, files were examined visually to determine the best noise level cut off. The mass detection was performed on centroided data with mass level 1 and a noise level of 100000 for the withaferin A standard and ashwagandha roots files; 10000 for the ashwagandha aerial, Echinacea supplement 1, and black cohosh supplement 2; 20000 for ashwagandha supplement 2 and black cohosh supplement 1; 300000 for ashwagandha supplement 2; 7000 for Echinacea supplement 2. Mass level 2 was filtered with a noise level of 1000 for the withaferin A standard and ashwagandha roots files; 100 for ashwagandha aerial, Echinacea supplement 1, and black cohosh supplement 2; 200 for ashwagandha supplement 2 and black cohosh supplement 1; 300 for ashwagandha supplement 2; 70 for Echinacea supplement 2. Chromatograms were built using the ADAP Chromatogram Builder Module with the appropriate mass lists [40], a minimum group size of 5 scans, the group intensity threshold and minimum highest intensity set to 3 times the noise level, and an m/z tolerance of 0.5, because this was low resolution data. Chromatograms were deconvoluted by using the baseline cut-off algorithm with the following settings: a minimum peak height of 3 times the original MS1 noise level, a peak duration range of 0.00 – 10.00 min, and a baseline the same as the minimum peak height. Chromatograms were then deisotoped using the isotopic peak grouper with an m/z tolerance of 0.5, a retention time tolerance of 0.5 min and a maximum charge of 3, and the most intense representative isotope was selected. The chromatograms were then aligned using the join aligner with an m/z tolerance of 0.5, the weight for the m/z of 75%, the retention time tolerance set to 0.5 min, and the weight for the retention time set to 25%. The aligned list was narrowed down to show only masses of interest for each data file.
Supplementary Material
Acknowledgements
We gratefully acknowledge funding from the Rhode Island IDeA Network of Biomedical Research Excellence program (P20GM103430) in the form of an Enhanced Virtual Education, Research, and Training award to M.B. We are also very grateful to those who developed and continue to improve the Global Natural Products Social Molecular Networking platform. The graphical abstract was created with BioRender.com.
Footnotes
Declaration of Competing Interests
The authors declare that they have no competing financial interests associated with this work.
Publisher's Disclaimer: This document is the Accepted Manuscript version of a published work that appeared in final for in Fitoterapia. To access the final edited and published work please visit https://doi.org/10.1016/j.fitote.2022.105200
Supplementary data
Additional molecular networks and MS/MS data referenced in the main text can be found in the supplementary data document.
References
- [1].Newman DJ, Cragg GM, 2020. Natural products as sources of new drugs over the nearly four decades from 01/1981 to 09/2019. J. Nat. Prod. 83, 770–803. 10.1021/acsjnatprod.9b01285 [DOI] [PubMed] [Google Scholar]
- [2].Brahmachari G, 2011. Bioactive natural products: opportunities and challenges in medicinal chemistry. World Scientific Publishing Co, Singapore. [Google Scholar]
- [3].Krause J, Tobin G, 2013. Discovery, development and regulation of natural products, in: Kulka M (Ed.). Using old solutions to new problems - natural drug discovery in the 21st century. InTech, pp. 3–35. 10.5772/56424 [DOI] [Google Scholar]
- [4].Elfahmi, Woerdenbag HJ, Kayser O, 2014. Jamu: Indonesian traditional herbal medicine towards rational phytopharmacological use. J. Herb. Med. 4, 51–73. 10.1016/j.hermed.2014.01.002 [DOI] [Google Scholar]
- [5].Chugh NA, Bali S, Koul A, 2018. Integration of botanicals in contemporary medicine: road blocks, checkpoints and go-ahead signals. Integr. Med. Res. 7, 109–125. 10.1016/jimr.2018.03.005 [DOI] [PMC free article] [PubMed] [Google Scholar]
- [6].Shah S, Bhat JA, 2019. Ethnomedicinal knowledge of indigenous communities and pharmaceutical potential of rainforest ecosystems in Fiji Islands. J. Integr. Med. 17, 244–249. 10.1016/j.joim.2019.04.006 [DOI] [PubMed] [Google Scholar]
- [7].Porras G, Chassagne F, Lyles JT, Marquez L, Dettweiler M, Salam AM, Samarakoon T, Shabih S, Farrokhi DR, Quave CL, 2021. Ethnobotany and the role of plant natural products in antibiotic drug discovery. Chem Rev. 121, 3495–3560. 10.1021/acs.chemrev.0c00922. [DOI] [PMC free article] [PubMed] [Google Scholar]
- [8].Caesar LK, Cech NB, 2019. Synergy and antagonism in natural product extracts: when 1 + 1 does not equal 2. Nat. Prod. Rep. 36, 869–888. 10.1039/c9np00011a. [DOI] [PMC free article] [PubMed] [Google Scholar]
- [9].Smith T, Majid F, Eckl V, Reynolds CM, 2020. Herbal supplement sales in US increase by record-breaking 17.3% in 2020. HerbalGram 131, 52–65. [Google Scholar]
- [10].Frank AM, Bandeira N, Shen Z, Tanner S, Briggs SP, Smith RD, Pevzner PA, 2008. Clustering millions of tandem mass spectra. J. Proteome Res. 7, 113–122. 10.1021/pr070361e [DOI] [PMC free article] [PubMed] [Google Scholar]
- [11].Watrous J, Roach P, Alexandrov T, Heath BS, Yang JY, Kersten RD, van der Voort M, Pogliano K, Gross H, Raajimakers JM, Moore BS, Laskin J, Bandeira N, Dorrestein PC, 2012. Mass spectral molecular networking of living microbial colonies. Proc. Natl. Acad. Sci. USA. 109, E1743–E1752. [DOI] [PMC free article] [PubMed] [Google Scholar]
- [12].Wang M, Carver JJ, Phelan VV, Sanchez LM, Garg N, Peng Y, Nguyen DD, Watrous J, Kapono CA, Luzzatto-Knaan T, Porto C, Bouslimani A, Melnik AV, Meehan MJ, Liu W-T, Crüsemann M, Boudreau PD, Esquenazi E, Sandoval-Calderón M, Kersten RD, Pace LA, Quinn RA, Duncan KR, Hsu C-C, Floros DJ, Gavilan RG, Kleigrewe K, Northen T, Dutton RJ, Parrot D, Carlson EE, Aigle B, Michelsen CF, Jelsbak L, Sohlenkamp C, Pevzner P, Edlund A, McLean J, Piel J, Murphy BT, Gerwick L, Liaw C-C, Yang Y-L, Humpf H-U, Maansson M, Keyzers RA, Sims AC, Johnson AR, Sidebottom AM, Sedio BE, Klitgaard A, Larson CB, Boya P, C. A, Torres-Mendoza D, Gonzalez DJ, Silva DB, Marques LM, Demarque DP, Pociute E, O’Neill EC, Briand E, Helfrich EJN, Granatosky EA, Glukhov E, Ryffel F, Houson H, Mohimani H, Kharbush JJ, Zeng Y, Vorholt JA, Kurita KL, Charusanti P, McPhail KL, Nielsen KF, Vuong L, Elfeki M, Traxler MF, Engene N, Koyama N, Vining OB, Baric R, Silva RR, Mascuch SJ, Tomasi S, Jenkins S, Macherla V, Hoffman T, Agarwal V, Williams PG, Dai J, Neupane R, Gurr J, Rodríguez AMC, Lamsa A, Zhang C, Dorrestein K, Duggan BM, Almaliti J, Allard P-M, Phapale P, Nothias L-F, Alexandrov T, Litaudon M, Wolfender J-L, Kyle JE, Metz TO, Peryea T, Nguyen D-T, VanLeer D, Shinn P, Jadhav A, Müller R, Waters KM, Shi W, Liu X, Zhang L, Knight R, Jensen PR, Palsson BØ, Pogliano K, Linington RG, Gutiérrez M, Lopes NP, Gerwick WH, Moore BS, Dorrestein PC, Bandeira N, 2016. Sharing and Community Curation of Mass Spectrometry Data with Global Natural Products Social Molecular Networking. Nat. Biotechnol. 34, 828–837. 10.1038/nbt.3597 [DOI] [PMC free article] [PubMed] [Google Scholar]
- [13].Ramabulana A-T, Petras D, Madala NE, Tugizimana F, 2021. Metabolomics and molecular networking to characterize the chemical space of four momordica plant species. Metabolites 11, 763. 10.3390/metabo11110763. [DOI] [PMC free article] [PubMed] [Google Scholar]
- [14].Tong Y, Wang P, Sun J, Li X, Wang T, Zhou Q, Xie Z, Jiang C, Wang J, 2021. Metabolomics and molecular networking approaches reveal differential metabolites of radix scrophulariae from different geographical origins: Correlations with climatic factors and biochemical compounds in soil. Ind. Crops Prod. 174, 114169. 10.1016/j.indcrop.2021.114169 [DOI] [Google Scholar]
- [15].Li Y, Cui Z, Li Y, Gao J, Tao R, Li J, Li Y, Luo J, 2022. Integrated molecular networking strategy enhance the accuracy and visualization of components identification: A case study of ginkgo biloba leaf extract. J. Pharm. Biomed. Anal. 209, 114523. 10.1016/j.jpba.2021.114523 [DOI] [PubMed] [Google Scholar]
- [16].Schneider GF, Salazar D, Hildreth SB, Helm RF, Whitehead SR, 2021. Comparative metabolomics of fruits and leaves in a hyperdiverse lineage suggests fruits are a key incubator of phytochemical diversification. Front. Plant Sci. 12. 10.3389/fpls.2021.693739 [DOI] [PMC free article] [PubMed] [Google Scholar]
- [17].Hu C, Tang Y, Snooks HD, Sang S, 2021. Novel steroidal saponins in OAT identified by molecular networking analysis and their levels in commercial OAT products. J. Agric. Food Chem. 69, 7084–7092. 10.1021/acs.jafc.1c02728 [DOI] [PubMed] [Google Scholar]
- [18].Hegazi NM, Khattab AR, Frolov A, Wessjohann LA, Farag MA, 2022. Authentication of saffron spice accessions from its common substitutes via a multiplex approach of UV/VIS fingerprints and UPLC/MS using molecular networking and Chemometrics. Food Chem. 367, 130739. 10.1016/jibodchem.2021.130739 [DOI] [PubMed] [Google Scholar]
- [19].Kirk RD, Carro MA, Wu C, Aldine MJ, Wharton AM, Goldstein DG, Rosario ME, Gallucci GM, Zhao Y, Leibovitz E, Bertin MJ, 2020. Integrating natural product chemistry workflows into medicinal chemistry laboratory training: building the PRISM library and cultivating independent research. J. Chem. Ed. 98, 410–415. 10.1021/acs.jchemed.0c00396 [DOI] [Google Scholar]
- [20].Xu W, Zhu H, Hu B, Cheng Y, Guo Y, Yao W, Qian H, 2021. Echinacea in hepatology: a review of its phytochemistry, pharmacology, and safety. Phytomedicine 87, 153572. 10.1016/j.phymed.2021.153572 [DOI] [PubMed] [Google Scholar]
- [21].Lopresti AL, Smith SJ, Malvi H, Kodgule R, 2019. An investigation into the stress-relieving and pharmacological actions of an ashwagandha (Withania somnifera) extract: a randomized, double-blind, placebo-controlled study. Medicine 98, e17186. 10.1097/MD.0000000000017186 [DOI] [PMC free article] [PubMed] [Google Scholar]
- [22].Kenda M, Glavač NC, Nagy M, Dolenc MS, 2021. Herbal products used in menopause and for gynecological disorders. Molecules 26, 7421. 10.3390/molecules26247421 [DOI] [PMC free article] [PubMed] [Google Scholar]
- [23].Pahlke G, Ahlberg K, Oertel A, Janson-Schaffer T, Grabher S, Mock HP, Matros A, Marko D, 2021. Antioxidant effects of elderberry anthocyanins in human colon carcinoma cells: A study on structure–activity relationships. Mol. Nutr. Food Res. 65, 2100229. 10.1002/mnfir.202100229 [DOI] [PMC free article] [PubMed] [Google Scholar]
- [24].Kaparakou EH, Kanakis CD, Gerogianni M, Maniati M, Vekrellis K, Skotti E, Tarantilis PA, 2020. Quantitative determination of aloin, antioxidant activity, and toxicity of aloe vera leaf gel products from Greece. J. Sci. Food Agric. 101, 414–423. 10.1002/jsfa.10650 [DOI] [PubMed] [Google Scholar]
- [25].Jia C, Shi H, Jin W, Zhang K, Jiang Y, Zhao M, Tu P, 2008. Metabolism of echinacoside, a good antioxidant, in rats: Isolation and identification of its biliary metabolites. Drug Metab. Dispos. 37, 431–438. 10.1124/dmd.108.023697 [DOI] [PubMed] [Google Scholar]
- [26].Pietta P-G, 2000. Flavonoids as antioxidants. J. Nat. Prod. 63, 1035–1042. 10.1021/np9904509 [DOI] [PubMed] [Google Scholar]
- [27].Kabganian R, Julie Carrier D, Sokhansanj S, 2002. Physical characteristics and drying rate of Echinacea root. Drying Technol. 20, 637–649. 10.1081/drt-120002821 [DOI] [Google Scholar]
- [28].Percival SS, 2000. Use of echinacea in medicine. Biochem. Pharmacol. 60, 155–158. 10.1016/S0006-2952(99)00413-X [DOI] [PubMed] [Google Scholar]
- [29].Raduner S, Majewska A, Chen J-Z, Xie X-Q, Hamon J, Faller B, Altmann K-H, Gertsch J, 2006. Alkylamides from Echinacea are a new class of cannabinomimetics. Cannabinoid type 2 receptor-dependent and -independent immunomodulatory effects. J. Biol. Chem. 218, 14192–14206. 10.1074/jbc.M601074200 [DOI] [PubMed] [Google Scholar]
- [30].Veryser L, Taevemier L, Wynendaele E, Verheust Y, Dumoulin A, De Spiegeleer B, 2017. N -alkylamide profding of Achillea ptarmica and Achillea millefolium extracts by liquid and gas chromatography–mass spectrometry. J. Pharm. Anal 7, 34–47. 10.1016/jjpha.2016.09.005 [DOI] [PMC free article] [PubMed] [Google Scholar]
- [31].Jiang B, Kronenberg F, Nuntanakorn P, Qiu M-H, Kennelly EJ, 2006. Evaluation of the botanical authenticity and phytochemical profile of black cohosh products by high-performance liquid chromatography with selected ion monitoring liquid chromatography–mass spectrometry. J. Agric. Food Chem. 54, 3242–3253. 10.1021/jf0606149 [DOI] [PMC free article] [PubMed] [Google Scholar]
- [32].Geng P, Harnly JM, Sun J, Zhang M, Chen P, 2017. Feruloyl dopamine-O-hexosides are efficient marker compounds as orthogonal validation for authentication of Black cohosh (Actaea racemosa)—an UHPLC-HRAM-MS chemometrics study. Anal. Bioanal. Chem. 409, 2591–2600. 10.1007/s00216-017-0205-l [DOI] [PMC free article] [PubMed] [Google Scholar]
- [33].Girme A, Saste G, Pawar S, Balasubramaniam AK, Musande K, Darji B, Satti NK, Verma MK, Anand R, Singh R, Vishwakarma RA, Hingorani L, 2020. Investigating 11 withanosides and withanolides by UHPLC–PDA and mass fragmentation studies from Ashwagandha (Withania somnifera). ACS Omega 5, 27933–27943. 10.1021/acsomega.0c03266 [DOI] [PMC free article] [PubMed] [Google Scholar]
- [34].Pluskal T, Castillo S, Villar-Briones A, Orešič M, 2010. MZmine 2: Modular Framework for processing, visualizing, and analyzing mass spectrometry-based molecular profile data. BMC Bioinform. 11. 10.1186/1471-2105-ll-395 [DOI] [PMC free article] [PubMed] [Google Scholar]
- [35].Salek RM, Steinbeck C, Viant MR, Goodacre R, Dunn WB, 2013. The role in reporting standards for metabolite annotation and identification in metabolomic studies. Gigascience 2, 13. 10.1186/2047-217X-2-13 [DOI] [PMC free article] [PubMed] [Google Scholar]
- [36].Jöhrer K, Stuppner H, Greil R, Çiçek SS, 2020. Structure-guided identification of black cohosh (Actaea racemosa) triterpenoids with in vitro activity against multiple myeloma. Molecules 25, 766. 10.3390/molecules25040766 [DOI] [PMC free article] [PubMed] [Google Scholar]
- [37].Staughn AR, Kakar SS, 2020. Withaferin A: a potential therapeutic agent against COVID-19 infection. J. Ovarian Res. 13, 79. 10.1186/s13048-020-00684-x [DOI] [PMC free article] [PubMed] [Google Scholar]
- [38].Shannon P, Markiel A, Ozier O, Baliga NS, Wang JT, Ramage D, Amin N, Schwikowski B, Ideker T, 2003. Cytoscape: A software environment for integrated models of biomolecular interaction networks. Genome Res. 13, 2498–2504. 10.1101/gr.1239303 [DOI] [PMC free article] [PubMed] [Google Scholar]
- [39].He L, Diedrich J, Chu Y-Y, Yates JR, 2015. Extracting accurate precursor information for tandem mass spectra by Rawconverter. Anal. Chem. 87, 11361–11367. 10.1021/acs.analchem.5b02721 [DOI] [PMC free article] [PubMed] [Google Scholar]
- [40].Myers OD, Sumner SJ, Li S, Barnes S, Du X, 2017. One step forward for reducing false positive and false negative compound identifications from mass spectrometry metabolomics data: New algorithms for constructing extracted ion chromatograms and detecting Chromatographic Peaks. Anal. Chem. 89, 8696–8703. 10.1021/acs.analchem.7b00947 [DOI] [PubMed] [Google Scholar]
Associated Data
This section collects any data citations, data availability statements, or supplementary materials included in this article.