Abstract
An assay has been developed for measuring protein biomass of marine planktonic bacteria by flow cytometry. The method was calibrated by using five species of Bacteria (an Arcobacter sp., a Cytophaga sp., an Oceanospirillum sp., a Pseudoalteromonas sp., and a Vibrio sp.) recently isolated from seawater samples and grown in culture at different temperatures. The intensity of SYPRO-protein fluorescence of these bacteria strongly correlated with their total protein content, measured by the bicinchoninic acid method to be in the range of 60 to 330 fg of protein cell−1 (r2 = 0.93, n = 34). According to the calibration, the mean biomass of planktonic bacteria from the North Sea in August 1998 was 24 fg of protein cell−1.
The accurate measurement of bacterial biomass is an outstanding problem of modern aquatic microbial ecology (examples are shown in references 5 and 19). These measurements are needed for balancing stocks of organic matter at sea and for relating rates and efficiencies of heterotrophic bacterial growth to nutrient concentration and grazing pressure.
There are several approaches to determine the biomass of bacteria. The cell dimensions can be measured by microscopy, and subsequently biovolume can be computed and transformed into dry weight or cellular elemental contents of carbon or nitrogen (examples are shown in references 3, 23, 29, and 30). Direct elemental composition of bacterial cells can be determined by using X-ray microanalysis (8, 14). This method provides accurate measurements, but it is limited by laborious procedures and difficulties in obtaining absolute calibration. Size fractionation through a series of nucleopore filters was employed for estimating average diameters of bacterial cells (4, 33, 35), although the problem of converting cell biovolume into elemental content remained unsolved. Flow cytometric enumeration of planktonic bacteria by using nucleic acid stains has become routine (20–22, 24). Flow cytometry can also provide an estimate of biomass from the intensity of light scattered by single cells (26). However, most flow cytometric data for cell size were reported in arbitrary units (1, 7). Recently the method’s capacity to obtain absolute quantification was improved by using light scatter theory that accounted for differences in cell shape and relative refractive index (17, 25). However, the precision of this method decreases when populations of unknown bacterial species or complex natural bacterioplankton communities are analyzed.
Another possible technique for measuring individual cell biomass derives from the quantitative staining of cellular proteins, the most abundant cell macromolecules, which comprise about one-half of the dry weight of prokaryotic cells (e.g., 55% in Escherichia coli [15]). Total protein staining proved to be useful in monitoring the growth and metabolism of different populations of blood cells, and in most applications protein stains are not used alone but are combined with DNA fluorochromes (an example is shown in reference 28) for better differentiation of cells from debris in samples. Similarly to light scatter, the measurements of cellular compounds are generally provided in arbitrary units, and there have been very few studies where cellular compounds were accurately calibrated in absolute units (11, 24, 34).
Due to their small size, natural bacteria require a very bright dye to stain their protein sufficiently strongly to be within the detection range of modern flow cytometry. Therefore, we chose the recently developed SYPRO dyes, which were introduced for extrasensitive detection of proteins in gels (12). In the presence of excess sodium dodecyl sulfate (SDS), nonpolar regions of polypeptides are coated with detergent molecules, forming a micelle-like structure with a nearly constant SDS-to-protein ratio. The SYPRO dye binds to the SDS coat surrounding proteins and exhibits little protein to protein variation. A colorimetric assay described by Smith et al. (31) that uses bicinchoninic acid to chelate Cu+ ions reduced from Cu2+ in the presence of proteins at high pH was chosen to quantify amounts of protein.
In the present study, we explored the possibility of calibrating the intensity of fluorescence emitted by whole bacterial cells stained with SYPRO in femtograms of protein per cell. We used five species of bacteria of different phylogenetic affiliations: three members of the gamma-subclass of the class Proteobacteria (a Pseudoalteromonas sp., an Oceanospirillum sp., and a Vibrio sp.), one member of the epsilon-subclass of the class Proteobacteria (an Arcobacter sp.), and one member of the class Cytophaga-Flavobacterium-Bacteroides (a Cytophaga sp.). These bacteria were isolated from seawater samples collected in the North Sea. Using this set of cultured bacteria for calibration, we assumed that cellular fluorescence of SYPRO-stained natural bacterioplankton can be extrapolated into cell protein biomass that can be used directly or, if needed, converted into elemental biomass of carbon or nitrogen with the knowledge that proteins comprise about half of bacterial dry weight.
Cultures.
Seawater samples were collected from the North Sea in the vicinity of the island of Helgoland. The bacteria (Table 1) were isolated on plates with synthetic seawater medium prepared according to the method of Schut et al. (27) except for lacking aromatic and polymeric substrates and containing 1% Bacto agar (Difco, Detroit, Mich.). For subculturing, peptone (5 g liter−1) and yeast extract (1 g liter−1) were added, and cells were incubated at 4, 10, and 20°C in the dark. Cells were harvested at intervals to provide diverse cell sizes of bacteria. Additionally, dilution culture experiments were conducted with seawater samples collected at the same place. Ten milliliters of seawater, screened through a polycarbonate, 0.8-μm-pore-size filter to decrease the number of protozoan predators, was diluted with 90 ml of seawater filtered through a 0.2-μm-pore-size filter and kept at 20°C in the dark. The bacterioplankton populations were monitored by regular sampling. One-milliliter subsamples were fixed with 0.8% (final concentration) glutaraldehyde or paraformaldehyde every 12 h and kept frozen.
TABLE 1.
Phylogenetic affiliation of the isolates
| Isolate | Closest relative | 16S rRNA similarity (%) |
|---|---|---|
| Arcobacter sp. strain 0912.13 | Arcobacter nitrofigilis CCUG 15893T | 93.6 |
| Cytophaga sp. strain KT0211DS22 | Cytophaga uliginosa ATCC 14397T | 91.2 |
| Oceanospirillum sp. strain 0912.23 | Oceanospirillum commune ATCC 27118 | 95.8 |
| Pseudoalteromonas sp. strain 0912.10 | Pseudoalteromonas atlantica IAM 12927T | 99.5 |
| Vibrio sp. strain 0912.1 | Vibrio splendidus ATCC 33125T | 99.7 |
Sample preparation, staining procedure, and total protein determination.
Cultured bacteria were washed with 1 ml of aged natural seawater (filtered through a 0.2-μm-pore-size filter), centrifuged at 4,000 × g, resuspended, and filtered through 0.8-μm- or 1.2-μm-pore-size polycarbonate filters (Millipore, Bedford, Mass.) to produce a final concentration of 2 × 10⁹ to 9 × 10⁹ cells ml−1. Subsamples of 10 to 100 μl were transferred to 2-ml microcentrifuge tubes and kept frozen at −20°C for subsequent protein determination in these tubes. Generally, replicated 200-μl subsamples were fixed at 4°C for 1 h with paraformaldehyde (0.8% final concentration) and then kept frozen at −20°C. Additional parallel subsamples were fixed with glutaraldehyde or formaldehyde at the same final concentrations, and some paraformaldehyde-fixed samples were kept at 4°C for comparative study.
The protein biomass of bacteria was directly measured in triplicate subsamples by using the bicinchoninic acid (BCA) method (kit number BCA-1; Sigma, Deisenhofen, Germany), with bovine serum albumin as a standard; the coefficient of variance (CV) for replicated measurements was below 5%. The average protein content of individual bacterial cells was computed from these protein measurements by dividing the value obtained for total protein content by the number of bacterial cells determined by flow cytometry.
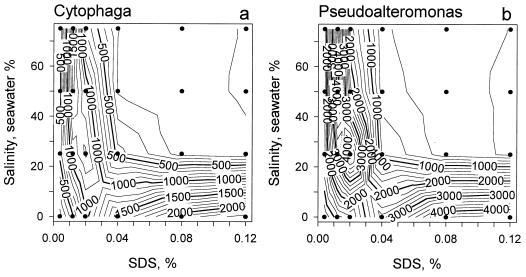
For flow cytometry, samples of fixed bacteria were thawed at 4°C and gently vortexed or mixed with a pipette. Cultured bacteria were diluted 1,000-fold with MQ-water (Millipore, Bedford, Mass.) filtered through a 0.2-μm-pore-size filter and were simultaneously stained with Hoechst 33342 (final concentration, 0.4 μg ml−1) (Molecular Probes, Eugene, Oreg.) and with SYPRO red (in excessive concentration, 1/10,000 dilution of the commercial stock) (Molecular Probes) in the presence of SDS (final concentration, 0.04%) at 20°C for at least 15 min before being analyzed by flow cytometry. Bacteria grown in dilution culture were diluted twofold and generally stained in the presence of 0.01% SDS. To optimize the staining procedure, the Cytophaga sp. and Pseudoalteromonas sp. were stained in the presence of various concentrations of SDS (0.004 to 0.12%) at salinity from 0 to 75% of natural seawater.
Standards.
Yellow-green fluorescent microspheres (Molecular Probes) of 0.5-μm and 2.0-μm diameters were used for the alignment of the flow cytometer. Although the 0.5-μm beads (CV < 5%) produced by this company were of superior quality to 0.5-μm yellow-green fluorescent latex microspheres (CV < 8%) (Fluoresbrite Microparticles; Polysciences, Warrington, Pa.), the latter had significantly higher blue fluorescence excited by UV and, therefore, were more suitable as a universal internal standard of forward-scatter, blue and red fluorescence.
Flow cytometry.
Stained, replicated samples were analyzed with a FACStar Plus flow cytometer (Becton Dickinson, Mountain View, Calif.) equipped with two lasers. The first, argon, laser (Innova 90; Coherent Inc., Palo Alto, Calif.) was tuned to UV multiline-emission (351.1 to 363.8 nm) at 115 mW. The second, Diode-pumped solid-state, laser (DPSS 532; Coherent) had an emission at 532 nm with 200 mW output power. Light emitted by the first laser and scattered by particles in the forward direction was focused on a photomultiplier tube through a 360 ± 20-nm band-pass filter. Blue fluorescence from Hoechst stain bound to nucleic acids was collected through a 460 ± 25-nm band-pass filter. The fluorescence from SYPRO red, bound to SDS-coated proteins, excited by the second laser was collected through a 620 ± 60-nm band-pass filter. Data acquisition and analysis were done with Cell-Quest software (Becton Dickinson). Acquisition was triggered by blue fluorescence to reduce the noise signal of the particulate and nonparticulate backgrounds. The ratio of the mean forward light scatter or fluorescence intensity of a bacterial population to the 0.5-μm internal standard beads was used to normalize samples and to calculate bacterial protein content. The bead intensity was taken as 100 units. The absolute concentration of beads in a standard stock suspension was determined by epifluorescence microscopy. Four replicates of 100 and 200 μl of the bead solution were filtered on 0.2-μm-pore-size, polycarbonate filters, 300 to 900 beads were counted in 20 fields of view under a Zeiss Axioplan microscope by using a 100× Plan Neofluar objective by two persons, and an average concentration of beads was calculated (e.g., 26 × 106 beads ml−1, CV 4%). The ratio of bead abundance to number of bacteria was used to compute the concentration of the latter.
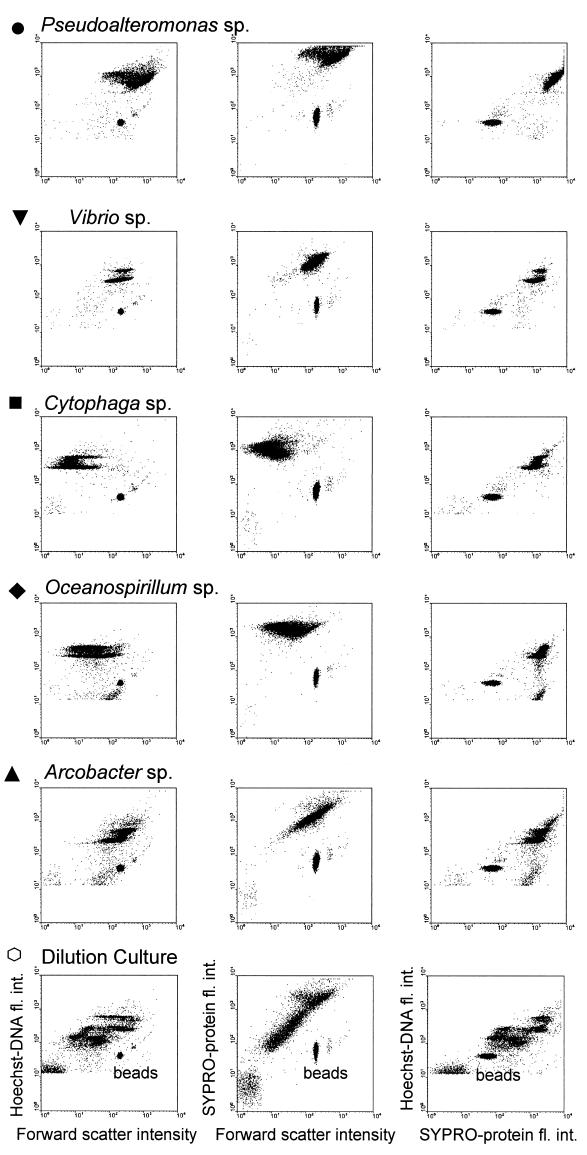
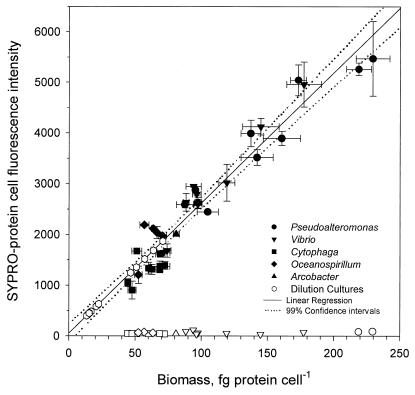
Each of the dual-stained bacterial cultures had distinct flow cytometric signatures illustrated on bivariate dot plots of three recorded parameters (Fig. 1). The fluorescence intensity of bacteria stained with SYPRO dye strongly correlated with measured cellular protein contents for five cultured species of bacteria (r2 = 0.93, n = 34) over the range of 60 to 330 fg of protein cell−1 (intercept b0 = 53.5 ± 357, slope b1 = 17.7 ± 0.89) (Fig. 2). By using linear regression as a calibration curve, the protein contents of natural bacteria grown in dilution culture were calculated. Bacterial cells of the original population of bacterioplankton from the North Sea contained 24 ± 4 fg of protein cell−1 (n = 12). Their average protein content increased to above 100 fg of protein cell−1 during growth in dilution culture and became comparable to the protein content of the Cytophaga sp., the Oceanospirillum sp., and the Vibrio sp.
FIG. 1.
Flow cytometric analyses of the bacterial cultures stained with SYPRO and Hoechst. Bivariate dot plot diagrams of the intensity of forward scatter versus the intensity of Hoechst-DNA fluorescence are shown in the left column, dot plots of forward scatter versus SYPRO-protein fluorescence are shown in the middle column, and dot plots of SYPRO-protein fluorescence versus Hoechst-DNA fluorescence are shown in the right column. The symbols used to label bacterial cultures are the same on all figures.
FIG. 2.
Comparison of the mean fluorescence intensities of SYPRO-stained bacteria and corresponding measurements of cell protein content determined by the BCA method. Open hexagons show protein contents of bacteria in seawater samples and dilution cultures, calculated from the intensity of SYPRO-protein fluorescence by using linear regression. Other open symbols show red autofluorescence of cultured bacteria in the absence of SYPRO staining.
Methodological questions of quantitative staining of bacteria.
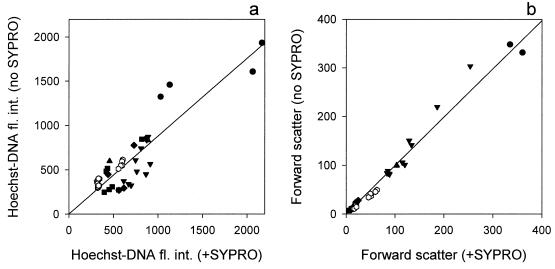
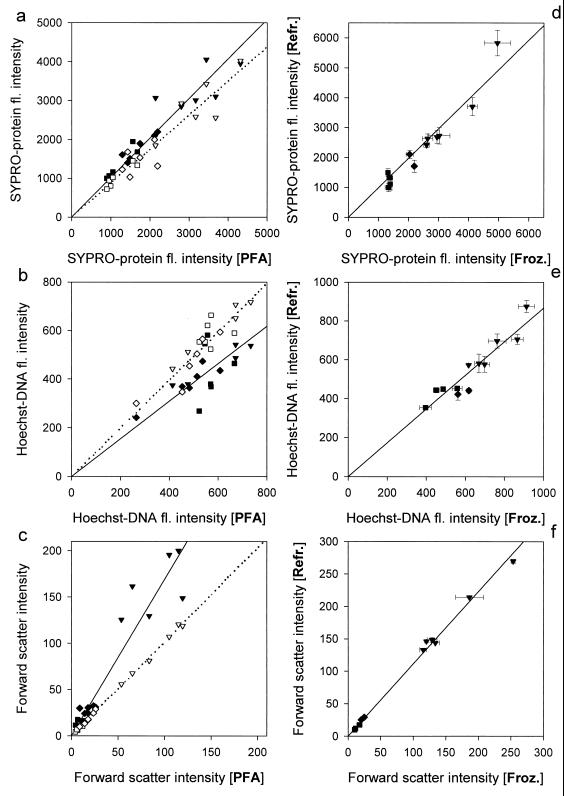
The autofluorescence of bacteria fixed with paraformaldehyde without SYPRO staining was only 1% that of the fluorescence of stained cells (Fig. 2). In the absence of SYPRO dye, the fluorescence intensity of Hoechst staining was somewhat lower (b1 = 0.88 ± 0.033, r2 = 0.8, n = 45) because of additional low blue fluorescence of SYPRO; however, forward-scatter intensity remained unchanged (b1 = 0.99 ± 0.014, r2 = 0.99, n = 45) (Fig. 3). Comparison of dual staining of bacteria (the Cytophaga sp., the Oceanospirillum sp., and the Vibrio sp.) fixed with three different aldehydes revealed no significant difference in SYPRO-protein fluorescence intensity between glutaraldehyde- and paraformaldehyde-fixed cells, although formaldehyde-fixed cells had slightly lower fluorescence (Fig. 4a). The fluorescence intensity of Hoechst-stained cells fixed with paraformaldehyde was similar to that of formaldehyde-fixed cells, while glutaraldehyde-fixed cells had somewhat lower fluorescence (Fig. 4b). Cells fixed with glutaraldehyde scattered significantly more light than cells fixed with either paraformaldehyde or formaldehyde (Fig. 4c). The observed differences probably reflected differences in the fixation process, since formaldehyde penetrated rapidly into cells but reacted slowly, while the opposite is true for glutaraldehyde (9, 13). Consequently, paraformaldehyde was chosen as the standard fixative.
FIG. 3.
Comparison of the intensities of Hoechst-DNA fluorescence (a) and forward scatter (b) with and without SYPRO-staining of bacteria.
FIG. 4.
Comparison of the intensities of SYPRO-protein fluorescence (a), Hoechst-DNA fluorescence (b), and forward scatter (c) of cultured bacteria fixed with paraformaldehyde [PFA] and with glutaraldehyde (closed symbols, solid line of linear regression) or with formaldehyde (open symbols, dotted line of linear regression) in the left column. Comparison of the same parameters (d through f) of bacteria fixed with paraformaldehyde and kept either frozen [Froz.] or refrigerated [Refr.].
Storage of fixed bacteria at 4°C for 24 h compared with freezing at −20° did not affect staining with SYPRO but did result in slightly lower Hoechst-DNA fluorescence and higher intensity of forward scatter (Fig. 4d through f). Longer storage of refrigerated samples led to a decreased SYPRO-protein fluorescence due to an ongoing fixation (data not shown). The fluorescence of bacteria stained in freshwater gradually increased with the increase of SDS concentration from 0.004% to 0.04% and then started to saturate at 0.08 to 0.12% SDS (Fig. 5) followed by a progressive lysis of the cells. In the presence of 25 to 75% seawater, bacteria started to lyse at SDS concentrations above 0.02%, whereas the highest fluorescence was observed in the presence of 0.008 to 0.012% SDS (Fig. 5). Because of the relatively low concentration of bacteria in natural seawater, the samples of dilution cultures were diluted only twofold during staining. The higher ionic strength of the final solution required only one-quarter of the concentration of SDS in the staining mixture (0.01% compared to 0.04% used for staining in MQ-water) to obtain similar protein staining (Fig. 5). The fluorescence intensity of cultured bacteria stained with SYPRO in half-diluted seawater in the presence of 0.01% SDS was slightly higher than in freshwater with 0.04% SDS (b1 = 1.14 ± 0.035, r2 = 0.98, n = 8).
FIG. 5.
Contour plots showing the complex dependency of the mean intensities of SYPRO-protein fluorescence of cultured Cytophaga sp. (a) and Pseudoalteromonas sp. (b) on the concentration of SDS and salinity of the staining solution. The dots indicate actual measurements at particular combinations of the two variables.
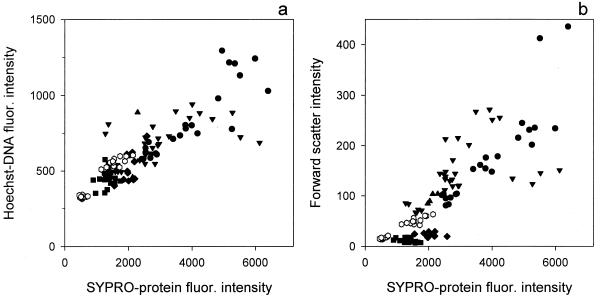
Other cell compounds (e.g., DNA) and properties (e.g., light scatter) were used to estimate the biomass of microorganisms (6, 11, 25, 34). We compared our results of whole-cell protein staining with corresponding DNA staining and forward-scatter intensity of five species of cultured bacteria and bacteria grown in dilution cultures (Fig. 6). Cell DNA content was found to allow for an accurate estimation of total cell carbon biomass in unicellular phytoplankton (34). This relationship seems to be more problematic for bacteria, since bacterial cells with different protein contents have similar DNA contents (Fig. 6a). Furthermore, cell biomass of bacterial isolates can vary widely depending on growth media and temperature, while the cells retain the same DNA content (e.g., Vibrio sp.) (Fig. 6a). At the same time, cells with the same protein content can have one or two copies of DNA (Fig. 1) (Vibrio sp., Cytophaga sp., and Oceanospirillum sp.), and some species can have even more copies (18).
FIG. 6.
Comparison of the mean intensities of SYPRO-protein fluorescence of cultured bacteria (n = 86) (closed symbols) and bacteria grown in dilution cultures (n = 24) (open hexagons) with corresponding intensities of Hoechst-DNA fluorescence (a) and forward scatter (b).
Forward light scattering of bacteria helps to resolve bacterial populations by flow cytometry and has been used to determine the biomass of these populations (16, 25, 26, 32). Forward scatter and SYPRO-protein fluorescence intensity correlated on a cell-to-cell basis for individual species of bacteria that appear almost spherical when examined by microscopy (Fig. 1, Vibrio sp. and Arcobacter sp.), and this was also observed for mixed populations in dilution cultures. However, our data did not show pronounced correlation of these two parameters (Fig. 6b). The intensity of light scattered by bacteria of rod or spirillum shapes (e.g., the Cytophaga sp. and the Oceanospirillum sp.) was highly variable, while their protein content was a much more conservative characteristic. Therefore, it seems that cellular protein staining is a more direct way of determining bacterial biomass than species- and shape-dependent light scattering properties.
In quantifying the total protein content of whole cells, one has to keep in mind an unavoidable controversy. It is impossible to stain all protein molecules, simply because only some of these molecules and/or parts of the molecule surfaces are accessible to a dye in fixed cells. It is possible to determine total cellular proteins, but in so doing, cells would be disrupted and could not then be counted by flow cytometry. Therefore, one should be satisfied if the fluorescence intensity of stained proteins in fixed cells correlates with the independent measurement of total protein of lysed cells.
Agreement between the values computed from the fluorescence intensity of SYPRO-stained bacteria, the values computed from total protein measurements by the BCA method, and the numbers of cultured bacteria counted by flow cytometry (Fig. 2) did not depend on the species or physiological state of the bacteria. Cultured bacteria used for calibration were grown at different temperatures to vary their protein contents so that, for example, the mean biomass of Vibrio sp. ranged from 100 to 250 fg of protein cell−1. The smallest Cytophaga sp. cells, containing 60 fg of protein cell−1, had about 4 to 6 times more protein (assuming equal cell protein and carbon contents) than oceanic bacterioplankton (8, 10) and only 2 to 3 times more protein than the planktonic bacteria, containing 24 fg of protein cell−1, collected in the coastal zone near Helgoland. Our measurement of protein content of coastal bacterioplankton agreed with a direct measurement of 30 fg of carbon cell−1 (10), under the same assumption of equal cell carbon and protein contents (15). Consequently, we conclude that, by using a calibration based on cultured bacteria, the protein biomass of individual bacterial cells of different sizes and physiological states observed in natural marine environments of various productivities can be estimated accurately. This method is an improvement over other flow cytometric methods for determining microorganism biomass (2, 6, 11, 24, 25), because it is a direct method for determination of protein content of individual cells without biases due to species and/or shape. It does not require preliminary knowledge of individual populations of bacterioplankton and therefore can be directly applied to the analysis of natural samples.
Acknowledgments
We thank M. A. Sleigh and J. Pernthaler for critical reading and helpful comments on an earlier version of the manuscript.
We are grateful to the Max-Planck-Society for the support of this work. The research of M.V.Z. was supported by the postdoctoral research fellowship (GT5/98/16/MSTB) from the Natural Environment Research Council.
REFERENCES
- 1.Åkerlund T, Nordström K, Bernander R. Analysis of cell size and DNA content in exponentially growing and stationary-phase batch cultures of Escherichia coli. J Bacteriol. 1995;177:6791–6797. doi: 10.1128/jb.177.23.6791-6797.1995. [DOI] [PMC free article] [PubMed] [Google Scholar]
- 2.Allman R, Hann A C, Phillips A P, Martin K L, Lloyd D. Growth of Azotobacter vinelandii with correlation of Coulter cell size, flow cytometric parameters and ultrastructure. Cytometry. 1990;11:822–831. doi: 10.1002/cyto.990110708. [DOI] [PubMed] [Google Scholar]
- 3.Bratbak G. Bacterial biovolume and biomass estimations. Appl Environ Microbiol. 1985;49:1488–1493. doi: 10.1128/aem.49.6.1488-1493.1985. [DOI] [PMC free article] [PubMed] [Google Scholar]
- 4.Burkill P H, Leakey R J G, Owens N J P, Mantoura R F C. Synechococcus and its importance to the microbial foodweb of the northwestern Indian Ocean. Deep-Sea Res Part II Top Stud Oceanogr. 1993;40:773–782. [Google Scholar]
- 5.Christian J R, Karl D M. Microbial community structure at the U.S.-Joint Global Ocean Flux Study station ALOHA: inverse methods for estimating biochemical indicator ratios. J Geophys Res. 1994;99:14,269–14,276. [Google Scholar]
- 6.Davey H M, Davey C L, Kell D B. On the determination of the size of microbial cells using flow cytometry. In: Lloyd D, editor. Flow cytometry in microbiology. New York, N.Y: Springer-Verlag; 1993. pp. 49–65. [Google Scholar]
- 7.DeLeo P C, Baveye P. Enumeration and biomass estimation of bacteria in aquifer microcosm studies by flow cytometry. Appl Environ Microbiol. 1996;62:4580–4586. doi: 10.1128/aem.62.12.4580-4586.1996. [DOI] [PMC free article] [PubMed] [Google Scholar]
- 8.Fagerbakke K M, Heldal M, Norland S. Content of carbon, nitrogen, oxygen, sulfur and phosphorus in native aquatic and cultured bacteria. Aquat Microb Ecol. 1996;10:15–27. [Google Scholar]
- 9.Fox C H, Johnson F B, Whiting J, Roller P P. Formaldehyde fixation. J Histochem Cytochem. 1985;33:845–853. doi: 10.1177/33.8.3894502. [DOI] [PubMed] [Google Scholar]
- 10.Fukuda R, Ogawa H, Nagata T, Koike I. Direct determination of carbon and nitrogen contents of natural bacterial assemblages in marine environments. Appl Environ Microbiol. 1998;64:3352–3358. doi: 10.1128/aem.64.9.3352-3358.1998. [DOI] [PMC free article] [PubMed] [Google Scholar]
- 11.Garcia-Ochoa G F, Santos V E, Alcón A. Intracellular compounds quantification by means of flow cytometry in bacteria: application to xanthan production by Xanthomonas campestris. Biotechnol Bioeng. 1998;57:87–94. doi: 10.1002/(sici)1097-0290(19980105)57:1<87::aid-bit11>3.0.co;2-5. [DOI] [PubMed] [Google Scholar]
- 12.Haugland R P. Handbook of fluorescent probes and research chemicals. 6th ed. Eugene, Oreg: Molecular Probes, Inc.; 1996. [Google Scholar]
- 13.Hayat M A. Principles and techniques of electron microscopy. Biological applications. Vol. 1. Baltimore, Md: University Park Press; 1981. Fixation; pp. 1–106. [Google Scholar]
- 14.Heldal M S, Norland S, Tumyr O. X-ray microanalytic method for measurement of dry matter and elemental content of individual bacteria. Appl Environ Microbiol. 1985;50:1251–1257. doi: 10.1128/aem.50.5.1251-1257.1985. [DOI] [PMC free article] [PubMed] [Google Scholar]
- 15.Ingraham J L, Maaløe O, Neidhardt F C. Growth of the bacterial cell. Sunderland, Mass: Sinauer Associates; 1983. [Google Scholar]
- 16.Koch A L. Some calculations on the turbidity of mitochondria and bacteria. Biochim Biophys Acta. 1961;51:429–441. doi: 10.1016/0006-3002(61)90599-6. [DOI] [PubMed] [Google Scholar]
- 17.Koch A L, Robertson B R, Button D K. Deduction of the cell volume and mass from forward scatter intensity of bacteria analyzed by flow cytometry. J Microbiol Methods. 1996;27:49–61. [Google Scholar]
- 18.Lebaron P, Joux F. Flow cytometric analysis of the cellular DNA content of Salmonella typhimurium and Alteromonas haloplanktis during starvation and recovery in seawater. Appl Environ Microbiol. 1994;60:4345–4350. doi: 10.1128/aem.60.12.4345-4350.1994. [DOI] [PMC free article] [PubMed] [Google Scholar]
- 19.Li W K W, Dickie P M, Harrison W G, Irwin B D. Biomass and production of bacteria and phytoplankton during the spring bloom in the western North Atlantic Ocean. Deep-Sea Res Part II Top Stud Oceanogr. 1993;40:307–327. [Google Scholar]
- 20.Li W K W, Jellett J F, Dickie P M. DNA distributions in planktonic bacteria stained with TOTO or TO-PRO. Limnol Oceanogr. 1995;40:1485–1495. [Google Scholar]
- 21.Marie D, Partensky F, Jacquet S, Vaulot D. Enumeration and cell cycle analysis of natural populations of marine picoplankton by flow cytometry using the nucleic acid stain SYBR Green I. Appl Environ Microbiol. 1997;63:186–193. doi: 10.1128/aem.63.1.186-193.1997. [DOI] [PMC free article] [PubMed] [Google Scholar]
- 22.Monger B C, Landry M R. Flow cytometric analysis of marine bacteria with Hoechst 33342. Appl Environ Microbiol. 1993;59:905–911. doi: 10.1128/aem.59.3.905-911.1993. [DOI] [PMC free article] [PubMed] [Google Scholar]
- 23.Norland S M, Heldal M, Tumyr O. On the relation between dry matter and volume of bacteria. Microb Ecol. 1987;31:95–101. doi: 10.1007/BF02011246. [DOI] [PubMed] [Google Scholar]
- 24.Robertson B R, Button D K. Characterizing aquatic bacteria according to population, cell size and apparent DNA content by flow cytometry. Cytometry. 1989;10:70–76. doi: 10.1002/cyto.990100112. [DOI] [PubMed] [Google Scholar]
- 25.Robertson B R, Button D K, Koch A L. Determination of the biomasses of small bacteria at low concentrations in a mixture of species with forward light scatter measurements by flow cytometry. Appl Environ Microbiol. 1998;64:3900–3909. doi: 10.1128/aem.64.10.3900-3909.1998. [DOI] [PMC free article] [PubMed] [Google Scholar]
- 26.Salzman G C, Singham S B, Johnston R G, Bohren C F. Light scattering and cytometry. In: Melamed M R, Lindmo T, Mendelsohn M L, editors. Flow cytometry and sorting. 2nd ed. New York, N.Y: John Wiley & Sons, Inc.; 1990. pp. 81–107. [Google Scholar]
- 27.Schut F, De Vries E, Gottschal J C, Robertson B R, Harder W, Prins R A, Button D K. Isolation of typical marine bacteria by dilution culture: growth, maintenance, and characteristics of isolates under laboratory conditions. Appl Environ Microbiol. 1993;59:2150–2160. doi: 10.1128/aem.59.7.2150-2160.1993. [DOI] [PMC free article] [PubMed] [Google Scholar]
- 28.Shapiro H M. Practical flow cytometry. 3rd ed. New York, N.Y: Wiley-Liss, Inc.; 1995. [Google Scholar]
- 29.Sieracki M E, Johnson P W, Seiburth J M. Detection, enumeration, and sizing of planktonic bacteria by image-analyzed epifluorescence microscopy. Appl Environ Microbiol. 1985;49:799–810. doi: 10.1128/aem.49.4.799-810.1985. [DOI] [PMC free article] [PubMed] [Google Scholar]
- 30.Sieracki M E, Viles C L, Webb K L. Algorithm to estimate cell biovolume using image analyzed microscopy. Cytometry. 1989;10:551–557. doi: 10.1002/cyto.990100510. [DOI] [PubMed] [Google Scholar]
- 31.Smith P K, Krohn R I, Hermanson G T, Mallia A K, Gartner F H, Provenzano M D, Fujimoto E K, Goeke N M, Olson B J, Klenk D C. Measurement of protein using bicinchoninic acid. Anal Biochem. 1985;150:76–85. doi: 10.1016/0003-2697(85)90442-7. [DOI] [PubMed] [Google Scholar]
- 32.VanDilla M A, Langlois R G, Pinkel D, Yajko D, Hadley W K. Bacterial characterization by flow cytometry. Science. 1983;220:620–621. doi: 10.1126/science.6188215. [DOI] [PubMed] [Google Scholar]
- 33.Veldhuis M J W, Kreaay G W, Gieskes W W C. Growth and fluorescence characteristics of ultraplankton on a northsouth transect in the eastern North Atlantic. Deep-Sea Res Part II Top Stud Oceanogr. 1993;40:609–626. [Google Scholar]
- 34.Veldhuis M J W, Cucci T L, Sieracki M E. Cellular DNA content of marine phytoplankton using two new fluorochromes: taxonomic and ecological implications. J Phycol. 1997;33:527–541. [Google Scholar]
- 35.Zubkov M V, Sleigh M A, Tarran G A, Burkill P H, Leakey R J G. Picoplanktonic community structure on an Atlantic transect from 50°N to 50°S. Deep-Sea Res Part I Oceanogr Res Pap. 1998;45:1339–1355. [Google Scholar]


