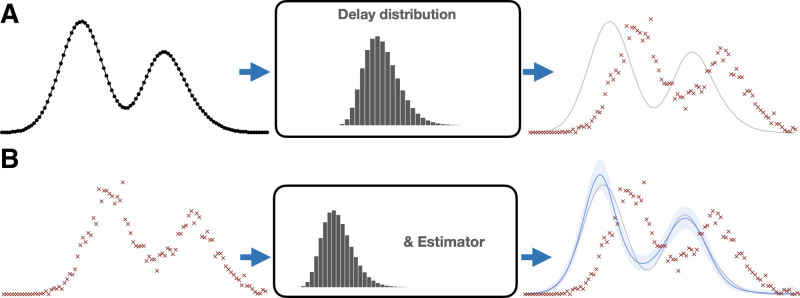
FIGURE 1.
Infection estimation overview. Top: the underlying infection time series—new infections per day—is perturbed by a delay distribution (center) that is measured with other data or assumed known. Each infection date is stochastically delayed, resulting in the reporting curve (red ×’s)—new reported cases per day. Bottom: the estimation procedure aims to undo this stochastic delay. Given observed report curve (left) we use a statistical estimator with the delay distribution to recover the underlying curve. (a) Assumed data generating process. (b) Estimation procedure.

