

Abstract
For many solid malignancies, lymph node (LN) involvement represents a harbinger of distant metastatic disease and therefore an important prognostic factor. Beyond its utility as a biomarker, whether and how LN metastasis plays an active role in shaping distant metastasis remains an open question. Here, we develop a syngeneic melanoma mouse model of LN metastasis to investigate how tumors spread to LNs and whether LN colonization influences metastasis to distant tissues. We show that an epigenetically instilled tumor-intrinsic interferon response program confers enhanced LN metastatic potential by enabling evasion of NK cells and promoting LN colonization. LN metastases resist T cell-mediated cytotoxicity, induce antigen-specific regulatory T cells, and generate tumor-specific immune tolerance that subsequently facilitates distant tumor colonization. These effects extend to human cancers and other murine cancer models, implicating a conserved systemic mechanism by which malignancies spread to distant organs.
Graphical Abstract

In brief
Facilitated by a tumor-intrinsic interferon response program, lymph node colonization promotes metastasis to distant organs by inducing broad alterations in tumor immunity and generating tumor-specific immune tolerance.
Introduction
For most cancers, distant organ metastases confer a diagnosis of stage IV disease and are the primary cause of cancer-associated deaths (Chaffer and Weinberg, 2011). These metastases, however, are typically preceded by LN involvement (Edge et al., 2010; Pereira et al., 2015), which serves as the most informative prognostic factor for most solid tumors (Leong et al., 2011). LNs are downstream drainage sites of tissues and tumors, and as such, their colonization is presumed to be largely unhindered and an intermediary step in dissemination to distant sites. Indeed, LN metastases can harbor the precursors of distant metastases (Brown et al., 2018; Pereira et al., 2018), yet reconstruction of tumor phylogenies suggests that such metastases may be of independent clonal origin (Enquist et al., 2014; Gundem et al., 2015; Haffner et al., 2013; Naxerova et al., 2017). Thus, the significance of LN metastases in the generation of distant metastases remains a matter of contention (Pereira et al., 2015).
LNs serve as education centers of the immune system where antigen presenting cells (APCs) prime T cells prior to their egress and elimination of cells harboring those antigens (von Andrian and Mempel, 2003). In cancer, presentation of tumor antigens in LNs by classical dendritic cell (cDC) subsets trafficking from primary tumors can elicit potent anti-tumor immunity (Binnewies et al., 2019; Roberts et al., 2016; Salmon et al., 2016), and immunotherapies typically require activation of immune responses in LNs (Spitzer et al., 2017; Wu et al., 2020; Yost et al., 2019). Yet these studies do not consider the possible role of LN involvement itself in tumor dissemination, despite its correlation with poor prognosis and further disease progression (Edge et al., 2010; Gershenwald et al., 1999; Jatoi et al., 1999). Thus, while immune cells can influence LN metastasis (Gu et al., 2019; Pucci et al., 2016), the mechanisms by which tumors escape anti-tumor immunity during LN metastasis and the effects of such metastases on further disease progression are largely unknown.
Here, we developed a model of LN metastasis that enabled us to interrogate the mechanisms by which tumors spread to LNs and the effects that such metastases have on colonizing distant tissues. We find that the LN metastatic tumors are epigenetically rewired, enabling LN colonization, suppression of antitumor immunity, and ultimately the generation of metastasis-promoting tumor-specific immune tolerance.
Results
Development of a syngeneic model of LN metastasis reveals a role for LN metastasis in the promotion of distant organ metastases
To develop a model of LN metastasis, we utilized an in vivo selection approach analogous to that used in other organ-specific metastasis models (Clark et al., 2000; Kang et al., 2003). We implanted mice with the minimally-metastatic syngeneic melanoma cell line B16-F0 (Fidler, 1973), generated de novo lines from any resultant LN metastases, and implanted them into naïve recipients (Fig. 1A). We repeated this process over nine generations yielding nearly 300 unique cell lines with increasing numbers derived from non-draining LNs in later generations (Fig. 1B and Fig. S1A). Later generation LN lines metastasized to LNs at a higher frequency than the parental line (Fig. 1C) despite exhibiting reduced growth kinetics (Fig. S1B, C). Co-injection of fluorescently labeled parental and sixth generation LN (LN6) cells subcutaneously (Fig. 1D) yielded LN metastases nearly entirely composed of LN6 cells, regardless of the fluorescent protein (Fig. 1E, F). In contrast to LNs, lungs frequently comprised tumors derived from both lines (Fig. 1G–I), demonstrating the LN specificity of the LN lines. Multiple mice exhibited more parental lung metastases despite having few, if any, parental cells within their LNs (Fig. 1I), and there was no correlation between the compositions of the LN and lung metastases (Fig. S1D).
Figure 1 |. LN metastases promote distant tissue metastasis.

(A) LN metastatic tumor lines were generated through serial in vivo selection of LN metastases over nine generations. (B) Phylogenetic relationships between the cell lines. IL/IR, left/right inguinal; AL/AR, left/right axillary; BL/BR, left/right brachial. (C) Incidence of metastases in inguinal, axillary, or brachial LNs for different cell lines (n denoted in parentheses). (D) Setup of metastatic competition assay. (E) Tumor line percentages in draining LNs by flow cytometry. Representative whole-tissue fluorescence images of excised LNs (F) and lungs (G). (H) Histology of a lung metastasis. Scale bar: 100μm. (I) Percentage of lung metastases derived from parental or LN6 lines compared to draining LN metastases in the same mice. (J) Lung metastases following transplantation of parental, LN6, or LN8 cells and tail vein injections of B16-F0-tdTomato. See also Figure S1.
As mice often exhibited lung metastases predominantly of parental origin despite LN metastases comprising LN6 cells (Fig. 1I), we hypothesized that LN metastases may affect distant metastasis through mechanisms other than serving as a reservoir of metastatic cells. We inoculated mice with either the parental or the LN lines, allowed the tumors to condition the host, and then queried lung metastatic seeding in these mice by injecting tdTomato-expressing parental cells (B16-F0-tdTomato) into their tail veins (Fig. 1J). Regardless of whether the tumors were implanted subcutaneously or directly into LNs, mice bearing LN tumors exhibited a greater lung metastatic burden than those bearing the parental tumors (Fig. 1J), indicating that the LN lines enhance the capacity of tumors to colonize distant organs.
LN metastases exhibit transcriptional and epigenetic profiles dominated by interferon-stimulated genes
We subjected tumor lines from different generations, LN sites, and phylogenetic lineages to RNA sequencing (RNA-seq) (Fig. S2A). Principal Component Analysis (PCA) and clustering of pairwise Spearman correlations revealed that the lines cluster closest to other lines of similar generations (Fig. 2A and Fig. S2B, C). We classified tumor lines as “early”, “mid”, “mid-late”, and “late” (Table S1).
Figure 2 |. LN metastases exhibit a transcriptional profile dominated by ISGs.
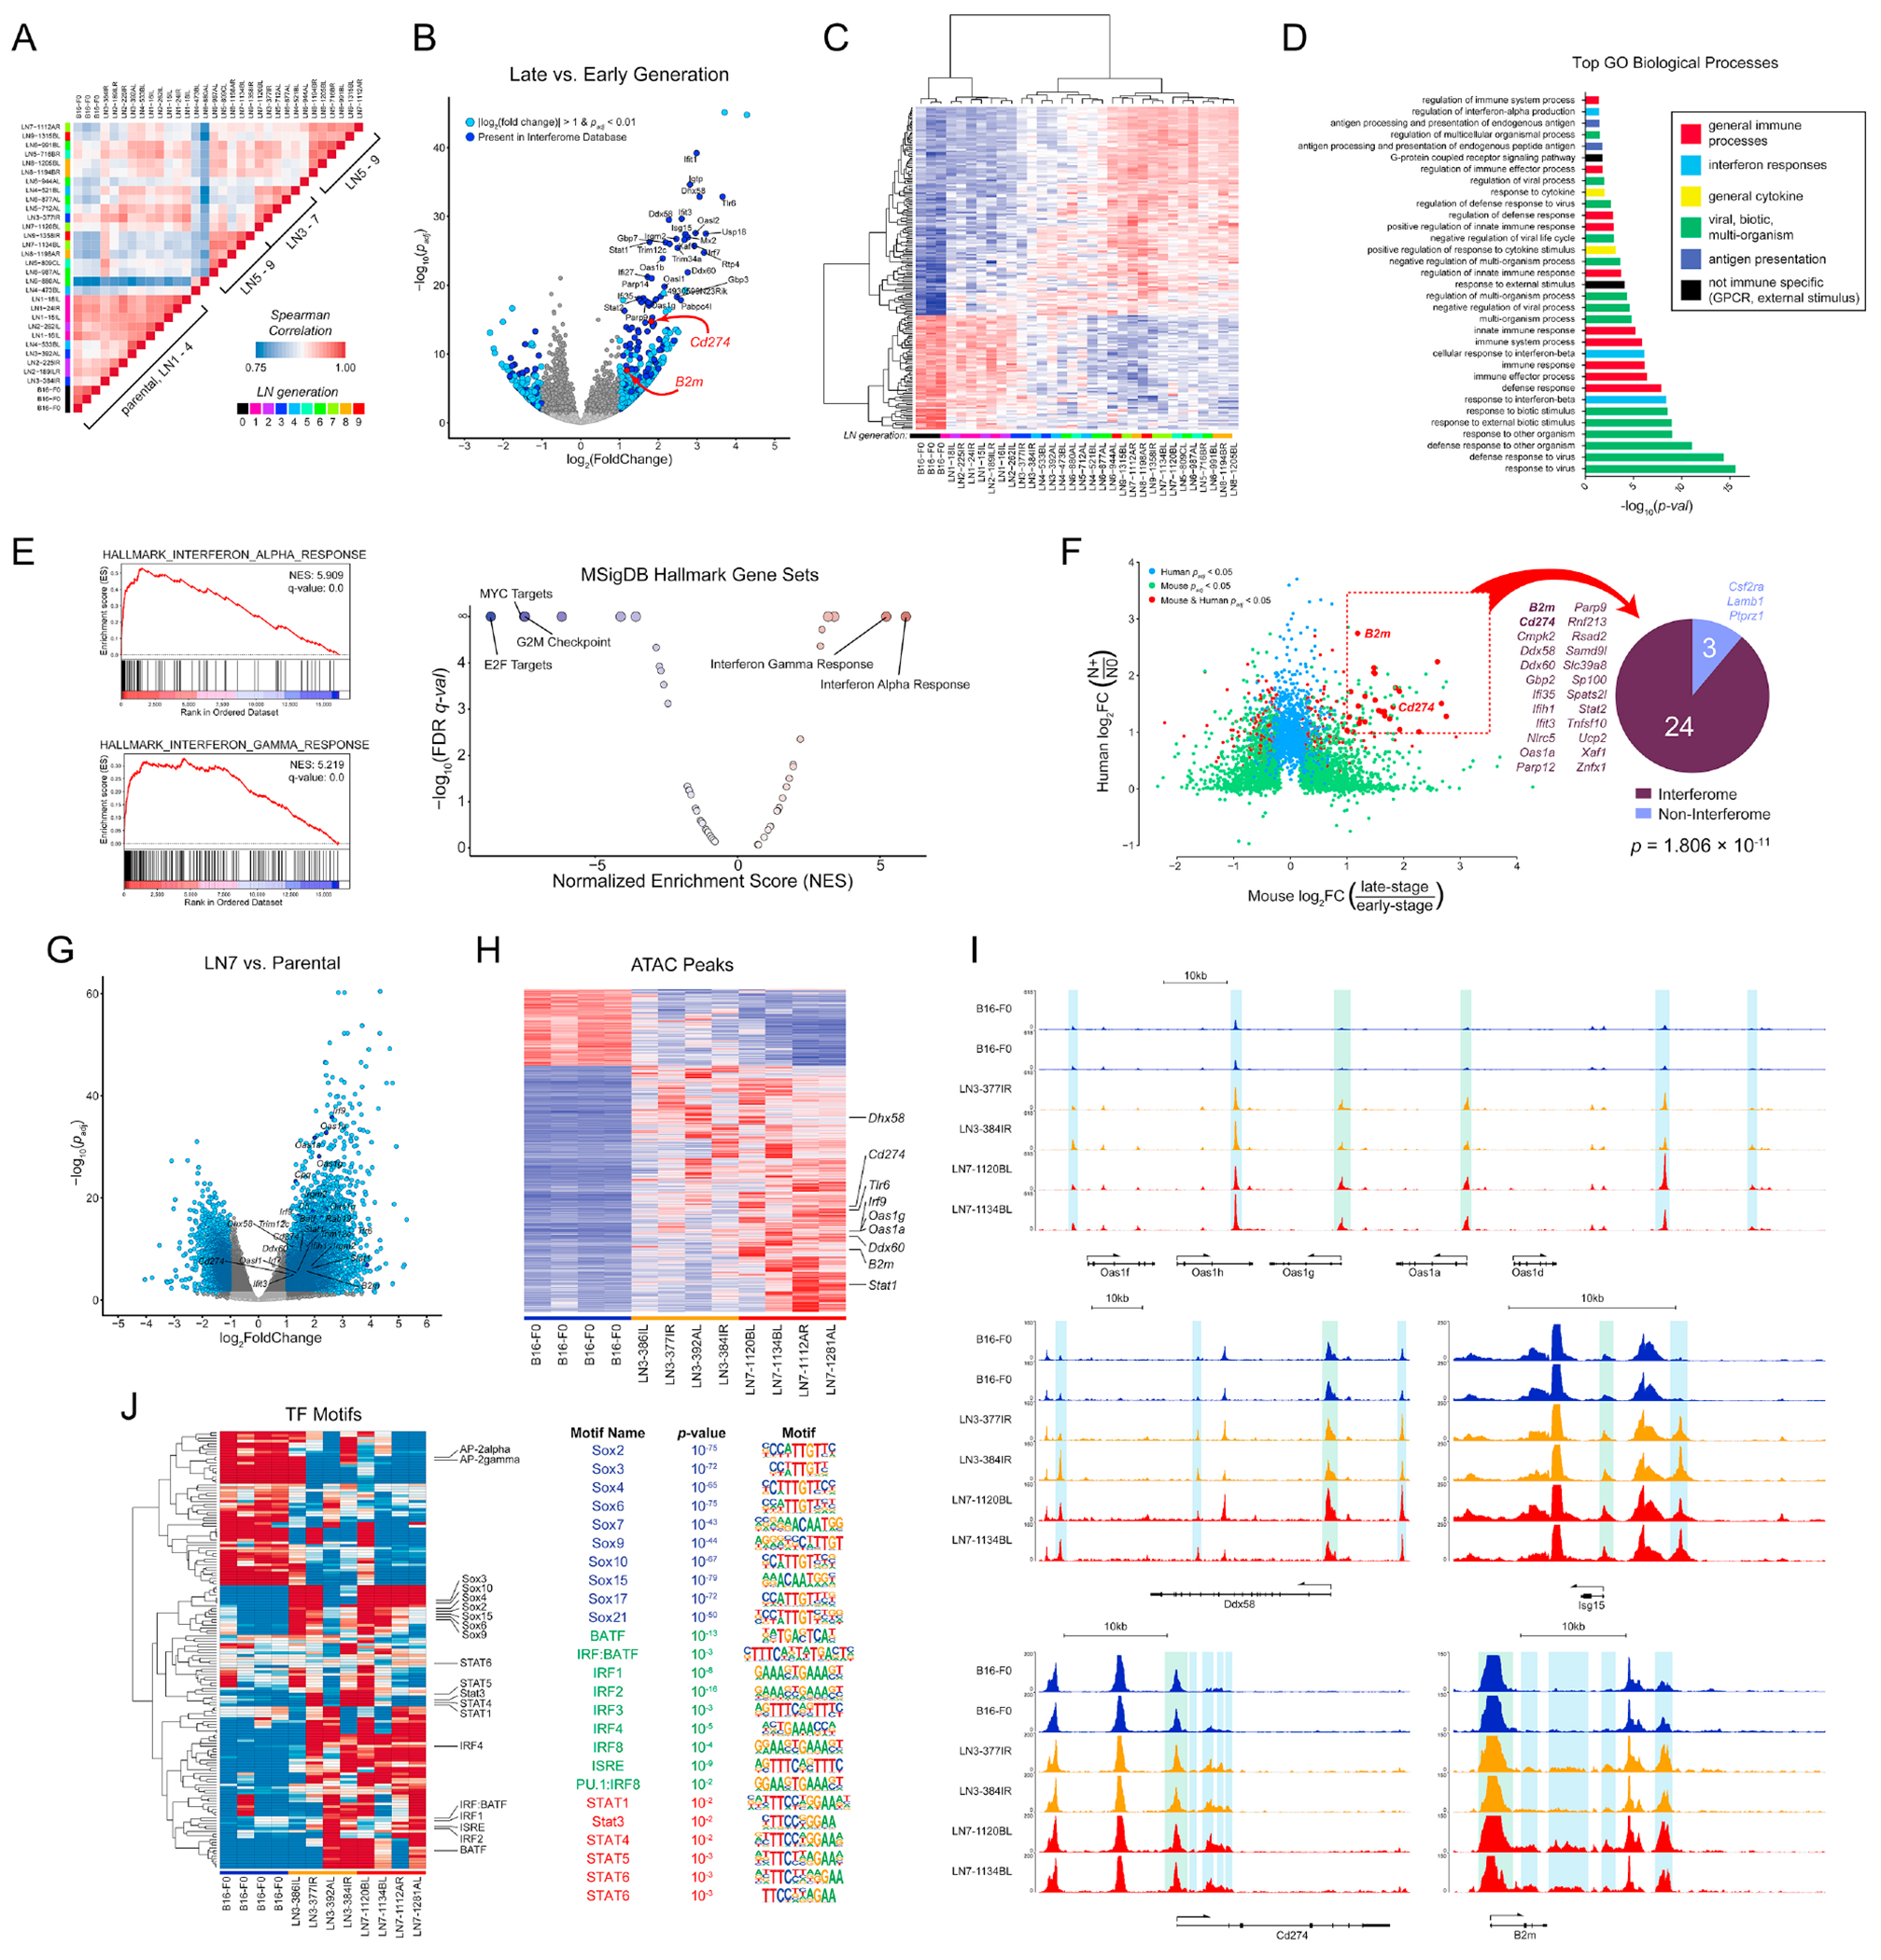
(A) Pairwise Spearman correlations of tumor line transcriptional profiles. (B) Changes in gene expression between late to early generation lines. Light blue: genes with |log2FC| > 1 and padj < 0.01. Dark blue genes are in the Interferome database. (C) Unsupervised hierarchical clustering of the top 200 differentially expressed genes between early and late generation lines. (D) Gene Ontology Biological Processes statistically associated with the LN-metastatic transcriptional signature. (E) GSEA of transcriptional profiles using the Hallmark Gene Set of MSigDB. NES, normalized enrichment score; FDR, false discovery rate. (F) Differentially expressed genes in tumor cells of HNSCC patients and the murine melanoma lines. N0: patients without LN metastases (n = 4); N+: patients with LN metastases (n = 10). Pie chart: number of shared genes present (dark blue) or absent (light blue) in the Interferome database. (G) Changes in chromatin accessibility between LN7 and parental lines. (H) Hierarchical clustering of chromatin accessibility between parental, LN3, and LN7 lines. (I) Chromatin accessibility at various ISG loci. Green shading: transcription start sites; blue shading: cis-regulatory regions. (J) ChromVAR analysis of transcription factor motif activity. See also Figure S2.
Differential gene expression (DGE) analysis between the late and early generation lines (or LN8 and parental lines) identified hundreds of differentially expressed genes (Fig. 2B, S2D). Unsupervised hierarchical clustering revealed clear segregation between the late generation and parental lines (Fig. 2C) with mid-generation lines exhibiting an intermediate level of expression (Fig. 2C and Fig. S2G). In agreement with recent reports (Makohon-Moore et al., 2017; Reiter et al., 2018), whole exome sequencing (WES) revealed no increase in mutations of known melanoma driver genes (Hodis et al., 2012) (Fig. S2E). Nearly all of the Gene Ontology (GO) Biological Processes associated with the differentially expressed genes were related to the immune response (Fig. 2D), and Gene Set Enrichment Analysis (GSEA) identified type I and II interferon (IFN) responses as the most highly enriched (Fig. 2E and Fig. S2F), while the most negatively enriched sets were related to cell cycle (Fig. S1B, C). Furthermore, 33.8% of the differentially expressed genes are present in the Interferome v2 database (Rusinova et al., 2013) (Fig. 2B and Fig. S2D). We next performed RNA-seq on sorted malignant cells from tumors of head and neck squamous cell carcinoma (HNSCC) patients. DGE analysis between patients with and without LN metastases revealed that 89% of the upregulated genes conserved between mice and humans are interferon related (Fig. 2F).
Chronic IFN exposure can induce constitutive expression of interferon-stimulated genes (ISGs) through epigenetic reprogramming (Benci et al., 2016). Thus, we performed Assay for Transposase-Accessible Chromatin using sequencing (ATAC-seq) on the parental, third, and seventh generation lines. PCA of the ATAC-seq profiles revealed that the samples predominantly clustered by generation, indicating that the parental and LN metastatic lines are epigenetically distinct (Fig. S2H). Differential peak analysis revealed wholescale remodeling of the epigenome, indicating a bias toward opening of chromatin during LN metastasis (Fig. 2G, H and Fig. S2I), and many of the conserved open peaks were adjacent to ISG loci (Fig. 2G–I). Increases in accessibility occurred at both the ISG transcription start sites and proximal and distal cis-regulatory elements (Fig. 2I).
TF motif activity analysis revealed increased activity of SOX family motifs, including Sox2 and SoxF family members in the late-generation LN lines (Fig. 2J). Sox2 and SoxF are regulators of stem cell states, tumor progression, lymph vasculature, and metastasis (Duong et al., 2012; Grimm et al., 2020; Malladi et al., 2016; Neumann et al., 2011; Russo et al., 2015; Takahashi and Yamanaka, 2006), indicating enrichment of general metastatic programs. The LN metastases also exhibited activity of a range of IFN-related motifs, including the interferon-stimulated response element (ISRE) and other IRF and Stat TF binding motifs (Fig. 2J), pointing to a role for epigenetic reprogramming in driving the LN metastatic phenotype.
Exposure to exogenous IFNs is required for the acquisition, but not maintenance, of the ISG signature and LN metastasis
While signaling induced by type I and II IFNs activates hundreds of genes (Rusinova et al., 2013; Shaw et al., 2017) (Fig. 2B, S2D, G), the IFN-inducible genes for programmed death ligand 1 (PD-L1) (Cd274) and the major histocompatibility class I (MHC-I) subunit beta-2 microglobulin (B2m) are noteworthy given their important roles in regulating immune responses to tumors (Pardoll, 2003; Pardoll, 2012) (Fig. 2B and Fig. S2D). Cd274 and B2m transcript abundance exhibit gradual increases across LN line generations (Fig. 3A) and results in increased surface expression of PD-L1 and the classical MHC-Ia molecules H-2Kb and H-2Db (Fig. 3B). This upregulation was consistent across phylogenies (Fig. 3A), was maintained in vivo (Fig. S3A), and was stable in culture in the absence of exogenous IFNs (Fig. S3B). Examination of the ATAC profiles at the Cd274 and B2m loci revealed increased accessibility of cis-regulatory regions (Fig. 2I). In particular, we noted increases in putative regulatory elements distal to the Cd274 promoter, analogous to those found in human cancers (Corces et al., 2018).
Figure 3 |. Exposure to exogenous IFNs is required for the acquisition, but not maintenance, of the LN metastasis-promoting ISG signature.

(A) Transcript levels of B2m and Cd274. (B) H-2Kb, H-2Db, and PD-L1 on parental (black), LN6 (red), IFNR knockout parental (blue), and IFNRKOLN1 (blue-green). Shaded histograms: cells stimulated with IFN-α and IFN-γ. (C) Number of mice exhibiting LN metastases following subcutaneous implantation of the parental vs. the IFNR knockout parental (left) and LN1 lines from the wild-type parental vs. LN1 lines from the IFNR knockout parental (IFNRKOLN1) (right). (D) Knockout versions of the parental and LN6-987AL lines were generated for Ifnar1, Ifngr1, Stat1, and a control sgRNA. An Ifnar1/Ifngr1 double-knockout line was also generated for the parental, implanted into mice, and new lines were generated from the resultant LN metastases (IFNRKOLN1). (E) Surface H-2Kb, H-2Db, and PD-L1 on parental and LN6 control and knockout lines with or without IFN-α or IFN-γ stimulation. (F-G) RNA-seq of the knockout lines. (F) Transcript levels of H2 genes and ISGs in the wild-type and knockout lines (TPM, Transcripts Per Kilobase Million). (G) Unsupervised hierarchical clustering of the variably expressed genes in the knockout lines. (H) LN metastases in mice implanted with LN6-987AL engineered with control or different Stat1 sgRNAs (sgStat1-1 and sgStat1-3). See also Figure S3.
RNA-seq revealed no expression of any of the IFNs by the tumor cells, and constant expression of the IFN receptors (IFNRs) across generations (Fig. S3C). Furthermore, knockout of Ifnb1 revealed no differences in the PD-L1 and MHC-I levels (Fig. S3D). Nonetheless, stimulation of the parental and LN6 lines with IFN-α and IFN-γ induced increased expression of PD-L1 and MHC-I beyond even the basal levels of the LN lines (Fig. 3B). While various Stat genes were upregulated (Fig. S3E), the LN lines did not exhibit consistent increases in phospho-Stats (pStats) (Fig. S3F). Stimulation with IFN-α or IFN-γ both induced pStat1 and pStat3 levels beyond the basal levels (Fig. S3F). Thus, elevation in basal ISG expression in the LN lines is not a consequence of increased total or phosphorylated Stats but rather epigenetic rewiring resulting in increased access to Stat TF binding sites.
To ask whether exposure to IFNs was originally required for the acquisition of the ISG signature, we knocked out both Ifnar1 and Ifngr1 in the parental line, ablating its ability to respond to IFNs (Fig. 3B). When implanted into mice, only 10% of the IFNR double-knockout (DKO) tumors yielded LN metastases as compared with 43% of wild-type tumors (Fig. 3C). We generated two first generation (LN1) cell lines from LN metastases of the IFNR DKO tumors (IFNRKOLN1 lines). When re-implanted into new recipients, these IFNRKOLN1 tumors again metastasized to LNs at much lower frequencies (14%) compared to wild-type LN1 tumors (92%) (Fig. 3C). While MHC-I was upregulated in the IFNRKONLN1 lines compared with the parental, PD-L1 was not (Fig. 3B), suggesting that the acquisition of portions of the ISG signature requires conditioning from IFNs. The IFNRKOLN1 lines were still unresponsive to IFN stimulation, demonstrating that the upregulation was not due to expansion of an unedited subpopulation (Fig. 3B).
We next knocked out Ifnar1, Ifngr1, or Stat1 in the parental and LN6 cells (Fig. 3D). Stimulation of the control parental and LN6 cells with either IFN-α or IFN-γ induced elevated expression of H-2Kb, H-2Db, and PD-L1, while knockout of Ifnar1 and Ifngr1 abolished their ability to respond (Fig. 3E). Knockout of Stat1 reduced responses to IFN-γ to levels equivalent to those of the unstimulated cells, while only partially reducing responses to IFN-α stimulation, demonstrating that additional Stat family members contribute to type I IFN signaling, as expected (Fig. 3E). Knockout of the IFNRs and Stat1 had only modest effects on the basal PD-L1 and MHC-I levels in the parental cells (Fig. 3E and Fig. S3G). In contrast, while knockout of Ifngr1 in the LN6 cells did not affect their levels, knockout of Ifnar1 and Stat1 both reduced MHC-I levels to nearly those of the parental and slightly reduced PD-L1 levels as well (Fig. 3E and Fig. S3G). These findings suggest that type I IFNR might play a role in maintaining stable ISG expression. We additionally performed RNA-seq on all of the knockout lines (Fig. 3F, G). While knockout of Ifngr1 had a modest effect on the expression levels of some ISGs, knockout of Ifnar1 or Stat1 reduced expression of a subset to the parental levels (Fig. 3F). The reliance of a portion of the IFN signature upon the type I IFNR is noteworthy given the absence of the ligand (Fig. S3B–D). The cytoplasmic tail of Ifnar1 does not directly associate with the Jaks and Stats (Zanin et al., 2021), suggesting that Ifnar1-Ifnar2 dimerization may occur in the absence of ligand at a frequency sufficient to maintain a basal level of Stat phosphorylation.
Not all upregulated genes, however, required type I IFNR signaling for their expression. Clustering of the differentially expressed genes across the various knockout lines yielded four distinct clusters of genes (Fig. 3G). Genes in cluster I are downregulated during LN metastasis and likely reflect changes in adhesion and differentiation. Those in cluster III require Ifnar1 to maintain their upregulation. Genes in cluster II were at least partially upregulated in the IFNRKOLN1 lines and maintained in the Ifnar1 knockouts, suggesting that IFN signaling was not required for their upregulation during LN metastasis. These include the H2 genes, which is consistent with the increased MHC-I levels on the INFRKOLN1 lines (Fig. 3B) and indicates that regulation of the H-2 subunits occurs independently of IFN signaling. Finally, genes in cluster IV are upregulated and are not reliant upon IFNR signaling for their expression yet are not upregulated in the IFNRKOLN1 lines, indicating that their initial upregulation was a consequence of IFN signaling. These genes include Cd274, which is consistent with the observed lack of surface PD-L1 expression on the IFNRKOLN1 lines (Fig. 3B) and the maintained PD-L1 expression on the LN6-sgIfnar1 line (Fig. 3E and S3G). Thus, exposure to IFNs during LN metastasis induces the acquisition of an ISG program that is stably conferred through epigenetic rewiring and is partially reliant upon type I IFNR signaling even in the absence of exogenous IFNs (Fig. S3H). Finally, we implanted the Stat1 knockout LN6 tumors into mice and found that they yielded less LN metastasis, demonstrating that the ISG program plays a critical role in LN metastasis (Fig. 3H).
Expression of MHC-I and PD-L1 facilitates LN metastasis by promoting NK evasion and T cell suppression
To understand the factors that contribute to the initial spread of tumor cells to LNs, we identified genes differentially expressed between the parental and first LN generation (Fig. 4A). Many MHC-I genes were strongly upregulated in the first-generation lines (Fig. 4B and Fig. S4A). Natural Killer (NK) cells are innate lymphocytes that can attack tumors by recognizing loss of MHC-I or overexpression of NKG2D ligands (Raulet, 2003; Wu and Lanier, 2003). Thus, we queried the susceptibility of multiple LN lines to NK cell cytotoxicity and found that they were three- to five-fold less susceptible to killing than the parental tumor (Fig. 4C). Additionally, depletion of NK cells in mice bearing the parental tumors increased LN metastasis (Fig. 4D).
Figure 4 |. Upregulation of MHC-I and PD-L1 promotes LN metastasis.

(A) Unsupervised clustering of differentially expressed genes in the parental and LN1 tumor lines. (B) Expression of H2 genes. (C) Specific lysis of parental, LN6, and LN7 lines co-cultured with NK cells. (D) LN metastases in wild-type mice depleted of NK cells and implanted with B16-F0-Cd274. (E, F) Spontaneous LN metastasis of LN6-987AL-sgB2m following implantation subcutaneously (E) or directly into LNs (F). (G) LN metastasis of B2m knockout tumors in NK cell-depleted mice. (H) PD-L1, H-2Db, and H-2Kb on parental, LN1, and LN6 cells. (I) PD-L1 and H-2Kb on the parental, three LN6, and the lung metastatic B16-F10 lines. (J) PD-L1 and MHC-I on the parental and LN1 lines generated in wild-type (red), Rag2−/− (green), and Rag2−/−;Il2rg−/− (blue) mice. (K) LN metastasis of LN6-sgCd274 tumors. (L) LN metastasis of LN6-sgCd274 in T cell depleted mice. (M) LN metastases in mice implanted with B16-F0 transduced to express PD-L1. (N) PD-L1 and H-2Db expression by a KrasG12D;Trp53−/−; PDAC line and a corresponding LN metastasis line. (O) PD-L1 in a HNSCC primary MOC2 tumor and LN metastases. Scale bars: 50μm. (P) PD-L1 staining on primary tumors and LN metastases of human melanoma tissue microarrays. (Q) CD274, HLA, and B2M transcripts in human HNSCC tumor cells. N0 (n = 4); N+ (n = 10). Whiskers, min and max. (R) CD274 expression in the TCGA SKCM dataset of primary melanomas (n = 415), LN metastases (n = 224), and distant metastases (n = 68). Whiskers, 10th to 90th percentile. Adjusted p-values in (B) calculated by the Wald test by the DESeq2 package and P-values in (G) calculated by One-Way ANOVA with Tukey’s post hoc test. See also Figure S4.
Evaluation of the NKG2D ligand transcripts revealed only modest differences in expression occurring in only a subset of phylogenies (Fig. S4B). Incubation of various lines with NKG2D-Fc fusion proteins revealed slight increases in NKG2D binding to the LN lines compared to the parental (Fig. S4C). While alterations in NKG2D ligands may attenuate NK cell immunosurveillance (Deng et al., 2015; Oppenheim et al., 2005), their modest increase seems unlikely to be the dominant mechanism of NK evasion.
In contrast, H2 genes were rapidly upregulated in the LN lines (Fig. 4B, S4A), suggesting a potential early adaptation by which tumors evade NK recognition while disseminating to LNs. Knockout of B2m in an LN6 line ablated MHC-I expression (Fig. S4D), and resulted in reduced LN metastasis (Fig. 4E, F), despite equivalent primary tumor burden (Fig. S4E). Furthermore, depletion of NK cells rescued the metastatic capacity of the B2m knockout tumors (Fig. 4G), demonstrating the critical role of MHC-I upregulation in NK evasion during early LN metastasis.
Unlike the H2 genes (Fig. 4B and S4A), B2m expression increased gradually across the generations, in concert with the other ISGs (Fig. 3A). Furthermore, there is no master regulator of the H2 loci and multiple mechanisms control their expression independently from IFN signaling (Jongsma et al., 2019). Indeed, while the ISGs such as PD-L1 exhibit a gradual increase in protein expression across LN generations, surface levels of H-2Db increased markedly by the first generation (Fig. 4H). β2m is a highly abundant protein even in the basal state, with expression levels that far exceed the H2 genes (Fig. 3A), indicating that the initial levels of MHC-I are regulated by H2 protein abundance, and IFN signaling provides only minor contributions to MHC-I levels in later generation lines (Fig. S4F). Thus, the immediate upregulation of MHC-I occurs independently of IFN signaling, as is consistent with its increases on the IFNRKOLN1 lines (Fig. 4B, F, G).
Upregulation of MHC-I and PD-L1 was conserved across tumor phylogenies (Fig. 4I and S4G). By contrast, B16-F10, a lung-metastatic descendent of the parental B16-F0 line (Fidler, 1973), does not exhibit increases in PD-L1 or MHC-I, suggesting that these changes are specific to LN metastases (Fig. 4I and S4G). We next generated lines from LN metastases in immunocompromised mice, including a Rag2−/− mouse, which lacks B and T cells, and a Rag2−/;Il2rg−/− mouse, which lacks B, T, and NK cells. In comparison to LN1 lines from wild-type mice, the line derived from the Rag2−/− mouse did not upregulate PD-L1, though it did upregulate MHC-I molecules (Fig. 4J), while the line derived from the Rag2−/−;Il2rg−/− mouse exhibited no upregulation of either PD-L1 or MHC-I (Fig. 4J). Thus, the upregulation of MHC-I is likely a response to NK cell pressure, while upregulation of PD-L1 and other ISGs are likely a response to adaptive immunity.
PD-L1 plays a critical role in regulating T cell responses and is one of the most important targets of ICB (Brahmer et al., 2012). Knockout of PD-L1 from the LN metastatic tumors (Fig. S4H) resulted in fewer LN metastases (Fig. 4K). This effect could be abrogated through depletion of T cells (Fig. 4L), suggesting that upregulation of PD-L1 enhances LN metastasis through suppression of T cell responses. Finally, overexpression of PD-L1 in the parental tumor enhanced LN metastasis (Fig. 4M).
We also generated a line from a LN metastasis of a KrasG12D/+;LSL-Trp53R172H/+;Pdx-1-Cre pancreatic ductal adenocarcinoma (PDAC) tumor (Tseng et al., 2010) and found it to exhibit higher PD-L1 and MHC-I expression (Fig. 4N), as did a LN metastases from the MOC2 syngeneic model of HNSCC (Judd et al., 2012) (Fig. 4O). A higher percentage of LN metastases from melanoma patients had positive PD-L1 staining than primary tumors (Fig. 4P). Furthermore, tumor cells isolated from HNSCC patients exhibited higher levels of the MHC-I and PD-L1 transcripts in patients with LN metastases (Fig. 4Q). Analysis of Cd274 transcripts in the melanoma (SKCM) TCGA dataset also revealed their elevation in LN metastases compared to primary tumors (Fig. 4R). Moreover, similar to our murine data (Fig. 4I), PD-L1 was lowest in distant metastases, suggesting that this phenotype is LN specific in both mice and humans.
LN colonization induces broad alterations in the local immune repertoire
Mice bearing LN tumors exhibited reductions in T to B cell ratios in the involved nodes (Fig. 5A) and increases in regulatory T cell (Treg) fractions (Fig. 5B). We performed single-cell RNA-seq (scRNA-seq) on the LNs of mice with parental tumors, LN6 tumors, or neither. Seurat clustering (Butler et al., 2018) and visualization by uniform manifold approximation and projection (UMAP) dimensional reduction (Becht et al., 2018) identified 20 distinct cell clusters (Fig. 5B and S5A). LN6 tumors induced marked shifts in the B and T cell clusters (Fig. 5D–F). In particular, the LN6 tumors induced expansion of B cells in clusters “0” and “6” (Fig. 5D), the latter of which was distinguished by its increased ISG expression (Fig. 5G, H), reaffirming the induction of IFN signaling upon initial dissemination.
Figure 5 |. LN colonization induces broad alterations in the local immune repertoire.

T : B cell ratios (A) and Treg percentages (B) in draining LNs of mice bearing parental or LN tumors. (C) UMAP visualization of scRNA-seq clusters in the LNs of mice bearing no tumors, parental tumors, or LN6 tumors. Relative fractions of distinct B cell clusters (D), CD4 T cell clusters (E), and CD8 T cell clusters (F). (G) Unsupervised hierarchical clustering of differentially expressed genes across B cell clusters. (H) Expression levels of ISGs across B cell clusters and (I-K, M) of various genes for different cell clusters in mice without tumors, parental tumors, and LN6 tumors. (L) Activated (top) and PD-1+ (bottom) CD8 T cells in the LNs by flow cytometry in mice with no tumors (naïve), primary tumors only (LN−), or primary tumors and LN metastases (LN+). (N) Myeloid populations and PD-L1 levels in the LNs of naïve, LN−, and LN+ mice. (O) Immune populations in LNs of BrafV600E mice. cDC PD-L1 p-values in (N) calculated by Two-Way ANOVA. See also Figure S5.
CD4 and CD8 T cells were composed of multiple clusters (Fig. 5C, E, F). The presence of tumors induced a shift away from the T cell clusters with features of naïve or resting T cell populations towards the activated T cell clusters (Fig. 5E, F and S5B, C). These effects were most notable in the CD8 T cell compartment in mice bearing LN6 tumors (Fig. 5F). NK cells from the LN6 tumor-bearing mice exhibited features consistent with reduced activation (Fig. 5l). While cluster “8” has features consistent with classical activated effector CD8 T cells (e.g., expression of Prf1, Cxcr3, and Cd44), cluster “13” is instead distinguished by its highly elevated expression of Stat1 (Fig. S5C) and is particularly enriched in the LN6 condition (Fig. 5F). Furthermore, the cluster “8” cells in the LN6 condition have lower Cxcr3 expression, potentially suggestive of reduced activation (Fig. 5J), while the cells in cluster “13” trend towards increased expression of Tox , a regulator of T cell exhaustion (Khan et al., 2019), in the LN6 condition (Fig. 5K). Flow cytometric analysis confirmed the increase in CD44+CD62L− activated CD8 T cells as well as increases in PD-1+ fractions of the CD8 T cells (Fig. 5L), suggesting that LN metastasis may induce exhaustion.
LN6 tumors induce a shift away from naïve Tregs towards activation, with decreases in Ccr7 and Sell and increases in activation genes and ISGs (Fig. 5M). The Tregs also exhibited reductions in Bach2, which prevents Treg differentiation (Sidwell et al., 2020), and Satb1, which affects development of thymic Tregs (Chorro et al., 2018), suggesting a shift toward peripherally-induced Tregs.
As the myeloid populations represent only a small fraction of the total cells within LNs, we analyzed them by flow cytometry, comparing mice with LN metastases to those without or tumor-naïve mice. LN metastasis induced increases in both the fractions and total numbers of macrophages and neutrophils in involved LNs (Fig. 5N and S5E). These macrophages also expressed higher levels of PD-L1 (Fig. 5N). Neutrophils in mice bearing the LN6 tumors expressed a variety of genes associated with immature or immunosuppressive phenotypes (e.g., Arg2, Il1b, and Wfdc17) (Fig. S5D). Within the dendritic cell (DC) compartment, LN metastasis induced a shift from MHC-IIhiCD11cint migratory DCs (mDCs) toward MHC-IlintCD11chi resident DCs (rDCs) (Fig. 5N and S5E) and reductions in cross-presenting Xcr1+ classical DC type 1 (cDC1) cells. Within the mDC and rDC subsets, there was a reduction in CD103+ and CD8α+ cDC1s, respectively. Instead, the rDC subset was dominated by CD11b+CD8α− cells (Fig. S5E). In general, mice bearing LN metastases had higher quantities of CD11b+ DCs (Fig. 5N and S5E). Furthermore, CD11b+SIRPα+ cDC2s expressed higher levels of PD-L1 compared to Xcr1+ cDC1s. Thus, the alterations within the myeloid compartment are consistent with an immunosuppressive microenvironment.
We additionally analyzed alterations in immune repertoires in an autochthonous BrafV600E GEMM of melanoma (Dankort et al., 2009) and found that the immune repertoires of the involved nodes demonstrated alterations analogous to those seen in our transplantable models (Fig. 5O and S5F).
LN metastases alter immune responses to promote distant metastasis
We next implanted either the parental or LN tumors into both wild-type and Rag2−/−;Il2rg−/− mice. While growth kinetics of the parental tumors were somewhat enhanced, they were nearly equivalent for the LN tumors (Fig. S6A, B). In contrast, the immunocompromised mice bearing the parental or LN tumors exhibited far more lung metastases (Fig. 6A), suggesting that lymphocytes play a central role in preventing distant metastasis, even when incapable of eliminating primary tumors. Similarly, MMTV-PyMT breast cancer mice exhibited a greater lung metastatic burden when crossed to the Rag2r+ background (Fig. S6C).
Figure 6 |. LN metastases suppress T cell responses and induce Tregs.
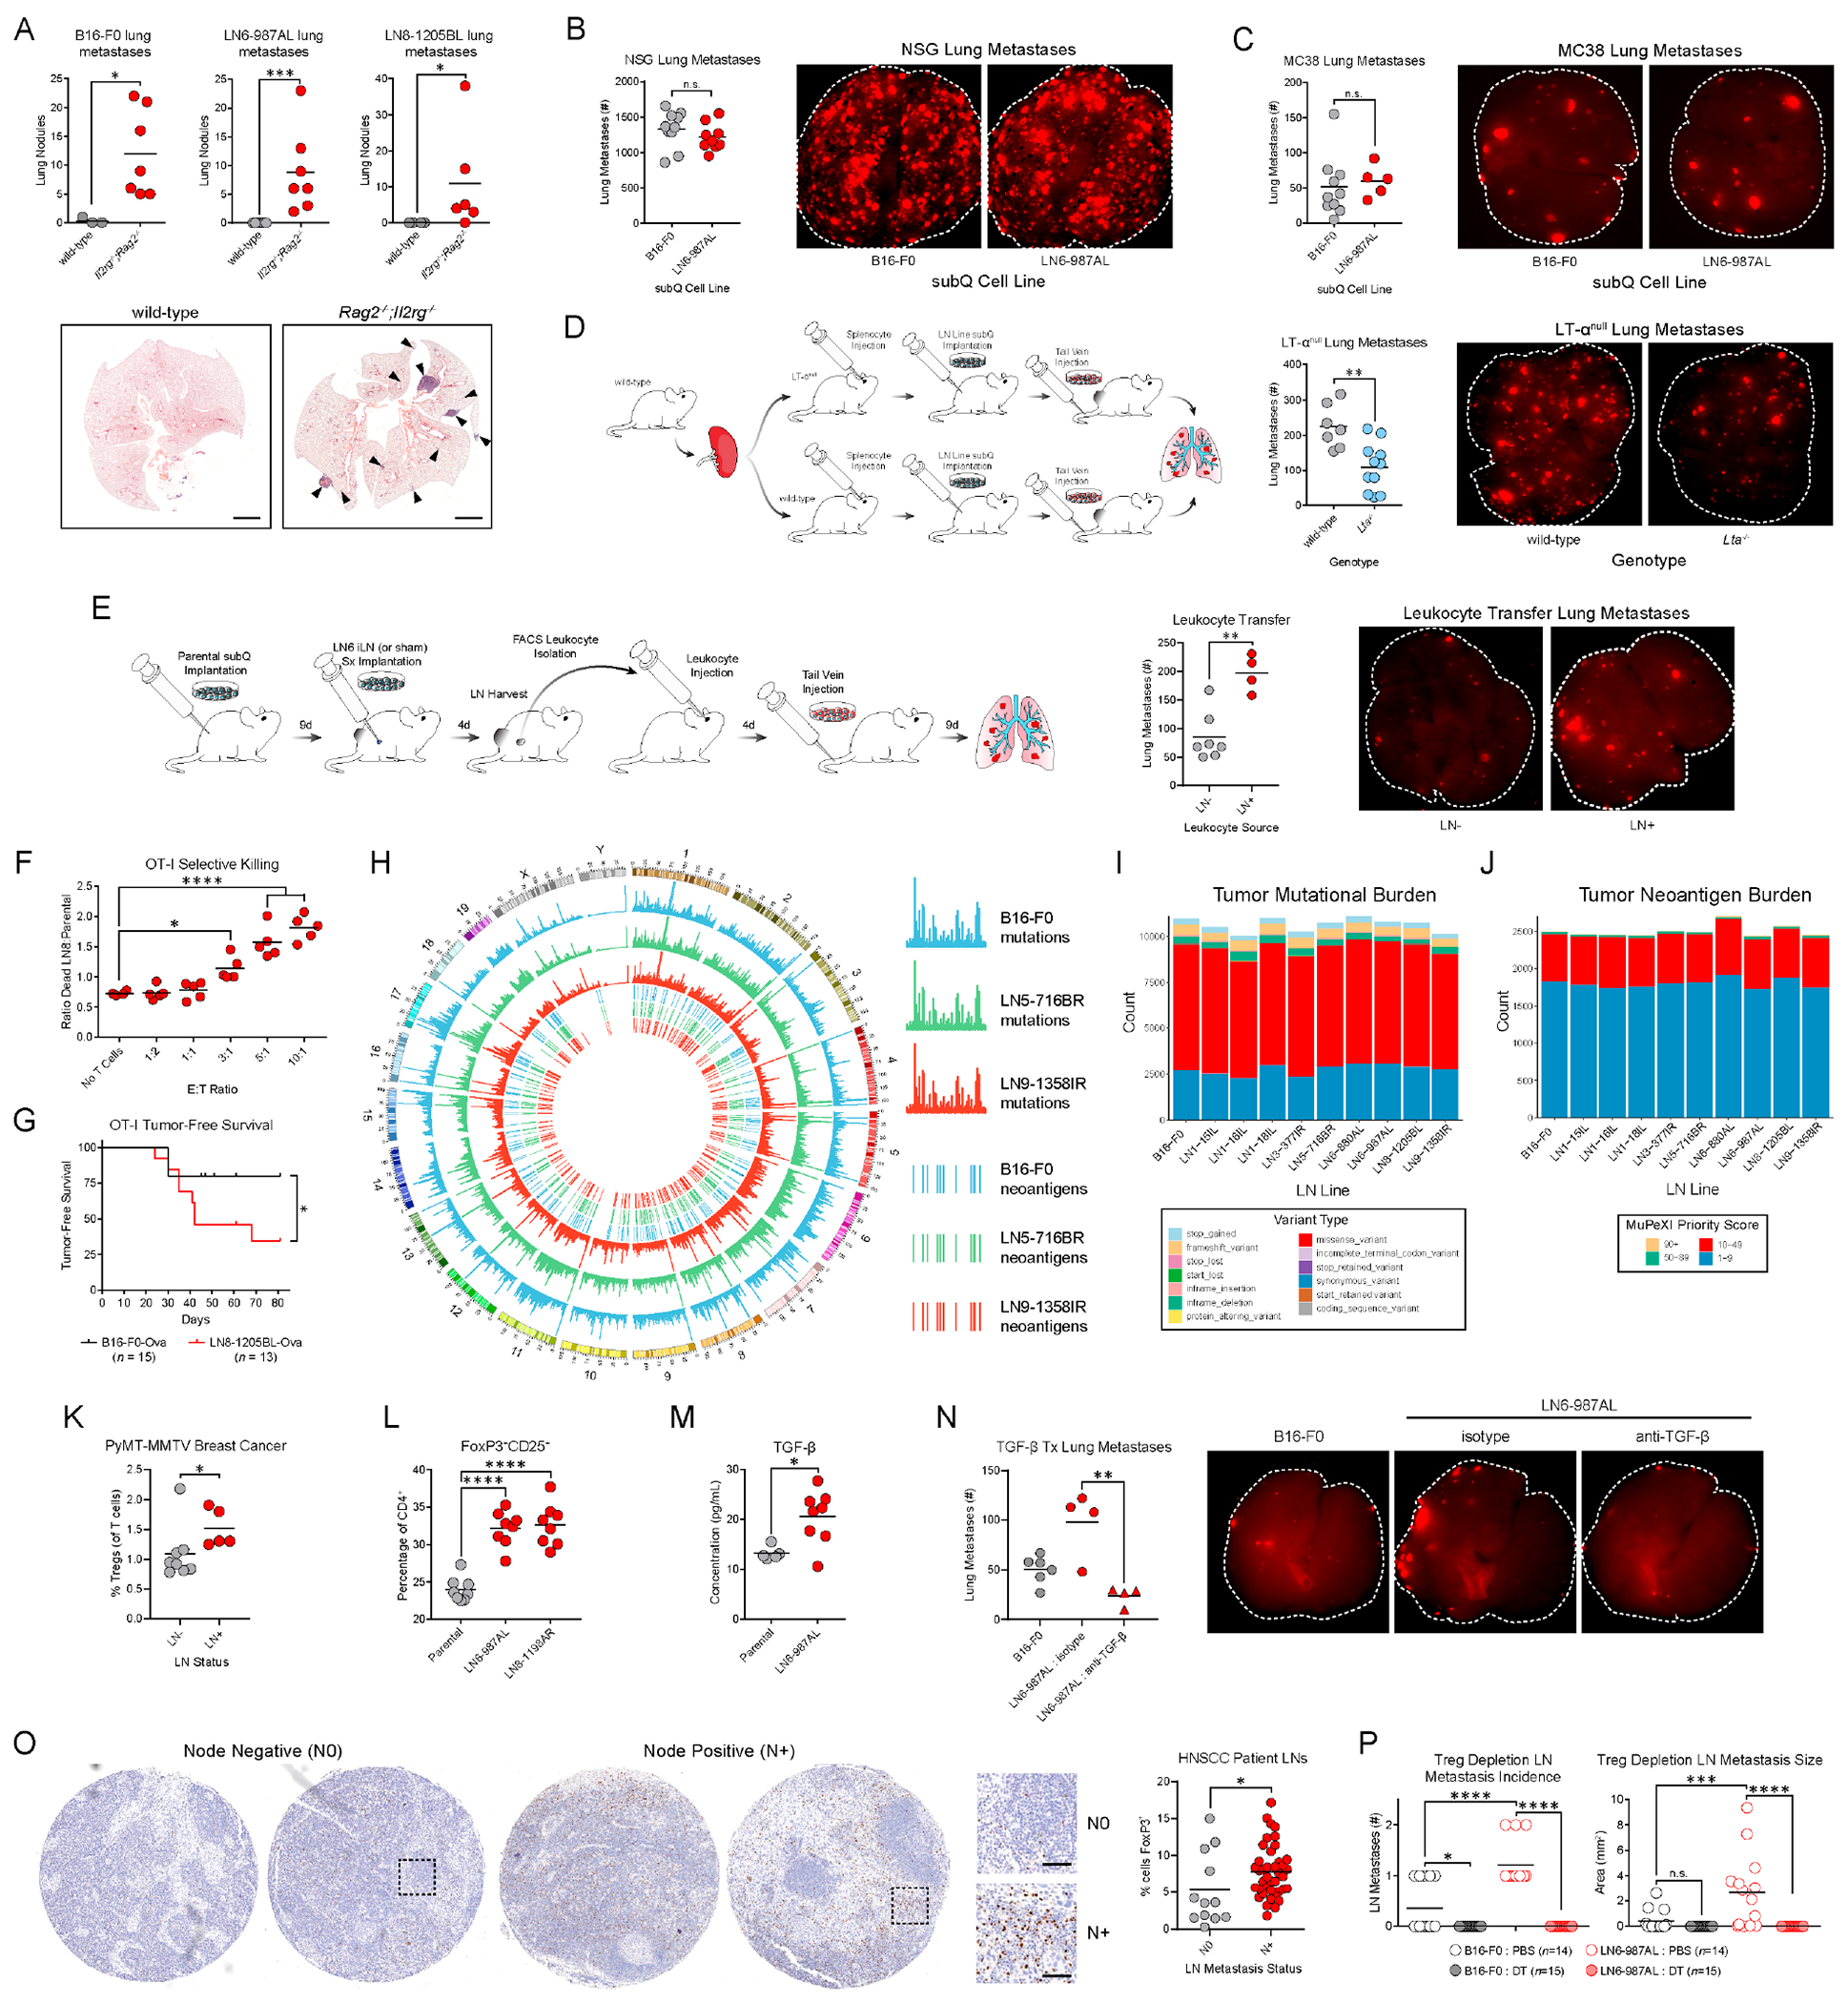
(A) Spontaneous lung metastases in wild-type and Rag2−/−,Il2rg−/− mice of the parental, LN6-987AL, or LN8-1205BL tumor lines. Scale bars: 2mm. (B) Parental or LN6 tumor cells were implanted into NSG mice, followed by tail vein injections of B16-F0-tdTomato. (C) Analogous experiments were performed in wild-type mice with tail vein injections of MC38. (D) Wild-type splenocytes were transferred into wild-type or LTαnull mice. LN6 tumor cells were implanted into their flanks and B16-F0-tdTomato cells were subsequently injected intravenously. (E) Parental tumors were implanted subcutaneously and LN6-987AL injections (LN+) or sham injections (LN−) were performed on the draining LNs. LN leukocytes were transferred to tumor-naïve recipients that were subsequently challenged intravenously with B16-F0-tdTomato. (F) B16-F0-Ova and LN8-Ova cells labeled with distinct fluorescent dyes were mixed at a 1:1 ratio. OT-I CD8 T cells were added to the cultures at various effector to target (E:T) ratios, and tumor cells viability was evaluated. (G) OT-I mice were implanted with B16-F0-Ova or LN8-Ova cells. Kaplan-Meier plot depicts the time mice remain tumor-free following implantation. (H) Locations of mutations and neoantigens across the genome for the parental (blue), LN5 (green), and LN9 (red) lines. Outer three tracks: mutation counts. Inner three tracks: top candidate neoantigens (score of 10 or higher) determined using MuPeXI (Bjerregaard et al., 2017). (I) Total mutation counts. (J) Total neoantigen counts. (K) Treg percentages in draining LNs of MMTV-PyMT breast cancer mice with or without LN metastases. (L) Treg induction following culture of naïve CD4 T cells with the parental, LN6, or LN8 lines. (M) TGF-β in the serum of tumor-bearing mice. (N) Analogous experiments to (B) were performed in wild-type mice where mice bearing LN6-987AL tumors were also treated with TGF-β neutralizing antibodies (or isotype control). (O) FOXP3 staining in LNs of HNSCC patients with (N+) or without (N0) LN metastases. Scale bars: 50μm. (P) Foxp3DTR mice were implanted with parental or LN6 tumor lines and depleted of Tregs with diphtheria toxin (DT) and LN metastases were evaluated. P-value in (G) calculated by Log-rank (Mantel-Cox) test, (M) by unpaired two-tailed t-test, and (F, P) by One-Way ANOVA with Tukey’s post hoc test. See also Figure S6.
Thus, we asked whether LN metastases promote distant seeding through conditioning of the immune system. NOD-scid IL2Rgnull (NSG) mice were implanted with the parental or LN tumors and later challenged with intravenous injections of the parental tumor line, as in Fig. 1J. In contrast to the wild-type setting, the LN tumors did not promote lung seeding, suggesting that the differences in metastasis seen in wild-type mice reflect differences in lymphocyte responses (Fig. 6B). We also repeated the initial studies in immunocompetent mice but replaced the intravenous injection of the parental B16-F0 tumor line with MC38, a syngeneic colorectal cancer line, and observed no increase in lung seeding with the LN6 tumors (Fig. 6C), suggesting that the pro-metastatic immune conditioning is tumor specific. Finally, we repeated these studies in LT-α knockout (Lta−/−) mice, which lack LNs (De Togni et al., 1994), and found that mice lacking LNs exhibited fewer lung metastases, indicating that the conditioning is mediated, at least in part, through effects within LNs (Fig. 6D).
Finally, we asked whether the leukocytes within tumor involved LNs are sufficient to promote metastatic seeding. We adoptively transferred purified leukocytes from the LNs of mice with or without LN metastases into tumor-naïve recipients followed by intravenous inoculation of parental tumor cells. Those that received leukocytes from mice with LN tumors were more susceptible to lung colonization than those that received leukocytes from mice with only primary tumors (Fig. 6E), demonstrating that LN metastasis conditions leukocytes within LNs to promote metastasis.
LN metastases suppress T cell responses to tumors and induce Tregs
To determine whether upregulation of MHC-I renders LN metastases susceptible to CD8 T cell cytotoxicity, we overexpressed the ovalbumin (Ova) in the parental and LN8 lines and co-cultured them with OT-I CD8 T cells, which express transgenic TCRs that recognize Ova. T cells cultured with the LN8 cells were considerably more activated than those cultured with the parental (Fig. S6D). Furthermore, OT-I T cells preferentially killed LN8 cells over parental cells (Fig. 6F and S6E). When implanted into wild-type mice, the Ova-expressing parental and LN8 tumors exhibited similar growth kinetics (Fig. S6F). In contrast, while OT-I mice initially cleared both the parental and LN8 lines, LN8 tumors eventually escaped growth inhibition more frequently than parental tumors (Fig. 6G and S6F), suggesting that the LN tumors can overcome antigen-specific CD8 T cell-mediated cytotoxicity in vivo.
WES of the LN lines revealed no evidence of changes in tumor mutational burden or neoantigen burden, nor were there changes in expression of the neoantigens (Fig. 6H–J and S6G). Furthermore, there was no loss in expression of common melanoma antigens (Fig. S6H). Thus, the LN metastases do not escape T cell recognition through classical immunoediting (Schreiber et al., 2011).
Tregs can suppress anti-tumor T cell responses and exhibit antigen specificity (Plitas and Rudensky, 2020), and in light of the tumor-specific promotion of distant metastases (Fig. 6C), we found the increase in Tregs (Fig. 5B) particularly noteworthy. The increase in Tregs in LNs was consistent in mice bearing different LN lines as well as the MMTV-PyMT breast cancer GEMM (Fig. 5B, 6K, and S6I), and the LN lines possess an enhanced capacity to induce Treg differentiation (Fig. 6L and S6J). Cytokine profiling of both supernatants from the cell lines and sera of tumor-bearing mice revealed marked differences in a variety of cytokines, including elevated levels of TGF-β in the sera of mice bearing the LN line (Fig. 6M and S6K, L). RNA-seq revealed modest, if any, increases in expression of the three Tgfb isoforms, suggesting that additional sources of the protein are likely (Fig. S6M). TGF-β can elicit a range of deleterious effects during tumor progression (Mariathasan et al., 2018; Massagué, 2008; Tauriello et al., 2018) and is important for the induction of peripheral Tregs (Plitas and Rudensky, 2020). While neutralization of TGF-β had no effect on primary tumor growth (Fig. S6N), anti-TGF-β reduced the promotion of distant metastasis by LN tumors to that of the parental tumors (Fig. 6N). Additionally, consistent with reports in breast cancer (Núñez et al., 2020), HNSCC patients with LN metastases had higher percentages of Tregs in their LNs (Fig. 6O). Thus, we depleted Tregs in Foxp3DTR mice implanted with parental or LN6 tumors and found that mice lacking Tregs exhibited markedly reduced growth kinetics and LN metastasis (Fig. 6P and S6O).
LN metastasis-induced Tregs are antigen-specific and promote distant metastasis
To determine whether Tregs also play a role in distant metastasis, we implanted Foxp3DTR mice with LN tumors and depleted Tregs prior to intravenous injections of B16-F0-tdTomato cells. System-wide depletion of Tregs resulted in a marked reduction in the number of lung metastases (Fig. 7A). We next asked whether the Tregs derived specifically from the LNs of mice with LN metastases might be responsible for this effect. GFP+ Tregs were isolated from LNs of FoxP3EGFP mice bearing primary parental tumors with or without LN tumors. Equivalent numbers of Tregs were transferred from the LNs of mice with (LN+) or without (LN−) LN tumors to recipient mice previously injected with subcutaneous parental tumors and intravenous B16-F0-tdTomato cells (Fig. 7B). While recipient mice exhibited no differences in their primary tumor sizes, those that received Tregs from LN+ mice had more lung metastases (Fig. 7B). Thus, Tregs from LN metastases possess a greater capacity to promote distant metastasis than Tregs from uninvolved LNs those derived from mice with only primary tumors.
Figure 7 |. LN metastases induce antigen-specific Tregs that promote distant metastasis.

(A) Foxp3DTR mice implanted with LN6 tumors and depleted of Tregs were subsequently injected with B16-F0-tdTomato cells intravenously, and lung metastases were quantified. (B) Foxp3EGFP mice implanted with parental tumors subcutaneously were subsequently injected with intra-LN LN6 or sham control. Equivalent numbers of FoxP3+ Tregs harvested from LNs were transferred to recipient mice implanted subcutaneously with parental tumor lines and challenged with B16-F0-tdTomato. (C) Mice were implanted with B16-F0-Ova tumors subcutaneously and LN8-1205BL-Ova tumors (or sham) intra-LN. Ova specific Tregs in LNs were quantified by MHC-II-Ova-tetramer staining. (D) OT-II transgenic TCR mice were implanted subcutaneously with parental or LN6 tumors and challenged with B16-F0-tdTomato cells. (E) CD45.1 congenic wild-type mice were implanted with B16-F0-Ova or LN8-1205BL-Ova tumors subcutaneously. Naïve T cells from CD45.2 reporter or CD45.2 OT-II mice were transferred to the tumor-bearing recipients following mixing at a 1:1 ratio. After 3 weeks, LNs were harvested and reporter and OT-II CD45.2+ Tregs were quantified. (F) Proposed model of LN metastasis and resultant immunosuppression. P-values in (E) calculated by Two-Way ANOVA with Sidak’s post hoc test.
To determine whether the induced Tregs are antigen specific, we implanted Ova-expressing primary tumors into mice and subsequently implanted Ova-expressing LN8 cells into their LNs. MHC-II-Ova-tetramer staining revealed increased fractions of Ova-specific Tregs in mice bearing LN tumors compared to mice bearing only primary tumors despite Ova expression by those primaries (Fig. 7C). To further determine whether this antigen specificity is essential for the promotion of distant metastasis, we implanted parental or LN6 tumors lacking Ova expression into OT-II mice, whose CD4 T cells express a transgenic TCR that recognizes only Ova323–339, prior to intravenous injections of B16-F0-tdTomato. Mice bearing the LN6 tumors exhibited no increases in lung metastases compared to the parental tumor, suggesting that recognition of tumor antigens by the CD4 T cell compartment, including Tregs, is necessary for the promotion of distant metastasis by the LN tumors (Fig. 7D).
Finally, we asked whether the presence of LN metastases induces the preferential expansion of antigen-specific Tregs. We implanted wild-type congenic CD45.1 mice with Ova-expressing parental or LN8 tumors and adoptively transferred naïve CD4 T cells from CD45.2 OT-II mice and fluorescent reporter CD45.2 wild-type mice (Fig. 7E). Regardless of the tumor type, few, if any reporter Tregs were detectable among the CD45.2+ cells within LNs. Similarly, mice bearing the parental tumors showed minimal MHC-II-Ova-tetramer+ CD45.2+ Tregs. In contrast, mice bearing the LN8 tumors exhibited increased numbers of Ova-specific CD45.2+ Tregs, and this increase occurred only in mice with detectable LN metastases (Fig. 7E). Thus, LN metastases preferentially induce, expand, and maintain tumor-specific Tregs. Taken together, these data demonstrate LN metastases induce antigen-specific naïve CD4 T cells to differentiate into Tregs, and these antigen-specific Tregs promote metastatic seeding of distant tissues.
Discussion
Although nearly all patients whose malignancies spread to distant tissues first exhibit involvement of LNs, whether such involvement has a functional bearing on subsequent metastasis to distant tissues has remained a matter of contention (Pereira et al., 2015). Currently, there exist two prevailing models of metastasis. The first, pioneered by William Halsted, posits that tumors spread first to LNs where they acquire additional metastatic traits and subsequently disseminate to distant tissues (Halsted, 1907). In contrast, a second model suggests that tumors spread independently to LNs and distant tissues, with LN metastases serving no role in the formation of distant metastases aside from their prognostic value. This model is informed by reconstruction of clonal phylogenies of patient tumors using sequencing approaches (Gundem et al., 2015; Haffner et al., 2013; Mangiola et al., 2016; Naxerova et al., 2017) and is additionally supported by observations of tissue-specific metastatic transcriptional profiles (Bos et al., 2009; Kang et al., 2003; Minn et al., 2005; Nguyen et al., 2009) and genomic evidence of the preexistence of metastatic clones in primary tumors (Haffner et al., 2013; Makohon-Moore et al., 2017; Navin et al., 2011; Reiter et al., 2018). Our findings reconcile these contradictory models by demonstrating that LN colonization plays a critical role in metastatic progression, not by necessarily serving as cellular sources to seed distant metastases, but rather by inducing tumor-specific immune tolerance that renders distant tissues amenable to metastatic colonization (Fig. S7). In agreement with the prognostic value of LN involvement across a wide range of solid malignancies (Gershenwald et al., 1999; Hess et al., 2006; Jatoi et al., 1999; Leong et al., 2011), our model, which we have termed “Metastatic Tolerance”, demonstrates the critical antecedent nature of nodal involvement without restricting phylogenetic origin of distant metastases.
We found that tumors initially upregulate MHC-I to evade NK cells, upregulate ISGs, including PD-L1, in response to chronic IFN signaling, alter the immune compartment within LNs, induce antigen-specific Treg differentiation, and promote metastasis to distant tissues through the induction of tumor-specific immune tolerance (Fig. 7F). Knockout of the IFNRs prevented the acquisition of the ISG signature and reduced the capacity of the tumors to metastasize to LNs, yet exposure to IFNs was not required to maintain these attributes (Fig. 3). Instead, a basal level of phosphorylated Stat proteins is maintained, perhaps through transient dimerization of the Ifnar1 and Ifnar2 in the absence of ligand. Stat TFs only drive transcription of ISGs following increased accessibility of the ISRE and GAS sites that results from chronic exposure to IFNs. These features do not arise in the absence of IFNR expression by the tumor cells (Fig. 3) nor in the absence of lymphocytes (Fig. 4J), suggesting that interactions with T cells, major producers of type II IFN, may drive the selection for a LN metastatic phenotype through chronic IFN production during the initial anti-tumor response to the metastases. While IFN signaling is classically associated with positive prognoses (Dunn et al., 2006), it has also been correlated with PD-L1 and IDO expression and Treg accumulation (Spranger et al., 2013; Taube et al., 2012). Chronic viral infections and malignancies can induce T cell exhaustion, an epigenetically conferred state, which is partially affected by exposure to IFNs in the context of persistent TCR stimulation (Wherry and Kurachi, 2015). Radiation therapy and ICB also induce chronic IFN-γ signaling resulting in epigenetic reprogramming of tumor cells and constitutive activation of ISGs, enabling T cell inhibition (Benci et al., 2019; Benci et al., 2016; Minn and Wherry). The epigenetically instilled upregulation of the ISGs in LN metastases appears to approximate the observations from those studies, suggesting that LN metastasis and treatment resistance may share similar molecular mechanisms to suppress immune responses.
H2 genes were immediately upregulated by in the LN metastases in a manner independent of IFN signaling. Increased NLRC5 enhanceosome or NF-κB activity could be responsible for their rapid upregulation (Jongsma et al., 2019). Activation of cGAS-STING and NF-κB signaling endows tumors exhibiting chromosomal instability with enhanced metastatic potential (Bakhoum et al., 2018). Perhaps, such mechanisms may drive selection for tumors with upregulated MHC-I. Disruption of antigen presentation by tumors through loss of heterozygosity of B2M or the HLA alleles is a common feature of tumor progression, metastasis, and resistance to ICB (McGranahan et al., 2017; Pereira et al., 2017; Sade-Feldman et al., 2017). In contrast to LN metastases, lung metastases downregulated MHC-I, suggesting that MHC-I upregulation may be specific to LN metastasis. Perhaps, upregulation of MHC-I facilitates NK evasion during dissemination to LNs but also activates CD8 T cells and IFN-γ production, ultimately leading to epigenetic reprogramming and immunosuppression prior to dissemination of less immunogenic clones to distant tissues.
Unlike other factors that promote metastasis through immune-or antigen-independent mechanisms, LN colonization induces tumor-specific immune tolerance. Stimulation of the TCR on Tregs is critical for their differentiation and maintenance (Levine et al., 2014; Plitas and Rudensky, 2020), and Tregs in the blood and tumors of patients share tumor-specific TCR repertoires (Ahmadzadeh et al., 2019). Our antigen-specific Treg findings indicate that the induction of tumor-specific Tregs represents a potent mechanism by which LN metastases induce tumor-specific immune tolerance. While trafficking of various cDC populations from tumors to LNs and antigen-presentation by lymphatic endothelial cells generate antigen-specific responses to tumors (Binnewies et al., 2019; Lund et al., 2012; Roberts et al., 2016; Salmon et al., 2016), our results indicate that colonization of the LNs themselves is critical for the generation of systemic tumor-immune tolerance. Perhaps, in addition to providing a source of tumor antigens, the LN metastases also provide necessary suppressive signals to drive Treg differentiation. Additionally, these metastases could induce additional antigen-specific immunosuppressive processes such as the induction of T cell exhaustion, anergy, T follicular regulatory (Tfr) cells, or regulatory B cells. Clinically, lymphadenectomy often does not improve patient survival despite providing considerable diagnostic utility (Faries et al., 2017). It is possible that removal of involved nodes provides little benefit once systemic tolerance has been established while also eliminating the potential for CD8 T cell priming. Effective immunotherapy requires activation within LNs (Spitzer et al., 2017), and therapeutic approaches that repolarize immune responses within LNs away from tolerance and toward activation may represent a viable approach to enhancing treatment of patients with stage IV disease.
Limitations of the study
LN metastasis represents a common feature across a wide range of solid tissue malignancies, suggesting that the mechanisms described here could apply to most solid tumors. While we have sought to validate aspects of our findings (e.g., features of the IFN response, Treg abundance, etc.) in multiple mouse and human cancers, our primary findings were generated in our melanoma model, and further studies are needed to determine their generalizability. Additionally, although our data indicate that colonization of the LN itself is a critical aspect of the generation of metastatic tolerance, we cannot rule out a role for soluble factors derived from the primary tumor in conditioning the LN. Finally, we demonstrated that the induction of tumor-specific Tregs is necessary for the promotion of distant metastasis, but the precise mechanisms by which these cells are induced within the LNs and subsequently spread throughout the host remain to be explored.
STAR Methods
Resource Availability
Lead Contact
Further information and requests for resources and reagents should be directed to and will be fulfilled by the lead contact, Edgar G. Engleman (edgareng@stanford.edu).
Materials Availability
Cell lines generated in these studies will be made available upon request. Correspondence and requests for materials should be addressed to edgareng@stanford.edu. In some instances, transfer of materials may require a Materials Transfer Agreement (MTA) between institutions, including transfer of transgenic mice, cell lines, gene constructs, antibodies, or chemical compounds for preclinical use. Stanford University does not require an MTA for transfer of non-human biological materials to other academic institutions when being used for in vitro research purposes.
Data and Code Availability
Murine bulk RNA-seq, single-cell RNA-seq, and ATAC-seq data and de-identified human HNSCC RNA-seq data have been deposited at GEO and are publicly available as of the date of publication. Murine WES data have been deposited at SRA and are publicly available as of the date of publication. Accession numbers are listed in the Key Resources table.
This paper does not report original code.
Any additional information required to reanalyze the data reported in this paper is available from the lead contact upon request.
| REAGENT or RESOURCE | SOURCE | IDENTIFIER |
|---|---|---|
| Antibodies | ||
| Rat Anti-CD16/CD32 Monoclonal Antibody, Unconjugated, (Clone 2.4G2) | BD Biosciences | Cat# 553141; RRID:AB_394656 |
| Brilliant Violet 421 anti-mouse CD45 | BioLegend | Cat# 103134; RRID:AB_2562559 |
| BUV395 Rat Anti-Mouse CD45 (Clone 30-F11) | BD Biosciences | Cat# 564279; RRID:AB_2651134 |
| FITC anti-mouse CD3 | BioLegend | Cat# 100204; RRID:AB_312661 |
| Brilliant Violet 510 anti-mouse CD3 | BioLegend | Cat# 100234; RRID:AB_2562555 |
| Brilliant Violet 605 anti-mouse CD3 | BioLegend | Cat# 100237; RRID:AB_2562039 |
| Brilliant Violet 650 anti-mouse CD4 | BioLegend | Cat# 100555; RRID:AB_2562529 |
| Brilliant Violet 711 anti-mouse CD4 | BioLegend | Cat# 100549; RRID:AB_11219396 |
| Brilliant Violet 421 anti-mouse CD4 | BioLegend | Cat# 100544; RRID:AB_11219790 |
| Brilliant Violet 785 anti-mouse CD8a | BioLegend | Cat# 100750; RRID:AB_2562610 |
| Brilliant Violet 510 anti-mouse CD8a | BioLegend | Cat# 100752; RRID:AB_2563057 |
| Alexa Fluor 488 anti-mouse CD8a | BioLegend | Cat# 100723; RRID:AB_389304 |
| PE anti-FoxP3 | Thermo Fisher | Cat #14-4771-80; RRID: AB_529583 |
| PE anti-FoxP3 | BD Biosciences | Cat# 560408; RRID: AB_1645251 |
| APC/Cyanine7 anti-mouse CD25 | BioLegend | Cat# 102026; RRID:AB_830745 |
| APC anti-mouse CD25 | BioLegend | Cat# 102012; RRID:AB_312861 |
| FITC anti-PD-1 | BioLegend | Cat# 135214; RRID: AB_10680238 |
| Brilliant Violet 421 anti-PD-1 | BioLegend | Cat# 109121; RRID:AB_2687080 |
| Brilliant Violet 650 anti-mouse/human CD44 | BioLegend | Cat# 103049; RRID:AB_2562600 |
| Brilliant Violet 421 anti-mouse CD62L | BioLegend | Cat# 104435; RRID:AB_10900082 |
| FITC anti-mouse Ki-67 | BioLegend | Cat# 652409; RRID:AB_2562140 |
| Brilliant Violet 711 anti-mouse/human CD45R/B220 | BioLegend | Cat# 103255; RRID:AB_2563491 |
| APC anti-mouse CD69 | BioLegend | Cat# 104513; RRID:AB_492844 |
| Alexa Fluor 488 anti-mouse CD69 | BioLegend | Cat# 104516; RRID:AB_492845 |
| Pacific Blue anti-human/mouse Granzyme B | BioLegend | Cat# 515407; RRID:AB_2562195 |
| APC anti-mouse IFN-gamma | BioLegend | Cat# 505810; RRID:AB_315404 |
| PE anti-mouse CD11c | BioLegend | Cat# 117307; RRID:AB_313776 |
| APC/Cyanine7 anti-mouse/human CD11b | BioLegend | Cat# 101225; RRID:AB_830641 |
| Brilliant Violet 605 anti-mouse CD103 | BioLegend | Cat# 121433; RRID:AB_2629724 |
| Brilliant Violet 785 anti-mouse/rat Xcr1 | BioLegend | Cat# 148225; RRID:AB_2783119 |
| FITC anti-mouse I-A/I-E | BioLegend | Cat# 107605; RRID:AB_313320 |
| Alexa Fluor 700 anti-mouse Ly-6G | BioLegend | Cat# 127622; RRID:AB_10643269 |
| PerCP/Cyanine5.5 anti-mouse F4/80 | BioLegend | Cat# 123127; RRID:AB_893496 |
| PE/Cyanine7 anti-mouse CD274 (B7-H1, PD-L1) | BioLegend | Cat# 124313; RRID:AB_10639934 |
| APC anti-mouse CD274 (B7-H1, PD-L1) | BioLegend | Cat# 124311; RRID:AB_10612935 |
| Alexa Fluor 647 anti-mouse CD172a (SIRPalpha) | BioLegend | Cat# 144028; RRID:AB_2721301 |
| PerCP/Cyanine5.5 anti-mouse CD45.1 | BioLegend | Cat# 110727; RRID:AB_893348 |
| PE anti-mouse CD45.2 | BioLegend | Cat# 109807; RRID:AB_313444 |
| Brilliant Violet 421 Statl (pY701) | BD Biosciences | Cat# 562985; RRID:AB_2737932 |
| Alexa Fluor 647 anti-Stat3, phospho (Tyr705) (Clone 4) | BD Biosciences | Cat# 557815; RRID:AB_647144 |
| Alexa Fluor 647 Stat4 (pY693) | BD Biosciences | Cat# 558137; RRID:AB_397052 |
| Alexa Fluor 488 Stat5 (pY694) | BD Biosciences | Cat# 612598; RRID:AB_399881 |
| PE anti-mouse H-2Kb | BioLegend | Cat# 116507; RRID:AB_313734 |
| APC anti-mouse H-2Db | Thermo Fisher | Cat# 17-5999-82; RRID:AB_2573252 |
| Alexa Fluor 647 anti-human IgG Fc | BioLegend | Cat# 410713; RRID:AB_2728443 |
| Alexa Fluor 647 Rat IgG2a isotype control | BioLegend | Cat# 400526; RRID:AB_2864284 |
| InVivoMAb mouse IgG1 isotype control | Bio X Cell | Cat# BE0083; RRID:AB_1107784 |
| InVivoMAb anti-TGF-β | Bio X Cell | Cat# BE0057; RRID:AB_1107757 |
| InVivoPlus anti-mouse CD4 | Bio X Cell | Cat# BE0003-1; RRID:AB_1107636 |
| InVivoPlus anti-mouse CD8a | Bio X Cell | Cat# BP0117; RRID:AB_10950145 |
| rat IgG2b Isotype control | Bio X Cell | Cat# BE0090; RRID:AB_1107780 |
| InVivoPlus anti-mouse NK1.1 | Bio X Cell | Cat# BE0036; RRID:AB_1107737 |
| InVivoPlus mouse IgG2a isotype control | Bio X Cell | Cat# BE0085; RRID:AB_1107771 |
| Anti-PD-L1 (E1L3N) | CellSignaling | Cat # 13684; RRID: AB_2687655 |
| Biological samples | ||
| Human Malignant Melanoma Tissue Microarray | US Biomax | Cat # ME2082c |
| Human HNSCC Tissue Microarray | Stanford Healthcare | This paper |
| Chemicals, peptides, and recombinant proteins | ||
| StemPro Accutase | Thermo Fisher | Cat # A1110501 |
| Lipofectamine 2000 | Thermo Fisher | Cat # 11668019 |
| Hygromycin B | Thermo Fisher | Cat # 10687010 |
| Polybrene | Sigma | Cat # TR-1003-G |
| NP40 | Sigma | Cat # 11332473001 |
| Digitonin | Promega | Cat # G9441 |
| Tagment DNA Enzyme | Illumina | Cat # 20034197 |
| Collagenase 4 | Worthington | Cat # LS004189 |
| LIVE/DEAD Fixable Blue Dead Cell Stain | Thermo Fisher | Cat # L34962 |
| LIVE/DEAD Fixable Near-IR Dead Cell Stain Kit | Thermo Fisher | Cat # L10119 |
| eBioscience FoxP3 Fixation/Permeabilization | Thermo Fisher | Cat # 00-5521-00 |
| DAPI | Thermo Fisher | Cat # D3571 |
| NKG2D-Fc Chimera | R&D Systems | Cat # 139-NK-050 |
| BV421 MHC-ll-Ova tetramer | NIH Tetramer Facility | I-A(b) AAHAEINEA |
| BV421 MHC-II Cntrl tetramer | NIH Tetramer Facility | I-A(b) PVSKMRMATPLLMQA |
| Recombinant mouse IFN-α | PBL Assay Science | Cat# 12100-1 |
| Recombinant mouse IFN-γ | Biolegend | Cat # 575306 |
| Fixation Buffer | BD Biosciences | Cat # 554655 |
| Phosflow Perm Buffer III | BD Biosciences | Cat # 558050 |
| Brilliant Stain Buffer Plus | BD Biosciences | Cat # 566385 |
| Recombinant Human TGF-β | Peprotech | Cat# 100-21 |
| Diptheria Toxin | Sigma | Cat # D0564 |
| CellTrace CFSE | Thermo Fisher | Cat # C34554 |
| CellTrace Violet | Thermo Fisher | Cat # C34571 |
| Calcein-AM | Thermo Fisher | Cat # C3100MP |
| Tissue-Tek Optimal Cutting Temperature Compound | VWR | Cat # 25608-930 |
| Dako Dual Endogenous Enzyme Block | Agilent | Cat # S2003 |
| Dako Protein Block | Agilent | Cat # X0909 |
| Critical commercial assays | ||
| DNA Clean and Concentrator-5 Kit | Zymo | Cat # D4013 |
| NEBNext 2X Master Mix | New England Biolabs | Cat # M0541S |
| Lib Quant Kit | Kapa Biosystems | Cat # KK5621 |
| SPHERO AccuCount Fluorescent Particles | Spherotech | Cat # ACFP-50-5 |
| MojoSort Mouse Naïve CD4+ T Cell Isolation Kit | BioLegend | Cat # 480040 |
| anti-CD3/CD28 Dynabeads | Thermo Fisher | Cat # 11456D |
| EasySep Mouse CD8+ T cell Isolation Kit | StemCell | Cat # 19853 |
| EasySep Mouse NK Cell Isolation Kit | StemCell | Cat # 19855 |
| ImmPRESS-AP Anti-Rabbit IgG (alkaline phosphatase) Polymer Detection Kit | Vector Laboratories | Cat # MP-5401 |
| ImmPACT Vector Red Alkaline Phosphatase (AP) Substrate | Vector Laboratories | Cat # SK-5105 |
| RNEasy Plus Mini | Qiagen | Cat # 74034 |
| QIAshredder | Qiagen | Cat # 79654 |
| DNEasy Blood and Tissue | Qiagen | Cat # 69504 |
| Deposited data | ||
| Human HNSCC RNA-seq | This paper | GSE113839 |
| Interferome v2 database | Rusinova et al., 2013 | www.interferome.org |
| Mouse RNA-seq, ATAC-seq, and scRNA-seq | This paper | GSE117529 |
| Mouse WES | This paper | PRJNA820881 |
| Experimental models: Cell lines | ||
| B16-F0 | ATCC | CRL-6322 |
| B16-F10 | ATCC | CRL-6475 |
| LN Lines | This paper | N/A |
| LMP | Tseng et al., 2010 (our lab) | N/A |
| MOC2 | Judd et al., 2012 (gift from John Sunwoo) | N/A |
| MC38 | Gift from Cornelis J.M. Melief | N/A |
| Experimental models: Organisms/strains | ||
| C57BL/6J | Jackson Laboratories | #000664 |
| B6129SF1/J | Jackson Laboratories | #101043 |
| B6(Cg)-Rag2tm1.1Cgn/J | Jackson Laboratories | #008449 |
| B6.129S4-Il2rgtm1Wjl/J | Jackson Laboratories | #003174 |
| B6.FVB-Tg(MMTV-PyVT)634Mul/LellJ | Jackson Laboratories | #022974 |
| NOD.Cg-PrkdcscidIl2rgtm1Wjl/SzJ | Jackson Laboratories | #005557 |
| B6.Cg-Tg(TcraTcrb)425Cbn/J | Jackson Laboratories | #004194 |
| B6.129S2-Ltatm1Dch/J | Jackson Laboratories | #002258 |
| B6.Cg-Tg(Tyr-cre/ERT2)13Bos Braftm1Mmcm Ptentm1Hwu/BosJ | Jackson Laboratories | #013590 |
| B6.Cg-Foxp3tm2Tch/J | Jackson Laboratories | #006772 |
| B6.129(Cg)-Foxp3tm3(DTR/GFP)Ayr/J | Jackson Laboratories | #016958 |
| C57BL/6-Tg(TcraTcrb)110OMjb/J | Jackson Laboratories | #003831 |
| B6;129S-Gt(ROSA)26Sortm1.1(CAG-COX8A/Dendra2)Dcc/J | Jackson Laboratories | #018397 |
| B6.SJL-Ptprca Pepcb/BoyJ | Jackson Laboratories | #002014 |
| Oligonucleotides | ||
| See Table S4 | ||
| Recombinant DNA | ||
| lentiCRISPR v2 | Sanjana et al., 2014 | Addgene plasmid #52961 |
| pSpCas9(BB)-2A-GFP (PX458) | Ran et al., 2013 | Addgene plasmid #48138 |
| mWasabi-N1 | Ai et al., 2008 | Addgene plasmid #54765 |
| tdTomato-N1 | Shaner et al., 2004 | Addgene plasmid #54642 |
| pCI-neo-cOVA | Yang et al., 2010 | Addgene plasmid #25097 |
| pLVX-IRES-Hyg | Clontech | Cat # 632185 |
| psPAX2 | Didier Trono | Addgene plasmid #12260 |
| pCMV-VSV-G | Stewart et al., 2003 | Addgene plasmid #8454 |
| Software and algorithms | ||
| Trimmomatic (v0.36) | Bolger at al., 2014 | https://github.com/usadellab/Trimmomatic |
| FastQC (v0.11.3) | Babraham Institute | https://www.bioinformatics.babraham.ac.uk/projects/fastqc/ |
| Salmon (v0.7.2) | Patro et al., 2017 | https://combine-lab.github.io/salmon/ |
| Rstudio (v1.0.143 – v1.1.463) | RStudio, Inc | https://rstudio.com/ |
| DESeq2 (v1.14.1 and v1.28.1) | Love et al., 2014 | https://bioconductor.org/packages/release/bioc/html/DESeq2.html |
| GSEA (v3.0) | Mootha et al., 2003; Subramanian et al., 2005 | https://www.gsea-msigdb.org/ |
| HGNC Comparison of Orthology Predictions | HUGO Gene Nomenclature Committee | https://www.aenenames.ora/cai-bin/hcoo |
| Gene Ontology | Ashburner wt al., 2000; Gene Ontology Consortium | http://www.geneontology.org/ |
| GraphPad Prism (v7.04 – v9.1.0) | Graphpad Software, LLC | N/A |
| FlowJo (v10.0.8) | TreeStar | N/A |
| ggplot2 (v2.2.1) | Wickham, 2016 | https://ggplot2.tidyverse.org/ |
| R stats package (v3.3.2) | R Foundation | http://www.r-project.org/ |
| FSA package (v0.8.20) | R Foundation | http://www.r-project.org/ |
| AGeNT Surecall Trimmer (v4.0.1) | Agilent | N/A |
| Burrows-Wheeler Aligner (bwa-mem) (v0.7.12) | Li et al., 2009 #1 | http://bio-bwa.sourceforge.net/ |
| SAMtools (v1.6 and v1.8) | Li et al., 2009 #2 | https://github.com/samtools/ |
| Picard (v2.17.0) | Broad Institute | https://broadinstitute.github.io/picard/ |
| MuTect2 (GATK v4.0.0.0) | Broad Institute | https://gatk.broadinstitute.org/hc/enus/articles/360037593851-Mutect2 |
| SnpEff (v4.3) | Cingolani et al., 2012 | http://pcingola.github.io/SnpEff/ |
| NetMHCpan (v4.0) | Jurtz et al., 2017 | https://services.healthtech.dtu.dk/cgi-bin/sw_request |
| MuPeXI (v1.2.0) | Bjerregaard et al., 2017 | https://github.com/ambj/MuPeXI |
| Variant Effect Predictor (v87.27) | McLaren et al., 2016 | https://github.com/Ensembl/ensembl-vep |
| Circos (v0.69.4) | Krzywinski et al., 2009 | http://circos.ca/ |
| hisat2 | Kim et al., 2019 | http://daehwankimlab.github.io/hisat2/ |
| MACS2 | Zhang et al., 2008 | https://pypi.org/project/MACS2/ |
| Integrative Genomics Viewer (v2.5.3) | Broad Institute | https://software.broadinstitute.org/software/igv/ |
| ChromVAR | Schep et al., 2017 | https://greenleaflab.github.io/chromVAR/ |
| HOMER | Heinz et al., 2010 | http://homer.ucsd.edu/homer/ |
| Cell Ranger (v3.1.0) | 10X Genomics | https://support.10xgenomics.com/single-cell-gene-expression/software/downloads/latest |
| Seurat (v4.0) | Hao et al, 2021 | https://satijalab.org/seurat/ |
| R (v4.0.2) | R Foundation | http://www.r-project.org/ |
| Scikit-image | van der Walt et al., 2014 | https://scikit-image.org/ |
| OpenCV | Bradski, et al., 2000 | https://pypi.org/project/opencv-python/ |
| BD FACS Diva (v8.0.2) | Becton Dickinson | N/A |
| Zeiss ZEN 2012 (Blue Edition) | Zeiss | N/A |
| Nikon NIS-Elements D (v4.30.02) | Nikon | N/A |
| Adobe Photoshop CS6 | Adobe System | N/A |
| Adobe Illustrator CS6 | Adobe System | N/A |
| Other | ||
| Zeis LSM 700 confocal microscope | Zeiss | N/A |
| FACSAria II | Becton Dickinson | N/A |
| SMZ1000 Stereo Dissection Microscope | Nikon | N/A |
| IVIS Spectrum Imager | Caliper Life Sciences | N/A |
| LSR II | Becton Dickinson | N/A |
| LSRFortessa X-20 | Becton Dickinson | N/A |
Experimental model and subject details
Mice
C57BL/6J (Stock # 000664), B6129SF1/J (Stock # 101043), B6(Cg)-Rag2tm1.1Cg/J (Stock # 008449), B6.129S4-Il2rgtm1Wjl/J (Stock # 003174), B6.FVB-Tg(MMTV-PyVT)634Mul/LellJ, (Stock # 022974), NOD.Cg-PrkdcscidIl2rgtm1Wjl/SzJ (NOD-scid Il2Rgnull, NSG, Stock # 005557), B6.Cg-Tg(TcraTcrb)425Cbn/J (OT-II, Stock # 004194), B6.129S2-Ltatm1Dch/J (Lta−/−, Stock # 002258), B6.Cg-Tg(Tyr-cre/ERT2)13Bos Brafm1Mmcm Ptentm1Hwu/BosJ (BRafCA;PtenloxP;Tyr::CreERT2 mice, Stock # 013590) (Dankort et al., 2009), B6.Cg-Foxp3tm2Tch/J (FoxP3EGFP, Stock # 006772) (Haribhai et al., 2007), B6.129(Cg)-Foxp3tm3(DTR/GFP)Ayr/J (Foxp3DTR, Stock # 016958), C57BL/6-Tg(TcraTcrb)1100Mjb/J (OT-I, Stock # 003831), B6;129S-Gt(ROSA)26Sortm1.1(CAG-COX8A/Dendra2)Dcc/J (Stock # 018397), B6.SJL-Pfprca Pepcb/BoyJ (CD45.1, Stock # 002014) mice were acquired from Jackson Labs (JAX) and housed our facility at Stanford University. Genetic mice were also bred within this facility. All animal studies were performed in accordance with the Stanford University Institutional Animal Care and Use Committee under protocol APLAC-17466. All mice were housed in an American Association for the Accreditation of Laboratory Animal Care–accredited animal facility and maintained in specific pathogen-free conditions. Rag2−/−;Il2rg−/− mice were generated by crossing B6(Cg)-Rag2tm1.1Cgn/J mice (Jackson, 008449) with B6.129S4-Il2rgtm1Wjl/J mice (Jackson, 003174). MMTV-PyMT mice on the C57BL/6 background (B6.FVB-Tg(MMTV-PyVT)634Mul/LellJ, Jackson, 022974) that were hemizygous for the transgene were crossed with B6(Cg)-Rag2tm1.1Cgn/J mice to generate Rag2−/−;PyMTT9/+ mice. All studies were performed in animals between 8 to 10 weeks of age, unless otherwise specified. All tumor transplant studies were performed in female mice, unless otherwise specified. Co-housing of different conditions was performed for all experiments.
Human Samples
Human HNSCC tissue collection was approved by the Stanford Research Compliance Office and was performed according to institutional guidelines under Stanford IRB protocol 38502, “Modeling the Role of Lymph Node Metastases in Tumor-Mediated Immunosuppression”. Informed consent was obtained from all patients. RNA-seq data was collected on 6 males and 8 females.
Cell Lines
The B16-F0 and B16-F10 tumor lines were acquired from ATCC (CRL-6322 and CRL-6475) and grown in Dulbecco’s Modified Eagle Medium (DMEM) supplemented with 4mM L-glutamine, 10% Fetal Bovine Serum (FBS), and 1% Penicillin Streptomycin. LMP cells were generated as described previously (Tseng et al., 2010). MC38 cells were a gift from the Cornells J.M. Melief Lab (Leiden University) and were cultured in RPMI-1640 supplemented as above. MOC2 tumors were generated by exposing the oral mucosa of mice to 7,12-dimethylbenz(a)anthracene (DMBA), as described previously (Judd et al., 2012). MOC2 and MC38 lines were derived from female mice. The sex of LMP cells is unknown. B16 lines are reported to be male, but our WES data yielded negligible alignment to the Y chromosome. All tumor lines, including those generated as described below, were routinely tested for mycoplasma by PCR and all tests were negative. No additional authentication was performed.
Method Details
Tumor Line Generation and Transplantation Studies
For melanoma LN cell line generation, tumor cells were washed with phosphate buffered saline (PBS) and dissociated from tissue culture plastic with Stem Pro Accutase (Thermo, A1110501). Cell suspensions of 2×10⁵ cells in phenol red free DMEM were injected into the subcutaneous region of the left flank of seven- to nine-week-old C57BL/6J female mice (Jackson, 000664) following removal of fur with surgical clippers. For PDAC LN cell line generation LMP cells were implanted into female B6129SF1/J mice (Jackson, 101043). Tumors were allowed to grow for 33 days or until mice were moribund, at which point mice were euthanized. Inguinal, brachial, and axillary LNs were harvested and mechanically dissociated on 100μm cell strainers. Strainers were washed with DMEM, and cells were resuspended and plated following centrifugation. Tumor cells were expanded ex vivo into cell lines and for three to six passages prior to injection into naïve recipients.
For experiments comparing the LN metastatic incidence rates between the tumor lines, cells were injected as described above, and mice were euthanized 33 days following injection. Inguinal, brachial, and axillary LNs were evaluated for their gross presence or absence of metastases.
The RGLN1-1348BL cell line was generated in Rag2−/−;Il2rg−/− mice and the R1-NT7AL cell line was generated in Rag2−/− mice following the same approach as described above. For spontaneous lung metastasis assays with the B16-F0, LN6-987AL, and LN8-1205BL cell lines, wild-type or Rag2−/−;Il2rg−/− mice were injected with 2×10⁵ cells into the subcutaneous region of the flank as described above. Mice were euthanized 26 days following inoculation and metastases were quantified based on the gross appearance of visible nodules. To quantify spontaneous lung metastases in the Rag-PyMT mice, mice were euthanized at 24 to 27 weeks of age. Lungs were fixed by intratracheal injection of 10% buffered formalin followed by paraffin embedding and staining with hematoxylin and eosin (H&E). Full lung sections were imaged on a Zeiss LSM 700 microscope. Tumor area was calculated as a percentage of the total lung area using the measurement tools in Adobe Photoshop.
Generation of Fluorescent and Ovalbumin-Expressing Cell Lines
mWasabi-N1 (Ai et al., 2008) and tdTomato-N1 (Shaner et al., 2004) were gifts from Robert Campbell & Michael Davidson (Addgene plasmid # 54765 and # 54642). pCI-neo-cOVA was a gift from Maria Castro (Addgene plasmid # 25097; http://n2t.net/addgene:25097; RRID: Addgene_25097)(Yang et al., 2010). Lentiviral constructs were generated by cloning the fluorescence or Ova genes into the pLVX-IRES-Hygro construct from Clontech (632185). The CMV promoter was also replaced with the human EF1 a promoter. Lentiviral particles were packaged in HEK-293T cells using the pCMV-VSVG and psPAX2 envelope and packaging plasmids. psPAX2 was a gift from Didier Trono (Addgene plasmid # 12260). pCMV-VSV-G was a gift from Bob Weinberg (Addgene plasmid # 8454) (Stewart et al., 2003). Cells were transfected with Lipofectamine 2000 (Thermo 11668019) in OptiMEM. Viral supernatant was harvested, and cell debris was filtered out using 0.45μm syringe filters. Supernatant was mixed at a 1:1 ratio with complete DMEM without antibiotics, polybrene was added at a final concentration of 4μg/mL, and the mixture was added to B16-F0, LN6-987AL, and MC38 cell lines. Transduced cell lines were selected in Hygromycin B at a concentration of 300μg/mL followed by two rounds of fluorescence activated cell sorting (FACS) on a FACSAria II (Becton Dickinson).
RNA and DNA Extraction and NGS Library Preparation
RNA was extracted at the time a tumor line was frozen following expansion and within one passage of implantation into naïve recipients for the creation of the next generation of lines. RNA was extracted using Qiashredders (Qiagen) and the RNEasy Plus mini kits (Qiagen). Library preparation and sequencing of the original parental and LN lines in Fig. 2 were performed by Centrillion Genomic Services (Palo Alto, CA). Libraries were prepared for sequencing using the Illumina TruSeq RNA Sample Prep Kit, checked for size using the Agilent DNA 100 kit on a BioAnalyzer (Agilent), and quantified by qPCR using the KAPA Library Quantification Kit for Illumina. Libraries were sequenced on a HiSeq2500 using the TruSeq SBS v2 Reagent Kit at 2 × 100 cycles paired-end to a depth of approximately 50M reads per sample. RNA from replicate parental tumor lines was obtained from lines harvested at different times and passages prior to and following cryopreservation in order to account for variances induced by cell culture. LN tumor lines subjected to sequencing were selected in order to encompass representation from all lineages, generations, and anatomic locations (i.e., those derived from different LNs). Library preparation and sequencing of the various IFNR and Stat1 knockout lines were prepared by MedGenome, Inc. (Foster City, CA). Libraries were prepared using the Illumina TruSeq stranded mRNA kit, checked for quality as above, and sequenced on a NovaSeq S4 flowcell at 2 × 100 cycles paired-end to a depth of approximately 20M paired reads per sample.
DNA was extracted using DNeasy Blood and Tissue Kits (Qiagen) according to the manufacturer’s protocol. Library preparation and sequencing were performed by Novogene (Beijing, China). Libraries were prepared for sequencing using the Agilent SureSelectXT Mouse All Exon Kit and quantified using the Agilent sensitivity DNA assay on a BioAnalyzer 2100 system (Agilent). Sequencing was performed on an Illumina HiSeq4000 at 2 × 150 cycles paired-end at 100× coverage.
RNA Sequencing Analysis
Raw sequencing reads were filtered, and adapters trimmed using Trimmomatic (Bolger et al., 2014), and quality was evaluated using FastQC. Transcript abundance was quantified using Salmon v0.7.2 in quasi-mapping mode and using the sequence, GC, and position bias correction parameters (Patro et al., 2017). Mouse genome GRCm38 GENCODE release M11 was used for building the Salmon index file. Subsequent expression analysis was performed in R. TPM values were acquired using the tximport package. Mitochondrial reads (i.e., genes beginning with “mt-”) were removed, and TPM values were renormalized.
Differential gene expression analysis was performed using DESeq2 (Love et al., 2014). Comparison groups are defined in Tables S1 and S2. Counts were transformed and normalized using a regularized log transformation. To calculate Spearman correlations, the top 1000 HVGs (highly variable genes) were used to calculate sample correlation matrices. Pairwise Spearman correlations were calculated between each of the tumor lines, and hierarchical clustering was performed using Ward’s method to generate the correlation matrix and were plotted using ggplot2 (Wickham, 2016). PCAs were performed using the R statistics package. PCA plot from Fig. S3a was calculated using the top 500 highly variable genes, while that in Fig. S3b was calculated using the top 250 genes differentially expressed between the late- and early-stage LN line generations.
Tumor lines used to identify differentially regulated genes for the different analyses (e.g., Early vs. Late, specific phylogenetic lineages, etc.) are shown in Table S2. Volcano plots were generated using ggplot2. Differentially expressed genes in blue were defined as genes with an adjusted p-value < 0.01 and |fold change| > 2. Interferon-related genes (dark blue) were identified by querying the Interferome v.2 database (Rusinova et al., 2013) (http://www.interferome.org) for the differentially expressed genes (|Fold Change| ≥ 2). Heatmaps were generated using the heatmap3 package, which clusters based upon Euclidean distances (Zhao et al., 2014). The heatmap in Fig. 2 was generated from the top 200 differentially expressed genes between the parental and LN8 lines.
GSEA and GO Analyses
GO analysis was performed as previously described using the Gene Ontology Consortium website (http://www.geneontology.org/) (Ashburner et al., 2000; Consortium, 2017). For GSEA, genes were ranked by fold change. The gene list was converted to the human orthologs using the HGNC Comparison of Orthology Predictions (HCOP) search tool (https://www.genenames.org/cgi-bin/hcop) (Eyre et al., 2007; Gray et al., 2015; Wright et al., 2005). GSEA v3.0 software (Mootha et al., 2003; Subramanian et al., 2005) was run on the MSigDB Hallmarks database (Liberzon et al., 2015) using the Pre-Ranked Gene List format, classic enrichment statistics, “meandiv” normalization, and for 10,000 permutations. Gene sets with FDRs equal to 0 after 10,000 permutations were depicted in Fig. 2 as having an infinite −log10(q-val). Database was accessed December 2017.
ATAC-seq Library Preparation
Samples were prepared for ATAC-seq following the Omni-ATAC protocol (Corces et al., 2017). Briefly, cells detached with Accutase, washed in PBS, and resuspended in 50μL of ATAC-Resuspension Buffer (RSB, water with 10mM Tris-HCL, 10mM NaCl, and 3mM MhCl2) supplemented with 0.1% NP40 (Sigma), 0.1% Tween-20 (Sigma), and 0.01% Digitonin (Promega). Cells were incubated on ice for 3 minutes prior to adding 1mL RSB + 0.1% Tween-20. Samples were centrifuged and resuspended in 50μL of transposition mixture (2X TDE buffer + 2.5μL Tn5 Transposase (Illumina Tagment DNA Enzyme) + PBS + Digitonin + Tween-20 + water) incubated for 30min at 37°C on an orbital shaker. Samples were cleaned with the Zymo DNA Clean and Concentrator-5 Kit. Samples were amplified for 5 cycles using the NEBNext 2X Master Mix, after which 5μL of the reaction was subjected to qRT-PCR amplification to determine the optimum number of additional cycles for each sample. The remainder of the initial reactions were then amplified these additional number of cycles (ranging from 5 to 7). Library cleanup was performed using the Zymo DNA Clean and Concentrator-5 Kit, samples were eluted in water, and library quantification was performed using the KAPA Library Quantification Kit according to the manufacturer’s protocol. Additional library QC and sequencing was performed by MedGenome (Foster City, CA) on a NovaSeq at 2 × 100 cycles paired-end to a depth of approximately 50M paired reads per sample.
ATAC-seq Analysis
Trimmed and filtered reads were mapped to the mm10 reference genome using hisat2 (Kim et al., 2019). Picard was used to mark and remove duplicates. Peaks were called individually for each sample using MACS2 (Zhang et al., 2008). Bam files and peak sets for each sample were loaded into R for further processing. For visualization of genome tracks, coverage files were normalized based on reads in transcription start sites (TSS), exported as bigwig files, and visualized in the Integrative Genomics Viewer (IGV). A union peak set of 500bp peaks encompassing all samples was created as previously described (Corces et al., 2018) by iteratively merging overlapping peaks. The peak by sample counts matrix was then imported into DESeq2 for differential analysis (Love et al., 2014). Chromvar was used to quantify TF activity in each sample (Schep et al., 2017). HOMER was used to identify motifs enriched in specific differential peak sets (Heinz et al., 2010). For HOMER analysis, the union peak set was used as background.
Human HNSCC RNA-seq analysis
Human HNSCC tissue collection was approved by the Stanford Research Compliance Office and was performed according to institutional guidelines under Stanford IRB protocol 38502, “Modeling the Role of Lymph Node Metastases in Tumor-Mediated Immunosuppression”. All sequencing data are publicly available from NCBI’s Gene Expression Omnibus at GEO accession GSE113839. HNSCC primary samples available were included (two outliers were removed) in the study (see Table S3), and no covariate analyses were performed. Following tumor resection, tumors were dissociated and sorted by FACS into subsets of fibroblasts, leukocytes, and tumor cells using EPCAM, FAP, CD45, and CD31 surface markers. Samples were sequenced on an Illumina Hiseq4000. Identification of shared genes between the human HNSCC dataset and mouse melanoma dataset was based upon differentially expressed genes with log2(FC) ≥ 1 and adjusted p-val < 0.05. Differentially expressed genes in humans were determined by comparing node-positive (N+, n = 10) patients to node-negative (N0, n = 4) patients. In mice, they were determined by comparing late-generation lines to early-generation lines. Interferon-related genes were identified using the Interferome v2 database as described above.
Single-Cell RNA-seq Sample Preparation and Analysis
LNs were harvested in HBSS supplemented with 2% FBS (HBSSF) on ice. LNs were subjected to mincing and digestion with Collagenase 4 (Worthington) in RPMI-1640 for 10 minutes at 37°C prior to dissociation on 70μm strainers. Suspensions were washed twice with HBSSF, counted, and resuspended in PBS + 0.04% bovine serum albumin (Sigma). 10X Genomics library preparation was performed according to the manufacturer’s protocol by the Stanford Genome Sequencing Service Center.
Cell Ranger (version 3.1.0) was used to align reads (mm10, 3.0.0) and generate feature-barcode matrices for each sample (parental, LN6, or no tumor). Downstream analyses of gene expression matrices were performed in R (version 4.0.2) using the Seurat package (version 4.0) (Hao et al., 2021). In brief, genes expressed in fewer than 10 cells were removed, and low-quality cells were removed if they had unique feature counts greater than 5000 or less than 300 or have mitochondrial counts greater than 20%. Potential cell doublets were manually filtered by further inspecting co-expressing canonical markers. About 82% of the cells were kept in the analyses for each sample. Data were then normalized with log transformation and 2000 features with high variations were included for clustering with cluster resolution of 1 using FindNeighbors and FindClusters functions. Nonlinear dimensional reduction (UMAP) was obtained using RunUMAP function with umap-learn and shared nearest neighbor (SNN) settings. Cluster cell type assignment was performed manually by inspecting canonical markers.
WES Analysis
Raw sequencing reads were filtered, and adapters trimmed using the AGeNT Surecall Trimmer v.4.0.1, and quality was confirmed using FastQC v.0.11.3. Reads were aligned to the mouse mm10 (GRCm38.87) genome with bwa v.0.7.12 (Li and Durbin, 2009). Picard v2.17.0 was used to calculate alignment metrics and remove duplicates. SAMtools (Li et al., 2009) was used to remove reads with a MAPQ < 5. Sorting and indexing were performed with Samtools. MuTect2 (GATK v.4.0.0.0) was used for mutation calling with the merged mouse dbSNP142 vcf file acquired from ftp://ftp-mouse.sanger.ac.uk/current_snps/. Calls were filtered with FilterMutectCalls and SnpSift. Variants were annotated with SnpEff v.4.3 (Cingolani et al., 2012) for coding regions only using the –no-downstream, -no-intergenic, -no-intron, -no-upstream, and –no-utr parameters. Driver gene mutations were confirmed by manual inspection using the Integrative Genomics Viewer (Broad Institute). Neoantigens were determined using MuPeXI v. 1.2.0 (Bjerregaard et al., 2017) with expression data acquired from the TPM output of Salmon (see “RNA Sequencing Analysis” above). MHC-I peptide binding affinities were determined for H-2Db and H-2Kb for length from 9 to 11 amino acids. MuPeXI was used in conjunction with NetMHCpan v.4.0 (Jurtz et al., 2017) and Variant Effect Predictor (VEP) v.87.27 (McLaren et al., 2016). Genome track plot was generated with Circos v.0.69.4 (Krzywinski et al., 2009). Mutation histogram tracks were set to a range of 0 to 150. Mutation and neoantigen bar plots and heatmaps were generated in R.
In vivo LN Metastatic Competition Assays
B16-F0-mWasabi and LN6-987AL-tdTomato (or B16-F0-tdTomato and LN6-987AL-mWasabi) lines were admixed following dissociation in Accutase and resuspension in phenol-red-free DMEM at a ratio of 1:1. Mixed cell suspensions of 2×10⁵ total tumor cells were injected into the flanks of C57BL/6J female mice and allowed to grow for 32 days after which mice were euthanized and draining LNs were processed for flow cytometric analysis (gated on CD45−) or histological evaluation as described below. Lungs were inflated with PBS and imaged using an I VIS Spectrum imager (Caliper Life Sciences) or a Nikon SMZ1000 Stereo Dissection microscope equipped with metal halide fluorescence illumination. In some instances, LNs were also imaged on the dissection scope prior to processing for flow cytometry. Images were acquired with Nikon NIS-Elements software.
In vivo Metastatic Priming (Tail Vein Challenge) Experiments
Eight-week-old wild-type C57BL/6 female mice were injected with B16-F0, LN6-987AL, or LN8-1198AR into the subcutaneous region of the flank as described above. Following 13 to 14 days of growth, 2.5×10⁵ B16-F0-tdTomato or MC38-tdTomato cells, resuspended in phenol-red-free DMEM, were injected into the lateral tail veins of the mice. After 9 to 10 additional days of growth, mice were euthanized, and metastases were quantified based on gross appearance of visible nodules in the lungs and fluorescence microscopy on a Nikon fluorescence dissection microscope. These experiments were also performed in NOD-scid Il2rgnull (NSG) and OT-II mice, acquired from Jackson (005557 and 004194, respectively) and bred in our facility at Stanford University under sterile conditions.
For LT-αnull studies, Lta−/− mice were acquired from Jackson (002258) and bred in our facilities at Stanford University. Wild-type splenocytes were isolated from eight-week-old female C57BL6/J mice. Spleens were dissociated and processed through 70μm cell strainers. Cells were subjected to ACK lysis, washed three times with PBS, resuspended in phenol-red-free DMEM, and injected into eight-week-old recipient C57BL/6J wild-type or Lta−/− mice by retroorbital injection. Equivalent numbers of donor and recipient mice were used. Three days later, 2 ×10⁵ LN6-987AL cells were injected into the flanks of the mice. 14 days later, B16-F0-tdTomato cells were injected into the lateral tail veins of the mice. After nine additional days, mice were euthanized and the lungs were harvested, inflated with PBS, and imaged on a Nikon fluorescence dissection microscope.
For intra-LN transplantation experiments, tumors were implanted into wild-type mice during a brief surgery. 1×10⁵ B16-F0 or LN6-987AL cells were resuspended in 20μL of phenol-red-free DMEM. Animals were anesthetized with 2.5% isofluorane and injected with 100μg/kg buprenorphine intraperitoneally, prior to surgery. Fur was removed with surgical clippers and the surgical area was sterilized with betadine and 70% ethanol. The left inguinal LN was exposed through a midline incision, and the cell suspension was injected with a 30G insulin syringe. Following injection, the skin was closed with 7mm wound clips (Roboz). Five days after intra-LN injections, 1×10⁵ B16-F0-tdTomato cells were injected into the lateral tail veins as described above. After 11 days of additional growth, mice were euthanized, and lung metastases were quantified.
Tissue Processing and Flow Cytometry
LNs were harvested in HBSS on ice. LNs were mechanically dissociated on 70μm cell strainers and washed with PBS supplemented with 2% FBS and 2mM EDTA (FACS Buffer, FB). Tumor tissue was processed in an analogous manner, but also subjected to mincing and digestion with Collagenase 4 (Worthington) in RPMI-1640 for 20 minutes at 37°C prior to dissociation on 70μm strainers. In some experiments, LNs were also digested with Collagenase 4 for 10 minutes at 37°C prior to mechanical dissociation. Cells were stained for viability using LIVE/DEAD Fixable Blue Dead Cell Stain (Thermo, L34962). Surface staining was performed on ice prior to fixation. Cells were fixed and permeabilized using the eBioscience FoxP3 Fixation/Permeabilization kit (Thermo, 00-5521-00). Intracellular staining was performed on ice, and cells were washed twice in permeabilization buffer prior to transfer back into FB. The following antibodies were used for flow cytometric analysis: Fc Block (BD Biosciences, 2.4G2), CD45 (BioLegend, 30-F11), CD3 (BioLegend, 17A2), CD4 (BioLegend, RM4-5), CD8a (BioLegend, 53-6.7), FoxP3 (eBioscience, NRRF-30 or FJK-16s or BD Pharmigen, MF23), CD25 (BioLegend, PC61), PD-1 (BioLegend, RMP1-30 and 29F.1A12), CD44 (BioLegend, IM7), CD62L (BioLegend, MEL-14), Ki-67 (BioLegend, 16A8), B220 (BioLegend, RA3-6B2), CD69 (BioLegend, H1.2F3), Granzyme B (BioLegend, GB11), IFNγ (BioLegend, XMG1.2), CD11c (BioLegend, N418), CD11b (BioLegend, M1/70), CD103 (BioLegend, 2E7), Xcr1 (BioLegend, ZET), I-A/I-E (BioLegend, M5/114.15.2), Ly-6G (BioLegend, 1A8), F4/80 (BioLegend, BM8), PD-L1 (BioLegend, 10F.9G2), SIRPα (BioLegend, P84), CD45.1 (BioLegend, A20), CD45.2 (BioLegend, 104), pStat1 (pY701) (BD Phosflow, 4a), pStat3 (pY705) (BD Phosflow, 4/P-STAT3), pStat4 (pY693) (BD Phosflow, 38/p-Stat4), and pStat5 (pY694) (BD Phosflow, 47/Stat5(pY694)). Samples were run on LSR II and LSRFortessa cytometers (Becton Dickinson) and analyzed using FlowJo V10 software (TreeStar). Absolute counts were determined busing SPHERO AccuCount Fluorescent Particles (Spherotech), according to the manufacturer’s guidelines.
For flow cytometric analysis of cell lines, cells were dissociated with Accutase, washed with complete DMEM, and resuspended and stained in PBS with 2% FBS. The following antibodies were used: PD-L1 (BioLegend, 10F.9G2), H-2Kb (BioLegend, AF6-88.5), and H-2Db (eBioscience, 28-14-8). 4’,6-Diamidino-2-Phenylindole Dihydrochloride (DAPI) was used to stain for viability.
For assessment of Tregs in MMTV-PyMT LNs, collection of data was described previously (Spitzer et al., 2017). LNs of untreated mice were evaluated for the presence of Tregs based upon LN status. Positive LNs were defined as samples with >0.5% of cells staining positive for PyMT.
For assessment of NKG2D ligand levels, cell lines were dissociated with Accutase, washed with complete DMEM, resuspended and added to untreated 6-well plates at a concentration of 106 cells/well. 4μg of recombinant mouse NKG2D-Fc Chimera (R&D Systems, 139-NK-050) was added per well and incubated at 37°C for 90 min. Cells were then washed and stained with 5μL anti-human IgG Fc (BioLegend, M1310G05) or Rat IgG2a isotype control (BioLegend, RTK2758), DAPI, and run on an LSRFortessa, as above.
MHC-II-Ova tetramer staining was performed using I-A(b) chicken Ova 329-337 AAHAEINEA BV421-Labeled Tetramer or control I-A(b) human CLIP 87-101 PVSKMRMATPLLMQA BV421-Labeled Tetramer (graciously provided by the NIH Tetramer Facility). LN suspensions were resuspended in complete RPMI, split into two wells of a 96 wells plate each, and incubated with 6μg/mL Ova-tetramer or control-tetramer for 90 minutes at 37°C with 5% CO2. Cells were subsequently washed with FB and subjected to surface staining, fixation and permeabilization, and intracellular staining for FoxP3 as described above.
For broad immunophenotyping analysis of myeloid populations (Fig. 4), wild-type C57BI/6J mice were implanted with 2×10⁵ B16-F0 parental cells subcutaneously and 7.5×10⁴ LN6-987AL cells were surgically implanted into LNs as described in the “Tumor Line Generation and Transplantation Studies” section, above. LN6 cells were implanted 8 days after subcutaneous injections, and mice were euthanized 5 days after intra-LN injections. Some mice received parental and LN6 tumors (LN+), some received parental tumors and sham LN injections (LN−), and some received no primary and sham LN injections (naïve). LNs were isolated and processed as described above, including digestion with Collagenase 4 for 10 minutes at 37°C. For immunophenotyping of the Braf melanoma GEMM, BRafCA;PtenloxP;Tyr::CreERT2 mice (Dankort et al., 2009) were acquired from Jackson Labs (JAX stock # 013590) and bred in our animal facility. 8-week-old BrafV600E/+;PtenloxP/loxP;Tyr::CreERTg/+ mice (or control genotypes lacking the mutant Braf or Cre alleles) were administered 20μL of 5mM 4-hydroxytamoxifen (Sigma) in DMSO topically. After approximately 10 weeks following induction, mice were euthanized and draining LNs were harvested. LNs were processed for flow cytometry as described above.
In vitro IFN Stimulation and Phospho Flow
Cells were seeded in 6-well plates 24 hours prior to stimulation. Recombinant mouse IFN-α (PBL Assay Science) at a concentration of 1,500 U/mL, recombinant mouse IFN-γ (BioLegend) at a concentration of 50 μg/mL, or both were added to wells and incubated at 37°C and 5% CO2. For evaluation of MHC-I and PD-L1 expression, cells were stimulated for 24 hours prior to washing and preparing for flow cytometry analysis as described above.
For phospho-Stat experiments, cells were stimulated with the IFNs for 15 minutes at 37°C. Cells were immediately fixed with BD Fixation Buffer (BD Biosciences) for 10 min at 37°C. Cells were washed with FB, dissociated from the tissue culture plates with cell scrapers, and transferred to FACS tubes. Cells were permeabilized with ice cold BD Phosflow Perm Buffer III (BD Biosciences) for 30 minutes on ice with vortexing. Cells were washed with FB and stained with pStat antibodies at the concentrations recommended by the manufacturers. Samples were run on a BD LSRFortessa.
Generation and FOXP3 Quantification of Human HNSCC Tissue Microarray
FFPE tissue blocks of 79 patients with head and neck squamous cell carcinoma were collected by the Stanford Department of Pathology. For each patient without evidence of lymph node metastasis (pathological N stage of N0), tissue from benign lymph nodes was collected. For each patient with lymph node metastases (pathological N stage of N1-N3), tissue from metastatic lymph nodes was collected. Malignancy diagnosis was performed by board-certified surgical pathologist. Tissue microarrays with 1mm diameter cores were assembled and digitized using Leica Aperio whole slide scanner with 40x magnification.
To evaluate immunohistochemistry staining for FOXP3, we first applied Watershed segmentation to detect cells on each of the TMA cores using Python packages of Scikit-image (van der Walt et al., 2014) and openCV (Bradski, 2000). Next, a staining intensity score for each cell was calculated by averaging pixel intensities of DAB (brown) staining within the nucleus. We defined the threshold that classifies cells into positive and negative groups as k standard deviations above the mean value of the staining intensity scores (Bankhead et al., 2017). To find the best value of k, we manually annotated positive cells on regions of interest and assessed the performance of different k values for thresholding. We then classified all the cells into FOXP3 positive or negative based on the appropriate threshold and quantified FOXP3 positive cell percentage for each of the TMA cores.
Generation of Cd274 Overexpressing Tumor Lines
Total RNA was isolated from the LN8-1205BL cell line using the RNEasy kit (Qiagen) and converted to cDNA with the iScript cDNA synthesis kit (BioRad). Two rounds of PCR were performed to amplify the Cd274 CDS and add a Kozak sequence and restriction sites. The primers were as follows: PCR1 forward: 5’-GCCACCATGAGGATATTTGCTGGCATTATATTC-3’, PCR1 reverse: 5’-CGGGAATTCTTACGTCTCCTCGAATTGTGTATC-3’, PCR2 forward: 5’-ATTACTAGTGCCGCCACCATGAGGATATTTGC-3’, PCR2 reverse: 5’-TCTAGACCCGGGAATTCTTACGTCTCCTCG-3’. The product was then cloned into the pLVX-EF1a-IRES-Hygro plasmid described above by restriction digest. Lentiviral particle production and viral transduction were performed as described above. Transduced cells were selected in Hygromycin B followed by sorting, as described above. Control cells were transduced with a pLVX vector lacking the Cd274 gene. B16-F0-cntrl or –Cd274 cells were transplanted into wild-type female mice as described above. Mice were euthanized 26 days following cell implantation and LN metastasis incidence was quantified.
CRISPR Knockouts
Cd274 was knocked out of the LN6-987AL cell line using the lentiCRISPR v2 plasmid (Sanjana et al., 2014). lentiCRISPR v2 was a gift from Feng Zhang (Addgene plasmid # 52961). Lentiviral packaging and transduction were performed as described above. All other genes were knocked out by transient transfection with PX458 (Ran et al., 2013) followed by FACS sorting for GFP. pSpCas9(BB)-2A-GFP (PX458) was a gift from Feng Zhang (Addgene plasmid # 48138). Following expansion, edited cells were stained for PD-L1 (BioLegend, 10F.9G2) or H-2Kb (BioLegend, AF6-88.5) and H-2Db (eBioscience, 28-14-8) and subjected to two rounds of sorting on a FACSAria II (BD). Guide RNAs were designed to minimize off-target effects following previously described approaches (Doench et al., 2016; Hsu et al., 2013). Guide RNA sequences are listed in Table S4.
In vitro Treg Induction Assays
FoxP3EGFP mice (Haribhai et al., 2007) were acquired from Jackson (006772) and bred in our facility at Stanford University. Splenocytes were harvested from tumor-naïve female FoxP3EGFP mice. Spleens were subjected to mechanical dissociation on 70μm cell strainers and washed with HBSS supplemented with 2% FBS (HBSSF). Erythrocytes were lysed with Ammonium-Chloride-Potassium (ACK) lysing buffer. Magnetic isolation of naïve CD4 T cells was performed using the MojoSort Mouse naïve CD4 T Cell Isolation Kit (BioLegend, 480040) according to the manufacturer’s instructions. Cell suspensions were stained for lineage markers and sorted on a FACSAria II for the GFP−lin− cells. Sorting was performed to ensure no preexisting Tregs (e.g., natural Tregs) remained following magnetic isolation. 3×10⁵ lymphocytes were combined with 1.5×10⁵ tumor cells (B16-F0, LN6-987AL, or LN8-1198AR) and 3×10⁵ anti-CD3/CD28 Dynabeads (Thermo) in 100μL of RPMI-1640 supplemented with 10% FBS, 2mM L-glutamine, 15mM HEPES, 14.3 mM 2-mercaptoethanol, 1mM Sodium Pyruvate, 1 × MEM Non-Essential Amino Acids Solution (Thermo, 11140050), and 4ng/mL hTGF-β1 (Peprotech). CD3/28 stimulation was performed to mimic TCR ligation and antigen recognition. Following 72 hours of culture, cells were washed and stained for analysis by flow cytometry as described above.
Treg Depletion Studies
Foxp3DTR mice were acquired from Jackson (016958) and bred in our facility at Stanford University. Eight-week-old female Foxp3DTR mice were injected with 2 ×10⁵ B16-F0 or LN6-987AL cells resuspended in phenol-red free DMEM into their flanks. Mice were administered diphtheria toxin (25mg/kg) or PBS control by intraperitoneal injection on days 7, 8, and 15 following injection of tumor cells. Mice were euthanized on day 23, and LN metastases were quantified.
For lung seeding experiments, 2 ×10⁵ LN6-987AL cells were implanted and DT or PBS were administered according to the regimen described above. On day 14 following subcutaneous implantation of the LN6-987AL cells, 2 ×10⁵ B16-F0-tdTomato cells were injected intravenously into the lateral tail veins. After 9 additional days, mice were euthanized, and their lungs were harvested and imaged for metastases on a fluorescence dissection microscope as previously described.
OT-I Co-Culture Studies
OT-I mice were acquired from Jackson (003831) and bred in our facility at Stanford University. Inguinal, axillary, and brachial LNs and spleens were harvested from female OT-I mice through mechanical dissociation on 70μm cell strainers and washed with FB. Erythrocytes were lysed with Ammonium-Chloride-Potassium (ACK) lysing buffer. Magnetic isolation of CD8 T cells was performed using the EasySep Mouse CD8 T cell Isolation Kit (StemCell, 19853) according to the manufacturer’s protocol. 3×10⁵ lymphocytes were combined with 1.5×10⁵ tumor cells (B16-F0, LN8-1205BL, B16-FO-Ova, orLN8-1205BL-Ova) in 100μL of RPMI-1640 supplemented with 10% FBS, 2mM L-glutamine, 15mM HEPES, and 14.3 mM 2-mercaptoethanol. After 24 hours of culture, cells were processed for analysis by flow cytometry. Staining and analysis were performed as described in the “Tissue Processing and Flow Cytometry” section for viability (LIVE/DEAD blue), surface (CD45, CD8α, CD69), and intracellular (Granzyme B, IFNγ, and Ki-67) stains.
For differential cytotoxicity studies, B16-F0-Ova and LN8-1205BL-Ova cells were stained with 5μM CellTrace CFSE (Thermo, C34554) and CellTrace Violet (Thermo, C34571), respectively. OT-I CD8 T cells were isolated, as previously described. Labelled B16-F0-Ova and LN8-1205BL-Ova cells were combined at a 1:1 ratio, and 2 × 10⁴ total tumor cells were cultured with various ratios of lymphocytes (E:T ranging from 1:1 to 10:1) in 100μL total volume of RPMI-1640 supplemented with 10% FBS, 2mM L-glutamine, 15mM HEPES, 14.3 mM 2-mercaptoethanol, and 1mM Sodium Pyruvate. After 24 hours of culture, cells were isolated by trypsinization (keeping the supernatant containing the cells in suspension). The LIVE/DEAD Fixable Near-IR Dead Cell Stain Kit (Thermo, L10119) was used to stain for viability, and the culture was stained for CD8α+ cells to help distinguish T cells from tumor cells. Viability was then assessed by flow cytometry where the two tumor types were distinguished by the CellTrace stains.
OT-I Growth and Tumor-Free Survival Studies
Cell suspensions of 2×10⁵ cells in phenol-red free DMEM were injected into the subcutaneous region of the left flank of eight-week-old wild-type C57BL/6 or OT-I mice following removal of fur with surgical clippers. Tumor growth was monitored Q2D until mice reached euthanasia criteria. The Kaplan-Meier curve denotes the first day at which a tumor was detected in the OT-I mice.
NK Cell Cytotoxicity
Splenocytes were harvested from C57BL/6J mice as described above. NK cells were purified by magnetic bead separation using the EasySep Mouse NK Cell Isolation Kit (STEMCELL Technologies) according to the manufacturer’s protocol. Tumor cells were dissociated in Accutase and resuspended at 2×10⁶ cells/mL of HBSS supplemented with 2% FBS (HBSSF) and 5μM Calcein-AM (Life Technologies). Cells were stained for one hour at 37°C followed by washing in HBSSF. NK cells were added to tumor cells at a ratio of 10:1 in RPMI-1640 supplemented with 10% FBS, 2mM L-glutamine, 15mM HEPES, and 14.3 mM 2-mercaptoethanol and cultured at 37°C for four hours. The plates were then centrifuged, and the supernatants were harvested and read on a spectrophotometer (Perkin Elmer, Victor X4). 10% Tween-20 was used as a positive control for 100% lysis, and tumor cells cultured alone were used to measure spontaneous lysis. Specific lysis was calculated as:
NK Cell Depletion Studies
C57BL/6 wild-type female mice were implanted with 2 × 10⁵ B16-F0-Cd274 tumor cells into the left flank. The PD-L1 overexpressing variant was used to ensure metastases to LNs would grow to a detectable size. To deplete NK cells, mice were administered 100μg of NK1.1 (Bio-X-Cell, PK136) or isotype control (Bio-X-Cell, C1.18.4) antibodies intraperitoneally once per week beginning two days prior to tumor implantation, and LN metastases were evaluated on day 26. For B2m knockout rescue studies 2 × 10⁵ LN6-987AL-sgB2m (or control guide RNA) cells were implanted into the left flank and mice were treated with the same anti-NK1.1 depletion regimen. Mice were euthanized and LNs were quantified on day 30.
Adoptive Transfer Studies
Suspensions of 2×10⁵ B16-F0 cells in phenol-red free DMEM were injected into the subcutaneous region of the left flank of C57BL/6J female mice following removal of fur with surgical clippers. 9 days later, suspensions of 7.5×10⁴ LN6-987AL cells in phenol-red free DMEM were injected directly into the LN following the procedure described in the “In vivo Metastatic Priming (Tail Vein Challenge) Experiments” section above. Control (sham) injections consisted of intra-LN injections of phenol red free DMEM alone. 4 days later, LNs were harvested, dissociated, and leukocytes were FACS sorted from cell suspensions based on staining for CD45. 9×10⁵ purified leukocytes were transferred to wild-type tumor-naïve recipients by retro-orbital injection. After 4 additional days, recipient mice were challenged with tail vein injections of B16-F0-tdTomato, and resultant lung metastases were quantified.
For Treg adoptive transfer studies, FoxP3EGFP mice were implanted with B16-F0 tumors subcutaneously, and LN6-987AL cells (or sham) were injected intra-LN 7 days later, as above. After 5 additional days, LNs were harvested and mechanically dissociated. FoxP3+ Tregs were purified by FACS and transferred to recipient mice by retro-orbital injection. 4 days prior to transfer, recipient mice were implanted with B16-F0 subcutaneous tumors, and 1 day prior to transfer were challenged with tail vein injections of B16-F0-tdTomato cells. 9 days following adoptive Treg transfer, mice were euthanized, and lung metastases were quantified.
For antigen-specific in vivo Treg polarization studies, splenocytes were isolated from CD45.2 OT-II mice (Jackson, 004194) and CD45.2 Dendra2 reporter mice (018397). Naïve CD4 T cells were purified by FACS as CD8b−NK1.1−CD11b−CD11c−B220−CD25−CD44−CD62L+. Reporter and OT-II naïve CD4 T cells were mixed at a 1:1 ratio, which was confirmed by flow cytometry prior to adoptive transfer. CD45.1 wild-type recipient mice (Jackson, 002014) were implanted with subcutaneous B16-F0-Ova or LN8-1205BL-Ova tumors two days prior to adoptive transfer. Naïve CD4 T cells were transferred by retro-orbital injection, and after three weeks of tumor growth, mice were euthanized and draining inguinal LNs were harvested. Presence or absence of LN metastases was determined by visual inspection. LNs were mechanically dissociated and processed for MHC-II-Ova-tetramer staining and analysis by flow cytometry, as above.
Immunohistochemical Analysis
Tissues were isolated and fixed in 4% paraformaldehyde (PFA) or 10% buffered formalin. For frozen sections, primary tumors and lungs were fixed in 4% paraformaldehyde (PFA), left in 30% w/v sucrose at 4°C overnight, and embedded in Optimal Cutting Temperature (OCT) compound (Tissue-Tek) the following day. Embedded tissues were frozen in isopentane cooled by liquid nitrogen. For paraffin sections, lungs were inflated with 4% PFA or 10% buffered formalin prior to extraction. Tissues were fixed at 4°C followed by transfer to 70% ethanol and subsequent embedding in paraffin.
The human malignant melanoma tissue microarray (US Biomax, ME2082c) was processed in a similar fashion as the paraffin embedded mouse sections. Slides were heated according to the manufacturer’s suggestions and dewaxed in xylene followed by ethanol gradation and antigen retrieval. Following blocking for endogenous enzymes (Agilent, S2003) and non-specific binding (Agilent X0909), slides were stained with anti-PD-L1 antibody (CellSignaling, E1L3N) overnight at 4°C. Following washing, arrays were stained with the ImmPRESS-AP anti-rabbit IgG alkaline phosphatase polymer detection kit (Vector Laboratories, MP-5401) and developed with ImmPACT Vector Red Alkaline Phosphatase Substrate (Vector Laboratories, SK-5101). Arrays were imaged on a Zeiss LSM 700 confocal microscope with the 555nm laser in the fluorescence mode to enhance specificity of detection from areas with high melanin content. Scoring of PD-L1 staining was performed in a blinded manner where each biopsy was determined to be either positive or negative for PD-L1 staining.
Luminex
Luminex cytokine profiling of cell culture supernatants and serum from tumor-bearing mice was performed by the Stanford Human Immune Monitoring Core using a Luminex 200 instrument. Serum was collected in Terumo Capiject T-MGA gel barrier serum collection tubes following cardiac puncture. All samples were subjected to a 10 minute 14,000RPM spin prior to Luminex analysis to remove cell debris.
Quantification and Statistical Analyses
All statistical tests were performed with Prism (GraphPad) and are described as follows except where otherwise noted in figure legends. For all figures, *P < 0.05, **P < 0.01, ***P < 0.001, ****p < 0.0001. For most data, replicates are shown as individual points, and where summary data is presented (e.g., transcript levels in human data sets), the number of replicates (n) is noted in the figure legends. All comparisons involving more than two groups utilize tests that adjust for multiple comparisons. Unless otherwise noted, effect sizes are depicted as means (by bar height or horizontal line). Comparisons of two conditions (e.g., LN or lung metastasis incidence, size, etc.) were evaluated using the Two-Tailed Mann-Whitney U test (Wilcoxon rank-sum test) unless otherwise noted. Comparisons of three or more conditions (e.g., CRISPR knockouts, flow cytometry percentages/counts, depletion studies, etc.) were performed using a One-Way ANOVA with Dunnett’s multiple comparison test. Longitudinal studies (e.g., tumor growth) were performed with a Two-Way ANOVA with Sidak’s multiple comparison test. Comparisons of categorical variables were performed with Fisher’s Exact Test. Comparisons of LN metastasis incidence between the various LN lines and the parental were performed using a One-Way ANOVA with Dunnett’s multiple comparison test (comparing each group to the parental). Comparisons of Treg induction and NK cytotoxicity in vitro were evaluated using a two-tailed paired student’s t test (where pairing was performed between T cells from the same mouse). Human TMA PD-L1 positivity was compared by Fisher’s Exact Test. Human TCGA statistics were calculated in R using the FSA package (v.0.8.20) using the Dunn Kruskal-Wallis test with p-values adjusted for multiple comparisons using the Holm method. Tumor growth curves were compared by Two-Way ANOVA with Sidak’s multiple comparisons test. ATAC-seq TF motif P-values were calculated with HOMER. Flow cytometry data depicting different leukocyte subsets from the same experimental setup were typically generated from the same panel and experiment except where channel availability required additional panels or multiple experiments to be performed. Graphs of different cytokine levels measured by Luminex were also generated from one set of samples (assayed for multiple cytokines at once). In all other instances, data were generated from distinct experiments and the same samples were not measured for distinct experiments. Treg fractions in MMTV-PyMT mice were determined from reanalysis of our previously published data sets (Spitzer et al., 2017). Data shown in the manuscript are representative of multiple independent experiments with the exception of RNA-seq, ATAC-seq, WES, and scRNA-seq data where all collected data and replicates are shown.
Supplementary Material
Figure S1 | LN lines exhibit an enhanced LN-metastatic phenotype, related to Figure 1. (A) Percentage of mice that gave rise to tumor lines from the draining LN (left inguinal) that also yielded cell lines derived from non-draining LNs for each generation of cell lines. In vitro (B) and in vivo subcutaneous (C) growth of the parental and LN6-987AL lines. (D) Mice were implanted with B16-F0-mWasabi and LN6-987AL-tdTomato cells at an equal ratio and metastases were quantified after one month of growth. For individual mice, the percentage of tumor cells in the LNs that were of LN6 origin (x-axis) is compared to the number of tumors in the lungs of LN6 origin (y-axis). R2 and P values reflect Pearson Correlation. Error bars in (B) are range of two replicate wells. Error bars in (C) are s.e.m. of n = 8 mice per condition. *P < 0.05, ****p < 0.0001.
Figure S2 | RNA-seq and WES of LN metastatic lines reveal conserved upregulation of interferon stimulated genes without acquisition of additional driver mutations, related to Figure 2. (A) Phylogenetic tree relationships between the various LN lines. Highlighted nodes were subjected to RNA sequencing. IL, left inguinal; IR, right inguinal; AL, left axillary; BL, left brachial; AR, right axillary; BR, right brachial. (B) PCA generated from the top highly variable genes (HVGs) across all samples, agnostic to generation. Colors denote LN line generation. (C) PCA generated from the top differentially expressed genes (DEGs) between the early- and late-generation LN lines. (D) Normalized regularized log-transformed gene expression comparing LN8 lines to the parental line (B16-F0). Light blue genes have |log2(fold change)| > 1 and Padj < 0.01; dark blue genes are those that also are present in the Interferome database (Rusinova et al., 2013). (E) Mutational status of known melanoma driver genes across the cell lines. (F) GSEA results for additional enriched gene sets from the Hallmarks, Motifs, and Symbols gene set databases. (G) Transcript expression levels of the sequenced LN lines across the generations, colored by stage for various ISGs. TPM, transcript per kilobase million. (H) PCA plot of ATAC-seq profiles for parental, LN3, and LN7 lines. (I) Intersection plot depicting the number of shared and unique ATAC peaks between the three classes of lines.
Figure S3 | LN metastases maintain IFN signaling in the absence of exogenous ISGs, related to Figure 3. (A) Median fluorescence intensity values for parental or LN6 tumor cells following excision from tumor-bearing mice. The cells were stained for PD-L1, H-2Db, and H-2Kb and evaluated by flow cytometry. (B) Analysis of H-2Db levels on the parental (black) and LN6-987AL (red) tumor lines after 23 and 20 passages in vitro, respectively. (C) Transcript levels for the IFN and IFNR genes across the LN generations. (D) Surface levels of MHC-I and PD-L1 molecules in the control and Ifnb knockout versions of the LN6-987AL cell line. (E) Transcript levels of the various Stat genes across LN generations. (F) phospho-Stat levels in parental, LN3, LN6, and LN7 lines unstimulated or immediately following stimulation with IFN-α or IFN-γ, quantified by flow cytometry. (G) MHC-I and PD-L1 basal surface levels for the control, IFNR knockout, and Stat1 knockout versions of the parental and LN6 lines. (H) Schematic depicting proposed model of acquisition of the IFN signature. Transient interactions between Ifnar1 and Ifnar2 (and perhaps components of the Ifngr) maintain Stat phosphorylation, but ISG expression is minimal as the ISRE and GAS TF binding sites are inaccessible. Following exposure to anti-tumor immune responses, perhaps mediated by T cells within the LNs, IFN signaling commences driving high levels of ISG expression. In the chronic setting, this signaling leads to epigenetic rewiring leaving GAS and ISRE sites accessible such that even in the absence of exogenous IFN, basal phospho-Stat dimers and the ISGF3 complex are capable of driving transcription of ISGs.
Figure S4 | MHC-I levels increase with increased LN metastatic capacity without loss of NKG2D ligand expression, related to Figure 4. (A) Transcript levels of the sequenced LN lines across the generations, colored by phylogenetic lineage for MHC-Ia and -Ib genes and (B) NKG2D ligand genes. TPM, transcript per kilobase million. (C) Binding of recombinant mouse NKG2D-Fc chimera to the various cell lines, quantified by flow cytometry. (D) MHC-I molecule expression by flow cytometry following knockout of B2m with two distinct sgRNAs (or control). (E) Tumor area within the inguinal (IL) LN following intra-LN implantation of the LN6-987AL line following knockout of B2m. (F) Model of MHC-I surface levels during LN metastatic progression. MHC-I surface levels in the primary tumor are limited by H2 expression (blue) despite higher levels of B2m protein. In response to NK pressures, tumors rapidly upregulate expression of H2 genes such that surface levels rapidly increase and are limited by B2m abundance. In response to chronic IFN signaling, ISGs, including B2m are gradually upregulated, resulting in additional modest increases in surface MHC-I levels. (G) Surface levels of PD-L1 and MHC-I in the parental B16-F0 (black), three LN6 lines (red), and the lung-metastatic line B16-F10 (blue). (H) Evaluation of PD-L1 expression by flow cytometry after knockout of Cd274 with two distinct sgRNAs or control. Padj in (A) calculated by DESeq2 comparing late-generation to early generation lines.
Figure S5 | LN metastases alter the immune repertoire of the involved LNs, related to Figure 5. (A) UMAP visualization of scRNA-seq populations colored by expression of various cell type distinguishing markers. (B, C) Violin plots depicting expression of various naïve and activation genes in the CD4 T cell clusters (B) and CD8 T cell clusters (C). (D) Violin plots depicting expression of various genes associated with suppressive neutrophil phenotypes across neutrophils from no tumor, parental tumor-bearing, and LN6 tumor-bearing mice. (E) Quantification of various myeloid populations and PD-L1 levels in the LNs by flow cytometry in mice with no tumors (naïve), primary tumors only (LN−), or primary tumors and LN metastases (LN+). (F) Braf melanoma GEMMs were induced with 4-HT, and following LN metastasis, immune populations were quantified by flow cytometry. P-values in (E) calculated by One-Way ANOVA with Dunnett’s post hoc test and (F) calculated by Two-Tailed Mann-Whitney U Test. *P < 0.05, **P < 0.01, ***p < 0.001, ****P < 0.0001.
Figure S6 | LN lines do not evade CD8 T cell immunity through classical immunoediting but instead induce Tregs, related to Figures 6 and 7. Subcutaneous growth of the LN6-987AL (A) and B16-F0 (B) tumors in wild-type and Rag2−/−;Il2rg−/− mice. (C) Representative H&E stains and quantification of tumor burden in lungs from the genetically engineered breast cancer MMTV-PyMT mice and MMTV-PyMT mice crossed with Rag2−/− miss at 25 weeks of age. (D) Ovalbumin-expressing parental and LN8 lines were co-cultured with CD8 T cells isolated from transgenic TCR OT-I mice. Activation and proliferation of the T cells were evaluated by flow cytometry by staining for CD69, Granzyme B, and Ki67. (E) Ovalbumin-expressing parental and LN8 tumor cells were labeled with CFSE and Cell Trace Violet, respectively, and mixed at a 1:1 ratio. OT-I CD8 T cells were added to the cultures at various effector to target (E:T) ratios, and viability of the tumor cells was evaluated by flow cytometry after 24 hours of culture. Representative flow plots are shown of tumor cells gated on the dead cell fraction. (F) Ovalbumin expressing lines were implanted into wild-type or OT-I mice. Growth curves of the tumors in wild-type mice are shown with solid lines and in OT-I mice are shown with dotted lines (black: parental; red: LN8). While 4 of 4 LN8 lines grew out in the OT-I mice, only 1 of 3 of the parental lines grew. Both lines exhibit delayed growth kinetics in OT-I mice. (G) MuPeXI analysis of neoantigens. WES was used to identify the top candidate neoantigens resulting from somatic mutations in the lines (ranked by MuPeXI Priority Score). Left: Predicted binding affinities of the top candidate peptides, calculated by NetMHC for binding to H-2Db or H-2Kb comparing the wild-type alleles to the mutant alleles. Middle: Allele frequency of the mutant genes producing the neoantigens. Right MuPeXI Expression Score (ES = tanh(TPM)). (H) Transcript expression levels of common melanoma antigens Pmel, Tyrp1, Mlana, and Dct. (I) Quantification of Tregs and their ratios to CD8 T cells from the draining LNs of mice bearing parental or LN6-987AL tumors. (J) Analysis of Treg population following in vitro co-culture of naïve CD4 T cells with tumor cell lines gated on CD4 T cells. (K) Luminex cytokine profiling of cell culture supernatants harvested from parental or LN4 and LN5 lines. (L) Luminex cytokine profiling of the serum of mice bearing subcutaneous parental or LN6-987AL tumors. (M) Transcript expression levels of Tgfb isoforms. (N) Primary tumor growth of mice bearing parental or LN6 tumors, treated with anti-TGF-β neutralizing antibodies or isotype controls. (O) Primary tumor growth in Foxp3DTR mice bearing parental or LN6 tumors treated with either PBS or diphtheria toxin (DT) to deplete Tregs. Error bars in (K) are range of two technical replicates. Scale bars, 2mm. P-values in (C) calculated by Mann-Whitney U Test, (D) One-Way ANOVA with Tukey’s post hoc test, (I, L) calculated by Unpaired Two-Tailed t-Test, (J) calculated by One-Way ANOVA with Dunnett’s post hoc test, (N) calculated by Two-Way ANOVA with Tukey’s post hoc test. *P < 0.05, **P < 0.01, ***P < 0.001, ****P < 0.0001, ****P < 0.0001, Fisher’s Exact Test.
Figure S7 | Metastatic Tolerance: a new model of cancer metastasis, related to Figure 7. Existing models of metastasis include the “Halstedian” model where tumors spread through lymphatics to LNs and subsequently to distant tissues and the “Systemic” model where tumors spread in parallel to LNs and distant tissues, and LN metastases bear no influence on distant metastases. Our proposed “Metastatic Tolerance” model posits that tumors spread first to LNs where they induce tumor-specific immune tolerance that subsequently spreads throughout the host (green arrows) to enable dissemination of primary tumors or LN metastases to distant tissues.
Highlights.
Chronic IFN signaling induces epigenetic rewiring of tumor cells and immune escape
MHC-I and PD-L1 expression enables evasion of NK cells and suppression of T cells
LN colonization induces broad alterations in the local immune repertoire
LN metastases induce antigen-specific Tregs that promote distant metastasis
Acknowledgements
The authors thank Xiangyue Zhang, Sameera Kongara, and David Chiu for critical evaluation of the manuscript and the NIH Tetramer Facility for MHC-II tetramers. This work was supported by NIH grants U54 CA209971 (Engleman, Plevritis, Sunwoo, and Gentles), U01CA260852 (Satpathy), UM1HG012076 (Satpathy), F32 CA189408 (Reticker-Flynn), and F31 CA196029 (Linde), the Parker Institute for Cancer Immunotherapy (Satpathy), a Pew-Stewart Scholars for Cancer Research Award (Satpathy), and the METAvivor Foundation (Reticker-Flynn). This work used the Genome Sequencing Service Center by Stanford Center for Genomics and Personalized Medicine Sequencing Center, supported by NIH S10OD025212, and NIH/NIDDK P30DK116074. The authors dedicate this manuscript to the memory of Kathy Reticker.
Footnotes
Publisher's Disclaimer: This is a PDF file of an unedited manuscript that has been accepted for publication. As a service to our customers we are providing this early version of the manuscript. The manuscript will undergo copyediting, typesetting, and review of the resulting proof before it is published in its final form. Please note that during the production process errors may be discovered which could affect the content, and all legal disclaimers that apply to the journal pertain.
Declaration of Interests
The authors declare no competing interests.
Inclusion and Diversity
We worked to ensure gender balance in the recruitment of human subjects. One or more of the authors of this paper self-identifies as an underrepresented ethnic minority in science. While citing references scientifically relevant for this work, we also actively worked to promote gender balance in our reference list.
References
- Ahmadzadeh M, Pasetto A, Jia L, Deniger DC, Stevanović S, Robbins PF, and Rosenberg SA (2019). Tumor-infiltrating human CD4+ regulatory T cells display a distinct TCR repertoire and exhibit tumor and neoantigen reactivity. Science Immunology 4, eaao4310. [DOI] [PMC free article] [PubMed] [Google Scholar]
- Ai HW, Olenych SG, Wong P, Davidson MW, and Campbell RE (2008). Hue-shifted monomeric variants of Clavularia cyan fluorescent protein: identification of the molecular determinants of color and applications in fluorescence imaging. BMC biology 6, 13. [DOI] [PMC free article] [PubMed] [Google Scholar]
- Ashburner M, Ball CA, Blake JA, Botstein D, Butler H, Cherry JM, Davis AP, Dolinski K, Dwight SS, Eppig JT, et al. (2000). Gene ontology: tool for the unification of biology. The Gene Ontology Consortium. Nat Genet 25, 25–29. [DOI] [PMC free article] [PubMed] [Google Scholar]
- Bakhoum SF, Ngo B, Laughney AM, Cavallo JA, Murphy CJ, Ly P, Shah P, Sriram RK, Watkins TBK, Taunk NK, et al. (2018). Chromosomal instability drives metastasis through a cytosolic DNA response. Nature 553, 467–472. [DOI] [PMC free article] [PubMed] [Google Scholar]
- Bankhead P, Loughrey MB, Fernandez JA, Dombrowski Y, McArt DG, Dunne PD, McQuaid S, Gray RT, Murray LJ, Coleman HG, et al. (2017). QuPath: Open source software for digital pathology image analysis. Sci Rep 7, 16878. [DOI] [PMC free article] [PubMed] [Google Scholar]
- Becht E, McInnes L, Healy J, Dutertre C-A, Kwok IWH, Ng LG, Ginhoux F, and Newell EW (2018). Dimensionality reduction for visualizing single-cell data using UMAP. Nature Biotechnology 37, 38. [DOI] [PubMed] [Google Scholar]
- Benci JL, Johnson LR, Choa R, Xu Y, Qiu J, Zhou Z, Xu B, Ye D, Nathanson KL, June CH, et al. (2019). Opposing Functions of Interferon Coordinate Adaptive and Innate Immune Responses to Cancer Immune Checkpoint Blockade. Cell 178, 933–948.e914. [DOI] [PMC free article] [PubMed] [Google Scholar]
- Benci JL, Xu B, Qiu Y, Wu TJ, Dada H, Twyman-Saint Victor C, Cucolo L, Lee DSM, Pauken KE, Huang AC, et al. (2016). Tumor Interferon Signaling Regulates a Multigenic Resistance Program to Immune Checkpoint Blockade. Cell 167, 1540–1554. e1512. [DOI] [PMC free article] [PubMed] [Google Scholar]
- Binnewies M, Mujal AM, Pollack JL, Combes AJ, Hardison EA, Barry KC, Tsui J, Ruhland MK, Kersten K, Abushawish MA, et al. (2019). Unleashing Type-2 Dendritic Cells to Drive Protective Antitumor CD4+ T Cell Immunity. Cell 177, 556–571. e516. [DOI] [PMC free article] [PubMed] [Google Scholar]
- Bjerregaard AM, Nielsen M, Hadrup SR, Szallasi Z, and Eklund AC (2017). MuPeXI: prediction of neo-epitopes from tumor sequencing data. Cancer Immunol Immunother 66, 1123–1130. [DOI] [PMC free article] [PubMed] [Google Scholar]
- Bolger AM, Lohse M, and Usadel B (2014). Trimmomatic: a flexible trimmer for Illumina sequence data. Bioinformatics 30, 2114–2120. [DOI] [PMC free article] [PubMed] [Google Scholar]
- Bos PD, Zhang XHF, Nadal C, Shu W, Gomis RR, Nguyen DX, Minn AJ, van de Vijver MJ, Gerald WL, Foekens JA, et al. (2009). Genes that mediate breast cancer metastasis to the brain. Nature 459, 1005–1009. [DOI] [PMC free article] [PubMed] [Google Scholar]
- Bradski G (2000). The OpenCV library. Dr Dobb’s Journal 25, 120–125. [Google Scholar]
- Brahmer JR, Tykodi SS, Chow LQM, Hwu W-J, Topalian SL, Hwu P, Drake CG, Camacho LH, Kauh J, Odunsi K, et al. (2012). Safety and Activity of Anti–PD-L1 Antibody in Patients with Advanced Cancer. New England Journal of Medicine 366, 2455–2465. [DOI] [PMC free article] [PubMed] [Google Scholar]
- Brown M, Assen FP, Leithner A, Abe J, Schachner H, Asfour G, Bago-Horvath Z, Stein JV, Uhrin P, Sixt M, et al. (2018). Lymph node blood vessels provide exit routes for metastatic tumor cell dissemination in mice. Science 359, 1408–1411. [DOI] [PubMed] [Google Scholar]
- Butler A, Hoffman P, Smibert P, Papalexi E, and Satija R (2018). Integrating single-cell transcriptomic data across different conditions, technologies, and species. Nature Biotechnology 36, 411–420. [DOI] [PMC free article] [PubMed] [Google Scholar]
- Chaffer CL, and Weinberg RA (2011). A Perspective on Cancer Cell Metastasis. Science 331, 1559–1564. [DOI] [PubMed] [Google Scholar]
- Chorro L, Suzuki M, Chin SS, Williams TM, Snapp EL, Odagiu L, Labrecque N, and Lauvau G (2018). Interleukin 2 modulates thymic-derived regulatory T cell epigenetic landscape. Nature Communications 9, 5368. [DOI] [PMC free article] [PubMed] [Google Scholar]
- Cingolani P, Platts A, Wang le L, Coon M, Nguyen T, Wang L, Land SJ, Lu X, and Ruden DM (2012). A program for annotating and predicting the effects of single nucleotide polymorphisms, SnpEff: SNPs in the genome of Drosophila melanogaster strain w1118; iso-2; iso-3. Fly 6, 80–92. [DOI] [PMC free article] [PubMed] [Google Scholar]
- Clark EA, Golub TR, Lander ES, and Hynes RO (2000). Genomic analysis of metastasis reveals an essential role for RhoC. Nature 406, 532–535. [DOI] [PubMed] [Google Scholar]
- Consortium TGO (2017). Expansion of the Gene Ontology knowledgebase and resources. Nucleic Acids Res 45, D331–d338. [DOI] [PMC free article] [PubMed] [Google Scholar]
- Corces MR, Granja JM, Shams S, Louie BH, Seoane JA, Zhou W, Silva TC, Groeneveld C, Wong CK, Cho SW, et al. (2018). The chromatin accessibility landscape of primary human cancers. Science 362, eaav1898. [DOI] [PMC free article] [PubMed] [Google Scholar]
- Corces MR, Trevino AE, Hamilton EG, Greenside PG, Sinnott-Armstrong NA, Vesuna S, Satpathy AT, Rubin AJ, Montine KS, Wu B, et al. (2017). An improved ATAC-seq protocol reduces background and enables interrogation of frozen tissues. Nature methods 14, 959–962. [DOI] [PMC free article] [PubMed] [Google Scholar]
- Dankort D, Curley DP, Cartlidge RA, Nelson B, Karnezis AN, Damsky WE Jr., You MJ, DePinho RA, McMahon M, and Bosenberg M (2009). Braf(V600E) cooperates with Pten loss to induce metastatic melanoma. Nat Genet 41, 544–552. [DOI] [PMC free article] [PubMed] [Google Scholar]
- De Togni P, Goellner J, Ruddle N, Streeter P, Fick A, Mariathasan S, Smith S, Carlson R, Shornick L, Strauss-Schoenberger J, et al. (1994). Abnormal development of peripheral lymphoid organs in mice deficient in lymphotoxin. Science 264, 703–707. [DOI] [PubMed] [Google Scholar]
- Deng W, Gowen BG, Zhang L, Wang L, Lau S, Iannello A, Xu J, Rovis TL, Xiong N, and Raulet DH (2015). A shed NKG2D ligand that promotes natural killer cell activation and tumor rejection. Science (New York, NY) 348, 136–139. [DOI] [PMC free article] [PubMed] [Google Scholar]
- Doench JG, Fusi N, Sullender M, Hegde M, Vaimberg EW, Donovan KF, Smith I, Tothova Z, Wilen C, Orchard R, et al. (2016). Optimized sgRNA design to maximize activity and minimize off-target effects of CRISPR-Cas9. Nature Biotechnology 34, 184. [DOI] [PMC free article] [PubMed] [Google Scholar]
- Dunn GP, Koebel CM, and Schreiber RD (2006). Interferons, immunity and cancer immunoediting. Nat Rev Immunol 6, 836–848. [DOI] [PubMed] [Google Scholar]
- Duong T, Proulx ST, Luciani P, Leroux JC, Detmar M, Koopman P, and Francois M (2012). Genetic ablation of SOX18 function suppresses tumor lymphangiogenesis and metastasis of melanoma in mice. Cancer Res 72, 3105–3114. [DOI] [PubMed] [Google Scholar]
- Edge SB, American Joint Committee on Cancer., and American Cancer Society. (2010). AJCC cancer staging handbook : from the AJCC cancer staging manual, 7th edn (New York: Springer; ). [DOI] [PubMed] [Google Scholar]
- Enquist IB, Good Z, Jubb AM, Fuh G, Wang X, Junttila MR, Jackson EL, and Leong KG (2014). Lymph node-independent liver metastasis in a model of metastatic colorectal cancer. Nat Commun 5, 3530. [DOI] [PubMed] [Google Scholar]
- Eyre TA, Wright MW, Lush MJ, and Bruford EA (2007). HCOP: a searchable database of human orthology predictions. Briefings in bioinformatics 8, 2–5. [DOI] [PubMed] [Google Scholar]
- Faries MB, Thompson JF, Cochran AJ, Andtbacka RH, Mozzillo N, Zager JS, Jahkola T, Bowles TL, Testori A, Beitsch PD, et al. (2017). Completion Dissection or Observation for Sentinel-Node Metastasis in Melanoma. New England Journal of Medicine 376, 2211–2222. [DOI] [PMC free article] [PubMed] [Google Scholar]
- Fidler IJ (1973). Selection of successive tumour lines for metastasis. Nature: New biology 242, 148–149. [DOI] [PubMed] [Google Scholar]
- Gershenwald JE, Thompson W, Mansfield PF, Lee JE, Colome MI, Tseng C.-h., Lee JJ, Balch CM, Reintgen DS, and Ross MI (1999). Multi-Institutional Melanoma Lymphatic Mapping Experience: The Prognostic Value of Sentinel Lymph Node Status in 612 Stage I or II Melanoma Patients. Journal of Clinical Oncology 17, 976–976. [DOI] [PubMed] [Google Scholar]
- Gray KA, Yates B, Seal RL, Wright MW, and Bruford EA (2015). Genenames.org: the HGNC resources in 2015. Nucleic Acids Res 43, D1079–1085. [DOI] [PMC free article] [PubMed] [Google Scholar]
- Grimm D, Bauer J, Wise P, Krüger M, Simonsen U, Wehland M, Infanger M, and Corydon TJ (2020). The role of SOX family members in solid tumours and metastasis. Seminars in Cancer Biology 67, 122–153. [DOI] [PubMed] [Google Scholar]
- Gu Y, Liu Y, Fu L, Zhai L, Zhu J, Han Y, Jiang Y, Zhang Y, Zhang P, Jiang Z, et al. (2019). Tumor-educated B cells selectively promote breast cancer lymph node metastasis by HSPA4-targeting IgG. Nature Medicine 25, 312–322. [DOI] [PubMed] [Google Scholar]
- Gundem G, Van Loo P, Kremeyer B, Alexandrov LB, Tubio JM, Papaemmanuil E, Brewer DS, Kallio HM, Hognas G, Annala M, et al. (2015). The evolutionary history of lethal metastatic prostate cancer. Nature 520, 353–357. [DOI] [PMC free article] [PubMed] [Google Scholar]
- Haffner MC, Mosbruger T, Esopi DM, Fedor H, Heaphy CM, Walker DA, Adejola N, Gürel M, Hicks J, Meeker AK, et al. (2013). Tracking the clonal origin of lethal prostate cancer. The Journal of clinical investigation 123, 4918–4922. [DOI] [PMC free article] [PubMed] [Google Scholar]
- Halsted WS (1907). I. The Results of Radical Operations for the Cure of Carcinoma of the Breast. Annals of surgery 46, 1–19. [DOI] [PMC free article] [PubMed] [Google Scholar]
- Hao Y, Hao S, Andersen-Nissen E, Mauck WM, Zheng S, Butler A, Lee MJ, Wilk AJ, Darby C, Zager M, et al. (2021). Integrated analysis of multimodal single-cell data. Cell 184, 3573–3587. e3529. [DOI] [PMC free article] [PubMed] [Google Scholar]
- Haribhai D, Lin W, Relland LM, Truong N, Williams CB, and Chatila TA (2007). Regulatory T Cells Dynamically Control the Primary Immune Response to Foreign Antigen. The Journal of Immunology 178, 2961–2972. [DOI] [PubMed] [Google Scholar]
- Heinz S, Benner C, Spann N, Bertolino E, Lin YC, Laslo P, Cheng JX, Murre C, Singh H, and Glass CK (2010). Simple Combinations of Lineage-Determining Transcription Factors Prime cis-Regulatory Elements Required for Macrophage and B Cell Identities. Molecular Cell 38, 576–589. [DOI] [PMC free article] [PubMed] [Google Scholar]
- Hess KR, Varadhachary GR, Taylor SH, Wei W, Raber MN, Lenzi R, and Abbruzzese JL (2006). Metastatic patterns in adenocarcinoma. Cancer 106, 1624–1633. [DOI] [PubMed] [Google Scholar]
- Hodis E, Watson Ian R., Kryukov Gregory V., Arold Stefan T., Imielinski M, Theurillat J-P, Nickerson E, Auclair D, Li L, Place C, et al. (2012). A Landscape of Driver Mutations in Melanoma. Cell 150, 251–263. [DOI] [PMC free article] [PubMed] [Google Scholar]
- Hsu PD, Scott DA, Weinstein JA, Ran FA, Konermann S, Agarwala V, Li Y, Fine EJ, Wu X, Shalem O, et al. (2013). DNA targeting specificity of RNA-guided Cas9 nucleases. Nature Biotechnology 31, 827. [DOI] [PMC free article] [PubMed] [Google Scholar]
- Jatoi I, Hilsenbeck SG, Clark GM, and Osborne CK (1999). Significance of Axillary Lymph Node Metastasis in Primary Breast Cancer. Journal of Clinical Oncology 17, 2334–2334. [DOI] [PubMed] [Google Scholar]
- Jongsma MLM, Guarda G, and Spaapen RM (2019). The regulatory network behind MHC class I expression. Molecular Immunology 113, 16–21. [DOI] [PubMed] [Google Scholar]
- Judd NP, Winkler AE, Murillo-Sauca O, Brotman JJ, Law JH, Lewis JS Jr., Dunn GP, Bui JD, Sunwoo JB, and Uppaluri R (2012). ERK1/2 regulation of CD44 modulates oral cancer aggressiveness. Cancer Res 72, 365–374. [DOI] [PMC free article] [PubMed] [Google Scholar]
- Jurtz V, Paul S, Andreatta M, Marcatili P, Peters B, and Nielsen M (2017). NetMHCpan-4.0: Improved Peptide-MHC Class I Interaction Predictions Integrating Eluted Ligand and Peptide Binding Affinity Data. J Immunol 199, 3360–3368. [DOI] [PMC free article] [PubMed] [Google Scholar]
- Kang Y, Siegel PM, Shu W, Drobnjak M, Kakonen SM, Cordón-Cardo C, Guise TA, and Massagué J (2003). A multigenic program mediating breast cancer metastasis to bone. Cancer Cell 3, 537–549. [DOI] [PubMed] [Google Scholar]
- Khan O, Giles JR, McDonald S, Manne S, Ngiow SF, Patel KP, Werner MT, Huang AC, Alexander KA, Wu JE, et al. (2019). TOX transcriptionally and epigenetically programs CD8+ T cell exhaustion. Nature 571, 211–218. [DOI] [PMC free article] [PubMed] [Google Scholar]
- Kim D, Paggi JM, Park C, Bennett C, and Salzberg SL (2019). Graph-based genome alignment and genotyping with HISAT2 and HISAT-genotype. Nat Biotechnol 37, 907–915. [DOI] [PMC free article] [PubMed] [Google Scholar]
- Krzywinski MI, Schein JE, Birol I, Connors J, Gascoyne R, Horsman D, Jones SJ, and Marra MA (2009). Circos: An information aesthetic for comparative genomics. Genome Research. [DOI] [PMC free article] [PubMed] [Google Scholar]
- Leong SPL, Zuber M, Ferris RL, Kitagawa Y, Cabanas R, Levenback C, Faries M, and Saha S (2011). Impact of nodal status and tumor burden in sentinel lymph nodes on the clinical outcomes of cancer patients. Journal of Surgical Oncology 103, 518–530. [DOI] [PubMed] [Google Scholar]
- Levine AG, Arvey A, Jin W, and Rudensky AY (2014). Continuous requirement for the TCR in regulatory T cell function. Nat Immunol 15, 1070–1078. [DOI] [PMC free article] [PubMed] [Google Scholar]
- Li H, and Durbin R (2009). Fast and accurate short read alignment with Burrows–Wheeler transform. Bioinformatics 25, 1754–1760. [DOI] [PMC free article] [PubMed] [Google Scholar]
- Li H, Handsaker B, Wysoker A, Fennell T, Ruan J, Homer N, Marth G, Abecasis G, and Durbin R (2009). The Sequence Alignment/Map format and SAMtools. Bioinformatics 25, 2078–2079. [DOI] [PMC free article] [PubMed] [Google Scholar]
- Liberzon A, Birger C, Thorvaldsdóttir H, Ghandi M, Mesirov Jill P., and Tamayo P (2015). The Molecular Signatures Database Hallmark Gene Set Collection. Cell Systems 1, 417–425. [DOI] [PMC free article] [PubMed] [Google Scholar]
- Love MI, Huber W, and Anders S (2014). Moderated estimation of fold change and dispersion for RNA-seq data with DESeq2. Genome Biology 15, 550. [DOI] [PMC free article] [PubMed] [Google Scholar]
- Lund Amanda W., Duraes Fernanda V., Hirosue S, Raghavan Vidya R., Nembrini C, Thomas Susan N., Issa A, Hugues S, and Swartz Melody A. (2012). VEGF-C Promotes Immune Tolerance in B16 Melanomas and Cross-Presentation of Tumor Antigen by Lymph Node Lymphatics. Cell Reports 1, 191–199. [DOI] [PubMed] [Google Scholar]
- Makohon-Moore AP, Zhang M, Reiter JG, Bozic I, Allen B, Kundu D, Chatterjee K, Wong F, Jiao Y, Kohutek ZA, et al. (2017). Limited heterogeneity of known driver gene mutations among the metastases of individual patients with pancreatic cancer. Nat Genet 49, 358–366. [DOI] [PMC free article] [PubMed] [Google Scholar]
- Malladi S, Macalinao DG, Jin X, He L, Basnet H, Zou Y, de Stanchina E, and Massagué J (2016). Metastatic Latency and Immune Evasion through Autocrine Inhibition of WNT. Cell 165, 45–60. [DOI] [PMC free article] [PubMed] [Google Scholar]
- Mangiola S, Hong MKH, Cmero M, Kurganovs N, Ryan A, Costello AJ, Corcoran NM, Macintyre G, and Hovens CM (2016). Comparing nodal versus bony metastatic spread using tumour phylogenies. Scientific Reports 6, 33918. [DOI] [PMC free article] [PubMed] [Google Scholar]
- Mariathasan S, Turley SJ, Nickles D, Castiglioni A, Yuen K, Wang Y, Kadel lii EE, Koeppen H, Astarita JL, Cubas R, et al. (2018). TGFβ attenuates tumour response to PD-L1 blockade by contributing to exclusion of T cells. Nature 554, 544. [DOI] [PMC free article] [PubMed] [Google Scholar]
- Massagué J (2008). TGFβ in Cancer. Cell 134, 215–230. [DOI] [PMC free article] [PubMed] [Google Scholar]
- McGranahan N, Rosenthal R, Hiley CT, Rowan AJ, Watkins TBK, Wilson GA, Birkbak NJ, Veeriah S, Van Loo P, Herrero J, et al. (2017). Allele-Specific HLA Loss and Immune Escape in Lung Cancer Evolution. Cell 171, 1259–1271. e1211. [DOI] [PMC free article] [PubMed] [Google Scholar]
- McLaren W, Gil L, Hunt SE, Riat HS, Ritchie GRS, Thormann A, Flicek P, and Cunningham F (2016). The Ensembl Variant Effect Predictor. Genome Biology 17, 122. [DOI] [PMC free article] [PubMed] [Google Scholar]
- Minn AJ, Gupta GP, Siegel PM, Bos PD, Shu W, Giri DD, Viale A, Olshen AB, Gerald WL, and Massague J (2005). Genes that mediate breast cancer metastasis to lung. Nature 436, 518–524. [DOI] [PMC free article] [PubMed] [Google Scholar]
- Minn Andy J., and Wherry EJ Combination Cancer Therapies with Immune Checkpoint Blockade: Convergence on Interferon Signaling. Cell 165, 272–275. [DOI] [PubMed] [Google Scholar]
- Mootha VK, Lindgren CM, Eriksson K-F, Subramanian A, Sihag S, Lehar J, Puigserver P, Carlsson E, Ridderstråle M, Laurila E, et al. (2003). PGC-1α-responsive genes involved in oxidative phosphorylation are coordinately downregulated in human diabetes. Nature Genetics 34, 267. [DOI] [PubMed] [Google Scholar]
- Navin N, Kendall J, Troge J, Andrews P, Rodgers L, McIndoo J, Cook K, Stepansky A, Levy D, Esposito D, et al. (2011). Tumour evolution inferred by single-cell sequencing. Nature 472, 90–94. [DOI] [PMC free article] [PubMed] [Google Scholar]
- Naxerova K, Reiter JG, Brachtel E, Lennerz JK, van de Wetering M, Rowan A, Cai T, Clevers H, Swanton C, Nowak MA, et al. (2017). Origins of lymphatic and distant metastases in human colorectal cancer. Science 357, 55–60. [DOI] [PMC free article] [PubMed] [Google Scholar]
- Neumann J, Bahr F, Horst D, Kriegl L, Engel J, Luque RM, Gerhard M, Kirchner T, and Jung A (2011). SOX2 expression correlates with lymph-node metastases and distant spread in right-sided colon cancer. BMC Cancer 11, 518. [DOI] [PMC free article] [PubMed] [Google Scholar]
- Nguyen DX, Chiang AC, Zhang XHF, Kim JY, Kris MG, Ladanyi M, Gerald WL, and Massagué J (2009). WNT/TCF Signaling through LEF1 and HOXB9 Mediates Lung Adenocarcinoma Metastasis. Cell 138, 51–62. [DOI] [PMC free article] [PubMed] [Google Scholar]
- Núñez NG, Tosello Boari J, Ramos RN, Richer W, Cagnard N, Anderfuhren CD, Niborski LL, Bigot J, Meseure D, De La Rochere P, et al. (2020). Tumor invasion in draining lymph nodes is associated with Treg accumulation in breast cancer patients. Nature Communications 11, 3272. [DOI] [PMC free article] [PubMed] [Google Scholar]
- Oppenheim DE, Roberts SJ, Clarke SL, Filler R, Lewis JM, Tigelaar RE, Girardi M, and Hayday AC (2005). Sustained localized expression of ligand for the activating NKG2D receptor impairs natural cytotoxicity in vivo and reduces tumor immunosurveillance. Nature Immunology 6, 928. [DOI] [PubMed] [Google Scholar]
- Pardoll D (2003). Does the immune system see tumors as foreign or self? Annu Rev Immunol 21, 807–839. [DOI] [PubMed] [Google Scholar]
- Pardoll DM (2012). The blockade of immune checkpoints in cancer immunotherapy. Nat Rev Cancer 12, 252–264. [DOI] [PMC free article] [PubMed] [Google Scholar]
- Patro R, Duggal G, Love MI, Irizarry RA, and Kingsford C (2017). Salmon provides fast and bias-aware quantification of transcript expression. Nat Meth 14, 417–419. [DOI] [PMC free article] [PubMed] [Google Scholar]
- Pereira C, Gimenez-Xavier P, Pros E, Pajares MJ, Moro M, Gomez A, Navarro A, Condom E, Moran S, Gomez-Lopez G, et al. (2017). Genomic Profiling of Patient-Derived Xenografts for Lung Cancer Identifies B2M Inactivation Impairing Immunorecognition. Clinical cancer research : an official journal of the American Association for Cancer Research 23, 3203–3213. [DOI] [PubMed] [Google Scholar]
- Pereira ER, Jones D, Jung K, and Padera TP (2015). The lymph node microenvironment and its role in the progression of metastatic cancer. Seminars in Cell & Developmental Biology 38, 98–105. [DOI] [PMC free article] [PubMed] [Google Scholar]
- Pereira ER, Kedrin D, Seano G, Gautier O, Meijer EFJ, Jones D, Chin S-M, Kitahara S, Bouta EM, Chang J, et al. (2018). Lymph node metastases can invade local blood vessels, exit the node, and colonize distant organs in mice. Science 359, 1403–1407. [DOI] [PMC free article] [PubMed] [Google Scholar]
- Plitas G, and Rudensky AY (2020). Regulatory T Cells in Cancer. Annual Review of Cancer Biology 4, 459–477. [Google Scholar]
- Pucci F, Garris C, Lai CP, Newton A, Pfirschke C, Engblom C, Alvarez D, Sprachman M, Evavold C, Magnuson A, et al. (2016). SCS macrophages suppress melanoma by restricting tumor-derived vesicle-B cell interactions. Science 352, 242–246. [DOI] [PMC free article] [PubMed] [Google Scholar]
- Ran FA, Hsu PD, Wright J, Agarwala V, Scott DA, and Zhang F (2013). Genome engineering using the CRISPR-Cas9 system. Nature protocols 8, 2281–2308. [DOI] [PMC free article] [PubMed] [Google Scholar]
- Raulet DH (2003). Roles of the NKG2D immunoreceptor and its ligands. Nature Reviews Immunology 3, 781. [DOI] [PubMed] [Google Scholar]
- Reiter JG, Makohon-Moore AP, Gerold JM, Heyde A, Attiyeh MA, Kohutek ZA, Tokheim CJ, Brown A, DeBlasio RM, Niyazov J, et al. (2018). Minimal functional driver gene heterogeneity among untreated metastases. Science 361, 1033–1037. [DOI] [PMC free article] [PubMed] [Google Scholar]
- Roberts EW, Broz ML, Binnewies M, Headley MB, Nelson AE, Wolf DM, Kaisho T, Bogunovic D, Bhardwaj N, and Krummel MF (2016). Critical Role for CD103(+)/CD141(+) Dendritic Cells Bearing CCR7 for Tumor Antigen Trafficking and Priming of T Cell Immunity in Melanoma. Cancer cell 30, 324–336. [DOI] [PMC free article] [PubMed] [Google Scholar]
- Rusinova I, Forster S, Yu S, Kannan A, Masse M, Cumming H, Chapman R, and Hertzog PJ (2013). Interferome v2.0: an updated database of annotated interferon-regulated genes. Nucleic Acids Res 41, D1040–1046. [DOI] [PMC free article] [PubMed] [Google Scholar]
- Russo MV, Esposito S, Tupone MG, Manzoli L, Airoldi I, Pompa P, Cindolo L, Schips L, Sorrentino C, and Carlo ED (2015). SOX2 boosts major tumor progression genes in prostate cancer and is a functional biomarker of lymph node metastasis. Oncotarget 7. [DOI] [PMC free article] [PubMed] [Google Scholar]
- Sade-Feldman M, Jiao YJ, Chen JH, Rooney MS, Barzily-Rokni M, Eliane J-P, Bjorgaard SL, Hammond MR, Vitzthum H, Blackmon SM, et al. (2017). Resistance to checkpoint blockade therapy through inactivation of antigen presentation. Nature Communications 8, 1136. [DOI] [PMC free article] [PubMed] [Google Scholar]
- Salmon H, Idoyaga J, Rahman A, Leboeuf M, Remark R, Jordan S, Casanova-Acebes M, Khudoynazarova M, Agudo J, Tung N, et al. (2016). Expansion and Activation of CD103+ Dendritic Cell Progenitors at the Tumor Site Enhances Tumor Responses to Therapeutic PD-L1 and BRAF Inhibition. Immunity 44, 924–938. [DOI] [PMC free article] [PubMed] [Google Scholar]
- Sanjana NE, Shalem O, and Zhang F (2014). Improved vectors and genome-wide libraries for CRISPR screening. Nature methods 11, 783–784. [DOI] [PMC free article] [PubMed] [Google Scholar]
- Schep AN, Wu B, Buenrostro JD, and Greenleaf WJ (2017). chromVAR: inferring transcription-factor-associated accessibility from single-cell epigenomic data. Nature methods 14, 975–978. [DOI] [PMC free article] [PubMed] [Google Scholar]
- Schreiber RD, Old LJ, and Smyth MJ (2011). Cancer Immunoediting: Integrating Immunity’s Roles in Cancer Suppression and Promotion. Science 331, 1565–1570. [DOI] [PubMed] [Google Scholar]
- Shaner NC, Campbell RE, Steinbach PA, Giepmans BN, Palmer AE, and Tsien RY (2004). Improved monomeric red, orange and yellow fluorescent proteins derived from Discosoma sp. red fluorescent protein. Nat Biotechnol 22, 1567–1572. [DOI] [PubMed] [Google Scholar]
- Shaw AE, Hughes J, Gu O, Behdenna A, Singer JB, Dennis T, Orton RJ, Varela M, Gifford RJ, Wilson SJ, et al. (2017). Fundamental properties of the mammalian innate immune system revealed by multispecies comparison of type I interferon responses. PLoS biology 15, e2004086. [DOI] [PMC free article] [PubMed] [Google Scholar]
- Sidwell T, Liao Y, Garnham AL, Vasanthakumar A, Gloury R, Blume J, Teh PP, Chisanga D, Thelemann C, de Labastida Rivera F, et al. (2020). Attenuation of TCR-induced transcription by Bach2 controls regulatory T cell differentiation and homeostasis. Nature Communications 11, 252. [DOI] [PMC free article] [PubMed] [Google Scholar]
- Spitzer MH, Carmi Y, Reticker-Flynn NE, Kwek SS, Madhireddy D, Martins MM, Gherardini PF, Prestwood TR, Chabon J, Bendall SC, et al. (2017). Systemic Immunity Is Required for Effective Cancer Immunotherapy. Cell 168, 487–502.e415. [DOI] [PMC free article] [PubMed] [Google Scholar]
- Spranger S, Spaapen RM, Zha Y, Williams J, Meng Y, Ha TT, and Gajewski TF (2013). Up-Regulation of PD-L1, IDO, and T<sub>regs</sub> in the Melanoma Tumor Microenvironment Is Driven by CD8<sup>+</sup> T Cells. Science Translational Medicine 5, 200ra116–200ra116. [DOI] [PMC free article] [PubMed] [Google Scholar]
- Stewart SA, Dykxhoorn DM, Palliser D, Mizuno H, Yu EY, An DS, Sabatini DM, Chen IS, Hahn WC, Sharp PA, et al. (2003). Lentivirus-delivered stable gene silencing by RNAi in primary cells. RNA (New York, NY) 9, 493–501. [DOI] [PMC free article] [PubMed] [Google Scholar]
- Subramanian A, Tamayo P, Mootha VK, Mukherjee S, Ebert BL, Gillette MA, Paulovich A, Pomeroy SL, Golub TR, Lander ES, et al. (2005). Gene set enrichment analysis: A knowledge-based approach for interpreting genome-wide expression profiles. Proceedings of the National Academy of Sciences 102, 15545–15550. [DOI] [PMC free article] [PubMed] [Google Scholar]
- Takahashi K, and Yamanaka S (2006). Induction of pluripotent stem cells from mouse embryonic and adult fibroblast cultures by defined factors. Cell 126, 663–676. [DOI] [PubMed] [Google Scholar]
- Taube JM, Anders RA, Young GD, Xu H, Sharma R, McMiller TL, Chen S, Klein AP, Pardoll DM, Topalian SL, et al. (2012). Colocalization of Inflammatory Response with B7-H1 Expression in Human Melanocytic Lesions Supports an Adaptive Resistance Mechanism of Immune Escape. Science Translational Medicine 4, 127ra137–127ra137. [DOI] [PMC free article] [PubMed] [Google Scholar]
- Tauriello DVF, Palomo-Ponce S, Stork D, Berenguer-Llergo A, Badia-Ramentol J, Iglesias M, Sevillano M, Ibiza S, Cañellas A, Hernando-Momblona X, et al. (2018). TGFβ drives immune evasion in genetically reconstituted colon cancer metastasis. Nature 554, 538. [DOI] [PubMed] [Google Scholar]
- Tseng WW, Winer D, Kenkel JA, Choi O, Shain AH, Pollack JR, French R, Lowy AM, and Engleman EG (2010). Development of an orthotopic model of invasive pancreatic cancer in an immunocompetent murine host. Clinical cancer research : an official journal of the American Association for Cancer Research 16, 3684–3695. [DOI] [PMC free article] [PubMed] [Google Scholar]
- van der Walt S, Schönberger JL, Nunez-lglesias J, Boulogne F, Warner JD, Yager N, Gouillart E, and Yu T (2014). scikit-image: image processing in Python. PeerJ 2, e453. [DOI] [PMC free article] [PubMed] [Google Scholar]
- von Andrian UH, and Mempel TR (2003). Homing and cellular traffic in lymph nodes. Nature Reviews Immunology 3, 867. [DOI] [PubMed] [Google Scholar]
- Wherry EJ, and Kurachi M (2015). Molecular and cellular insights into T cell exhaustion. Nature Reviews Immunology 15, 486–499. [DOI] [PMC free article] [PubMed] [Google Scholar]
- Wickham H (2016). ggplot2: Elegant Graphics for Data Analysis (Springer-Verlag New York; ). [Google Scholar]
- Wright MW, Eyre TA, Lush MJ, Povey S, and Bruford EA (2005). HCOP: the HGNC comparison of orthology predictions search tool. Mammalian genome : official journal of the International Mammalian Genome Society 16, 827–828. [DOI] [PubMed] [Google Scholar]
- Wu J, and Lanier LL (2003). Natural Killer Cells and Cancer. In Advances in Cancer Research (Academic Press; ), pp. 127–156. [DOI] [PubMed] [Google Scholar]
- Wu TD, Madireddi S, de Almeida PE, Banchereau R, Chen Y-JJ, Chitre AS, Chiang EY, Iftikhar H, O’Gorman WE, Au-Yeung A, et al. (2020). Peripheral T cell expansion predicts tumour infiltration and clinical response. Nature 579, 274–278. [DOI] [PubMed] [Google Scholar]
- Yang J, Sanderson NS, Wawrowsky K, Puntel M, Castro MG, and Lowenstein PR (2010). Kupfer-type immunological synapse characteristics do not predict anti-brain tumor cytolytic T-cell function in vivo. Proc Natl Acad Sci U S A 107, 4716–4721. [DOI] [PMC free article] [PubMed] [Google Scholar]
- Yost KE, Satpathy AT, Wells DK, Qi Y, Wang C, Kageyama R, McNamara KL, Granja JM, Sarin KY, Brown RA, et al. (2019). Clonal replacement of tumor-specific T cells following PD-1 blockade. Nature Medicine 25, 1251–1259. [DOI] [PMC free article] [PubMed] [Google Scholar]
- Zanin N, Viaris de Lesegno C, Lamaze C, and Blouin CM (2021). Interferon Receptor Trafficking and Signaling: Journey to the Cross Roads. Frontiers in Immunology 11. [DOI] [PMC free article] [PubMed] [Google Scholar]
- Zhang Y, Liu T, Meyer CA, Eeckhoute J, Johnson DS, Bernstein BE, Nusbaum C, Myers RM, Brown M, Li W, et al. (2008). Model-based analysis of ChIP-Seq (MACS). Genome Biol 9, R137. [DOI] [PMC free article] [PubMed] [Google Scholar]
- Zhao S, Guo Y, Sheng Q, and Shyr Y (2014). Advanced Heat Map and Clustering Analysis Using Heatmap3. BioMed Research International 2014, 6. [DOI] [PMC free article] [PubMed] [Google Scholar]
Associated Data
This section collects any data citations, data availability statements, or supplementary materials included in this article.
Supplementary Materials
Figure S1 | LN lines exhibit an enhanced LN-metastatic phenotype, related to Figure 1. (A) Percentage of mice that gave rise to tumor lines from the draining LN (left inguinal) that also yielded cell lines derived from non-draining LNs for each generation of cell lines. In vitro (B) and in vivo subcutaneous (C) growth of the parental and LN6-987AL lines. (D) Mice were implanted with B16-F0-mWasabi and LN6-987AL-tdTomato cells at an equal ratio and metastases were quantified after one month of growth. For individual mice, the percentage of tumor cells in the LNs that were of LN6 origin (x-axis) is compared to the number of tumors in the lungs of LN6 origin (y-axis). R2 and P values reflect Pearson Correlation. Error bars in (B) are range of two replicate wells. Error bars in (C) are s.e.m. of n = 8 mice per condition. *P < 0.05, ****p < 0.0001.
Figure S2 | RNA-seq and WES of LN metastatic lines reveal conserved upregulation of interferon stimulated genes without acquisition of additional driver mutations, related to Figure 2. (A) Phylogenetic tree relationships between the various LN lines. Highlighted nodes were subjected to RNA sequencing. IL, left inguinal; IR, right inguinal; AL, left axillary; BL, left brachial; AR, right axillary; BR, right brachial. (B) PCA generated from the top highly variable genes (HVGs) across all samples, agnostic to generation. Colors denote LN line generation. (C) PCA generated from the top differentially expressed genes (DEGs) between the early- and late-generation LN lines. (D) Normalized regularized log-transformed gene expression comparing LN8 lines to the parental line (B16-F0). Light blue genes have |log2(fold change)| > 1 and Padj < 0.01; dark blue genes are those that also are present in the Interferome database (Rusinova et al., 2013). (E) Mutational status of known melanoma driver genes across the cell lines. (F) GSEA results for additional enriched gene sets from the Hallmarks, Motifs, and Symbols gene set databases. (G) Transcript expression levels of the sequenced LN lines across the generations, colored by stage for various ISGs. TPM, transcript per kilobase million. (H) PCA plot of ATAC-seq profiles for parental, LN3, and LN7 lines. (I) Intersection plot depicting the number of shared and unique ATAC peaks between the three classes of lines.
Figure S3 | LN metastases maintain IFN signaling in the absence of exogenous ISGs, related to Figure 3. (A) Median fluorescence intensity values for parental or LN6 tumor cells following excision from tumor-bearing mice. The cells were stained for PD-L1, H-2Db, and H-2Kb and evaluated by flow cytometry. (B) Analysis of H-2Db levels on the parental (black) and LN6-987AL (red) tumor lines after 23 and 20 passages in vitro, respectively. (C) Transcript levels for the IFN and IFNR genes across the LN generations. (D) Surface levels of MHC-I and PD-L1 molecules in the control and Ifnb knockout versions of the LN6-987AL cell line. (E) Transcript levels of the various Stat genes across LN generations. (F) phospho-Stat levels in parental, LN3, LN6, and LN7 lines unstimulated or immediately following stimulation with IFN-α or IFN-γ, quantified by flow cytometry. (G) MHC-I and PD-L1 basal surface levels for the control, IFNR knockout, and Stat1 knockout versions of the parental and LN6 lines. (H) Schematic depicting proposed model of acquisition of the IFN signature. Transient interactions between Ifnar1 and Ifnar2 (and perhaps components of the Ifngr) maintain Stat phosphorylation, but ISG expression is minimal as the ISRE and GAS TF binding sites are inaccessible. Following exposure to anti-tumor immune responses, perhaps mediated by T cells within the LNs, IFN signaling commences driving high levels of ISG expression. In the chronic setting, this signaling leads to epigenetic rewiring leaving GAS and ISRE sites accessible such that even in the absence of exogenous IFN, basal phospho-Stat dimers and the ISGF3 complex are capable of driving transcription of ISGs.
Figure S4 | MHC-I levels increase with increased LN metastatic capacity without loss of NKG2D ligand expression, related to Figure 4. (A) Transcript levels of the sequenced LN lines across the generations, colored by phylogenetic lineage for MHC-Ia and -Ib genes and (B) NKG2D ligand genes. TPM, transcript per kilobase million. (C) Binding of recombinant mouse NKG2D-Fc chimera to the various cell lines, quantified by flow cytometry. (D) MHC-I molecule expression by flow cytometry following knockout of B2m with two distinct sgRNAs (or control). (E) Tumor area within the inguinal (IL) LN following intra-LN implantation of the LN6-987AL line following knockout of B2m. (F) Model of MHC-I surface levels during LN metastatic progression. MHC-I surface levels in the primary tumor are limited by H2 expression (blue) despite higher levels of B2m protein. In response to NK pressures, tumors rapidly upregulate expression of H2 genes such that surface levels rapidly increase and are limited by B2m abundance. In response to chronic IFN signaling, ISGs, including B2m are gradually upregulated, resulting in additional modest increases in surface MHC-I levels. (G) Surface levels of PD-L1 and MHC-I in the parental B16-F0 (black), three LN6 lines (red), and the lung-metastatic line B16-F10 (blue). (H) Evaluation of PD-L1 expression by flow cytometry after knockout of Cd274 with two distinct sgRNAs or control. Padj in (A) calculated by DESeq2 comparing late-generation to early generation lines.
Figure S5 | LN metastases alter the immune repertoire of the involved LNs, related to Figure 5. (A) UMAP visualization of scRNA-seq populations colored by expression of various cell type distinguishing markers. (B, C) Violin plots depicting expression of various naïve and activation genes in the CD4 T cell clusters (B) and CD8 T cell clusters (C). (D) Violin plots depicting expression of various genes associated with suppressive neutrophil phenotypes across neutrophils from no tumor, parental tumor-bearing, and LN6 tumor-bearing mice. (E) Quantification of various myeloid populations and PD-L1 levels in the LNs by flow cytometry in mice with no tumors (naïve), primary tumors only (LN−), or primary tumors and LN metastases (LN+). (F) Braf melanoma GEMMs were induced with 4-HT, and following LN metastasis, immune populations were quantified by flow cytometry. P-values in (E) calculated by One-Way ANOVA with Dunnett’s post hoc test and (F) calculated by Two-Tailed Mann-Whitney U Test. *P < 0.05, **P < 0.01, ***p < 0.001, ****P < 0.0001.
Figure S6 | LN lines do not evade CD8 T cell immunity through classical immunoediting but instead induce Tregs, related to Figures 6 and 7. Subcutaneous growth of the LN6-987AL (A) and B16-F0 (B) tumors in wild-type and Rag2−/−;Il2rg−/− mice. (C) Representative H&E stains and quantification of tumor burden in lungs from the genetically engineered breast cancer MMTV-PyMT mice and MMTV-PyMT mice crossed with Rag2−/− miss at 25 weeks of age. (D) Ovalbumin-expressing parental and LN8 lines were co-cultured with CD8 T cells isolated from transgenic TCR OT-I mice. Activation and proliferation of the T cells were evaluated by flow cytometry by staining for CD69, Granzyme B, and Ki67. (E) Ovalbumin-expressing parental and LN8 tumor cells were labeled with CFSE and Cell Trace Violet, respectively, and mixed at a 1:1 ratio. OT-I CD8 T cells were added to the cultures at various effector to target (E:T) ratios, and viability of the tumor cells was evaluated by flow cytometry after 24 hours of culture. Representative flow plots are shown of tumor cells gated on the dead cell fraction. (F) Ovalbumin expressing lines were implanted into wild-type or OT-I mice. Growth curves of the tumors in wild-type mice are shown with solid lines and in OT-I mice are shown with dotted lines (black: parental; red: LN8). While 4 of 4 LN8 lines grew out in the OT-I mice, only 1 of 3 of the parental lines grew. Both lines exhibit delayed growth kinetics in OT-I mice. (G) MuPeXI analysis of neoantigens. WES was used to identify the top candidate neoantigens resulting from somatic mutations in the lines (ranked by MuPeXI Priority Score). Left: Predicted binding affinities of the top candidate peptides, calculated by NetMHC for binding to H-2Db or H-2Kb comparing the wild-type alleles to the mutant alleles. Middle: Allele frequency of the mutant genes producing the neoantigens. Right MuPeXI Expression Score (ES = tanh(TPM)). (H) Transcript expression levels of common melanoma antigens Pmel, Tyrp1, Mlana, and Dct. (I) Quantification of Tregs and their ratios to CD8 T cells from the draining LNs of mice bearing parental or LN6-987AL tumors. (J) Analysis of Treg population following in vitro co-culture of naïve CD4 T cells with tumor cell lines gated on CD4 T cells. (K) Luminex cytokine profiling of cell culture supernatants harvested from parental or LN4 and LN5 lines. (L) Luminex cytokine profiling of the serum of mice bearing subcutaneous parental or LN6-987AL tumors. (M) Transcript expression levels of Tgfb isoforms. (N) Primary tumor growth of mice bearing parental or LN6 tumors, treated with anti-TGF-β neutralizing antibodies or isotype controls. (O) Primary tumor growth in Foxp3DTR mice bearing parental or LN6 tumors treated with either PBS or diphtheria toxin (DT) to deplete Tregs. Error bars in (K) are range of two technical replicates. Scale bars, 2mm. P-values in (C) calculated by Mann-Whitney U Test, (D) One-Way ANOVA with Tukey’s post hoc test, (I, L) calculated by Unpaired Two-Tailed t-Test, (J) calculated by One-Way ANOVA with Dunnett’s post hoc test, (N) calculated by Two-Way ANOVA with Tukey’s post hoc test. *P < 0.05, **P < 0.01, ***P < 0.001, ****P < 0.0001, ****P < 0.0001, Fisher’s Exact Test.
Figure S7 | Metastatic Tolerance: a new model of cancer metastasis, related to Figure 7. Existing models of metastasis include the “Halstedian” model where tumors spread through lymphatics to LNs and subsequently to distant tissues and the “Systemic” model where tumors spread in parallel to LNs and distant tissues, and LN metastases bear no influence on distant metastases. Our proposed “Metastatic Tolerance” model posits that tumors spread first to LNs where they induce tumor-specific immune tolerance that subsequently spreads throughout the host (green arrows) to enable dissemination of primary tumors or LN metastases to distant tissues.
Data Availability Statement
Murine bulk RNA-seq, single-cell RNA-seq, and ATAC-seq data and de-identified human HNSCC RNA-seq data have been deposited at GEO and are publicly available as of the date of publication. Murine WES data have been deposited at SRA and are publicly available as of the date of publication. Accession numbers are listed in the Key Resources table.
This paper does not report original code.
Any additional information required to reanalyze the data reported in this paper is available from the lead contact upon request.
| REAGENT or RESOURCE | SOURCE | IDENTIFIER |
|---|---|---|
| Antibodies | ||
| Rat Anti-CD16/CD32 Monoclonal Antibody, Unconjugated, (Clone 2.4G2) | BD Biosciences | Cat# 553141; RRID:AB_394656 |
| Brilliant Violet 421 anti-mouse CD45 | BioLegend | Cat# 103134; RRID:AB_2562559 |
| BUV395 Rat Anti-Mouse CD45 (Clone 30-F11) | BD Biosciences | Cat# 564279; RRID:AB_2651134 |
| FITC anti-mouse CD3 | BioLegend | Cat# 100204; RRID:AB_312661 |
| Brilliant Violet 510 anti-mouse CD3 | BioLegend | Cat# 100234; RRID:AB_2562555 |
| Brilliant Violet 605 anti-mouse CD3 | BioLegend | Cat# 100237; RRID:AB_2562039 |
| Brilliant Violet 650 anti-mouse CD4 | BioLegend | Cat# 100555; RRID:AB_2562529 |
| Brilliant Violet 711 anti-mouse CD4 | BioLegend | Cat# 100549; RRID:AB_11219396 |
| Brilliant Violet 421 anti-mouse CD4 | BioLegend | Cat# 100544; RRID:AB_11219790 |
| Brilliant Violet 785 anti-mouse CD8a | BioLegend | Cat# 100750; RRID:AB_2562610 |
| Brilliant Violet 510 anti-mouse CD8a | BioLegend | Cat# 100752; RRID:AB_2563057 |
| Alexa Fluor 488 anti-mouse CD8a | BioLegend | Cat# 100723; RRID:AB_389304 |
| PE anti-FoxP3 | Thermo Fisher | Cat #14-4771-80; RRID: AB_529583 |
| PE anti-FoxP3 | BD Biosciences | Cat# 560408; RRID: AB_1645251 |
| APC/Cyanine7 anti-mouse CD25 | BioLegend | Cat# 102026; RRID:AB_830745 |
| APC anti-mouse CD25 | BioLegend | Cat# 102012; RRID:AB_312861 |
| FITC anti-PD-1 | BioLegend | Cat# 135214; RRID: AB_10680238 |
| Brilliant Violet 421 anti-PD-1 | BioLegend | Cat# 109121; RRID:AB_2687080 |
| Brilliant Violet 650 anti-mouse/human CD44 | BioLegend | Cat# 103049; RRID:AB_2562600 |
| Brilliant Violet 421 anti-mouse CD62L | BioLegend | Cat# 104435; RRID:AB_10900082 |
| FITC anti-mouse Ki-67 | BioLegend | Cat# 652409; RRID:AB_2562140 |
| Brilliant Violet 711 anti-mouse/human CD45R/B220 | BioLegend | Cat# 103255; RRID:AB_2563491 |
| APC anti-mouse CD69 | BioLegend | Cat# 104513; RRID:AB_492844 |
| Alexa Fluor 488 anti-mouse CD69 | BioLegend | Cat# 104516; RRID:AB_492845 |
| Pacific Blue anti-human/mouse Granzyme B | BioLegend | Cat# 515407; RRID:AB_2562195 |
| APC anti-mouse IFN-gamma | BioLegend | Cat# 505810; RRID:AB_315404 |
| PE anti-mouse CD11c | BioLegend | Cat# 117307; RRID:AB_313776 |
| APC/Cyanine7 anti-mouse/human CD11b | BioLegend | Cat# 101225; RRID:AB_830641 |
| Brilliant Violet 605 anti-mouse CD103 | BioLegend | Cat# 121433; RRID:AB_2629724 |
| Brilliant Violet 785 anti-mouse/rat Xcr1 | BioLegend | Cat# 148225; RRID:AB_2783119 |
| FITC anti-mouse I-A/I-E | BioLegend | Cat# 107605; RRID:AB_313320 |
| Alexa Fluor 700 anti-mouse Ly-6G | BioLegend | Cat# 127622; RRID:AB_10643269 |
| PerCP/Cyanine5.5 anti-mouse F4/80 | BioLegend | Cat# 123127; RRID:AB_893496 |
| PE/Cyanine7 anti-mouse CD274 (B7-H1, PD-L1) | BioLegend | Cat# 124313; RRID:AB_10639934 |
| APC anti-mouse CD274 (B7-H1, PD-L1) | BioLegend | Cat# 124311; RRID:AB_10612935 |
| Alexa Fluor 647 anti-mouse CD172a (SIRPalpha) | BioLegend | Cat# 144028; RRID:AB_2721301 |
| PerCP/Cyanine5.5 anti-mouse CD45.1 | BioLegend | Cat# 110727; RRID:AB_893348 |
| PE anti-mouse CD45.2 | BioLegend | Cat# 109807; RRID:AB_313444 |
| Brilliant Violet 421 Statl (pY701) | BD Biosciences | Cat# 562985; RRID:AB_2737932 |
| Alexa Fluor 647 anti-Stat3, phospho (Tyr705) (Clone 4) | BD Biosciences | Cat# 557815; RRID:AB_647144 |
| Alexa Fluor 647 Stat4 (pY693) | BD Biosciences | Cat# 558137; RRID:AB_397052 |
| Alexa Fluor 488 Stat5 (pY694) | BD Biosciences | Cat# 612598; RRID:AB_399881 |
| PE anti-mouse H-2Kb | BioLegend | Cat# 116507; RRID:AB_313734 |
| APC anti-mouse H-2Db | Thermo Fisher | Cat# 17-5999-82; RRID:AB_2573252 |
| Alexa Fluor 647 anti-human IgG Fc | BioLegend | Cat# 410713; RRID:AB_2728443 |
| Alexa Fluor 647 Rat IgG2a isotype control | BioLegend | Cat# 400526; RRID:AB_2864284 |
| InVivoMAb mouse IgG1 isotype control | Bio X Cell | Cat# BE0083; RRID:AB_1107784 |
| InVivoMAb anti-TGF-β | Bio X Cell | Cat# BE0057; RRID:AB_1107757 |
| InVivoPlus anti-mouse CD4 | Bio X Cell | Cat# BE0003-1; RRID:AB_1107636 |
| InVivoPlus anti-mouse CD8a | Bio X Cell | Cat# BP0117; RRID:AB_10950145 |
| rat IgG2b Isotype control | Bio X Cell | Cat# BE0090; RRID:AB_1107780 |
| InVivoPlus anti-mouse NK1.1 | Bio X Cell | Cat# BE0036; RRID:AB_1107737 |
| InVivoPlus mouse IgG2a isotype control | Bio X Cell | Cat# BE0085; RRID:AB_1107771 |
| Anti-PD-L1 (E1L3N) | CellSignaling | Cat # 13684; RRID: AB_2687655 |
| Biological samples | ||
| Human Malignant Melanoma Tissue Microarray | US Biomax | Cat # ME2082c |
| Human HNSCC Tissue Microarray | Stanford Healthcare | This paper |
| Chemicals, peptides, and recombinant proteins | ||
| StemPro Accutase | Thermo Fisher | Cat # A1110501 |
| Lipofectamine 2000 | Thermo Fisher | Cat # 11668019 |
| Hygromycin B | Thermo Fisher | Cat # 10687010 |
| Polybrene | Sigma | Cat # TR-1003-G |
| NP40 | Sigma | Cat # 11332473001 |
| Digitonin | Promega | Cat # G9441 |
| Tagment DNA Enzyme | Illumina | Cat # 20034197 |
| Collagenase 4 | Worthington | Cat # LS004189 |
| LIVE/DEAD Fixable Blue Dead Cell Stain | Thermo Fisher | Cat # L34962 |
| LIVE/DEAD Fixable Near-IR Dead Cell Stain Kit | Thermo Fisher | Cat # L10119 |
| eBioscience FoxP3 Fixation/Permeabilization | Thermo Fisher | Cat # 00-5521-00 |
| DAPI | Thermo Fisher | Cat # D3571 |
| NKG2D-Fc Chimera | R&D Systems | Cat # 139-NK-050 |
| BV421 MHC-ll-Ova tetramer | NIH Tetramer Facility | I-A(b) AAHAEINEA |
| BV421 MHC-II Cntrl tetramer | NIH Tetramer Facility | I-A(b) PVSKMRMATPLLMQA |
| Recombinant mouse IFN-α | PBL Assay Science | Cat# 12100-1 |
| Recombinant mouse IFN-γ | Biolegend | Cat # 575306 |
| Fixation Buffer | BD Biosciences | Cat # 554655 |
| Phosflow Perm Buffer III | BD Biosciences | Cat # 558050 |
| Brilliant Stain Buffer Plus | BD Biosciences | Cat # 566385 |
| Recombinant Human TGF-β | Peprotech | Cat# 100-21 |
| Diptheria Toxin | Sigma | Cat # D0564 |
| CellTrace CFSE | Thermo Fisher | Cat # C34554 |
| CellTrace Violet | Thermo Fisher | Cat # C34571 |
| Calcein-AM | Thermo Fisher | Cat # C3100MP |
| Tissue-Tek Optimal Cutting Temperature Compound | VWR | Cat # 25608-930 |
| Dako Dual Endogenous Enzyme Block | Agilent | Cat # S2003 |
| Dako Protein Block | Agilent | Cat # X0909 |
| Critical commercial assays | ||
| DNA Clean and Concentrator-5 Kit | Zymo | Cat # D4013 |
| NEBNext 2X Master Mix | New England Biolabs | Cat # M0541S |
| Lib Quant Kit | Kapa Biosystems | Cat # KK5621 |
| SPHERO AccuCount Fluorescent Particles | Spherotech | Cat # ACFP-50-5 |
| MojoSort Mouse Naïve CD4+ T Cell Isolation Kit | BioLegend | Cat # 480040 |
| anti-CD3/CD28 Dynabeads | Thermo Fisher | Cat # 11456D |
| EasySep Mouse CD8+ T cell Isolation Kit | StemCell | Cat # 19853 |
| EasySep Mouse NK Cell Isolation Kit | StemCell | Cat # 19855 |
| ImmPRESS-AP Anti-Rabbit IgG (alkaline phosphatase) Polymer Detection Kit | Vector Laboratories | Cat # MP-5401 |
| ImmPACT Vector Red Alkaline Phosphatase (AP) Substrate | Vector Laboratories | Cat # SK-5105 |
| RNEasy Plus Mini | Qiagen | Cat # 74034 |
| QIAshredder | Qiagen | Cat # 79654 |
| DNEasy Blood and Tissue | Qiagen | Cat # 69504 |
| Deposited data | ||
| Human HNSCC RNA-seq | This paper | GSE113839 |
| Interferome v2 database | Rusinova et al., 2013 | www.interferome.org |
| Mouse RNA-seq, ATAC-seq, and scRNA-seq | This paper | GSE117529 |
| Mouse WES | This paper | PRJNA820881 |
| Experimental models: Cell lines | ||
| B16-F0 | ATCC | CRL-6322 |
| B16-F10 | ATCC | CRL-6475 |
| LN Lines | This paper | N/A |
| LMP | Tseng et al., 2010 (our lab) | N/A |
| MOC2 | Judd et al., 2012 (gift from John Sunwoo) | N/A |
| MC38 | Gift from Cornelis J.M. Melief | N/A |
| Experimental models: Organisms/strains | ||
| C57BL/6J | Jackson Laboratories | #000664 |
| B6129SF1/J | Jackson Laboratories | #101043 |
| B6(Cg)-Rag2tm1.1Cgn/J | Jackson Laboratories | #008449 |
| B6.129S4-Il2rgtm1Wjl/J | Jackson Laboratories | #003174 |
| B6.FVB-Tg(MMTV-PyVT)634Mul/LellJ | Jackson Laboratories | #022974 |
| NOD.Cg-PrkdcscidIl2rgtm1Wjl/SzJ | Jackson Laboratories | #005557 |
| B6.Cg-Tg(TcraTcrb)425Cbn/J | Jackson Laboratories | #004194 |
| B6.129S2-Ltatm1Dch/J | Jackson Laboratories | #002258 |
| B6.Cg-Tg(Tyr-cre/ERT2)13Bos Braftm1Mmcm Ptentm1Hwu/BosJ | Jackson Laboratories | #013590 |
| B6.Cg-Foxp3tm2Tch/J | Jackson Laboratories | #006772 |
| B6.129(Cg)-Foxp3tm3(DTR/GFP)Ayr/J | Jackson Laboratories | #016958 |
| C57BL/6-Tg(TcraTcrb)110OMjb/J | Jackson Laboratories | #003831 |
| B6;129S-Gt(ROSA)26Sortm1.1(CAG-COX8A/Dendra2)Dcc/J | Jackson Laboratories | #018397 |
| B6.SJL-Ptprca Pepcb/BoyJ | Jackson Laboratories | #002014 |
| Oligonucleotides | ||
| See Table S4 | ||
| Recombinant DNA | ||
| lentiCRISPR v2 | Sanjana et al., 2014 | Addgene plasmid #52961 |
| pSpCas9(BB)-2A-GFP (PX458) | Ran et al., 2013 | Addgene plasmid #48138 |
| mWasabi-N1 | Ai et al., 2008 | Addgene plasmid #54765 |
| tdTomato-N1 | Shaner et al., 2004 | Addgene plasmid #54642 |
| pCI-neo-cOVA | Yang et al., 2010 | Addgene plasmid #25097 |
| pLVX-IRES-Hyg | Clontech | Cat # 632185 |
| psPAX2 | Didier Trono | Addgene plasmid #12260 |
| pCMV-VSV-G | Stewart et al., 2003 | Addgene plasmid #8454 |
| Software and algorithms | ||
| Trimmomatic (v0.36) | Bolger at al., 2014 | https://github.com/usadellab/Trimmomatic |
| FastQC (v0.11.3) | Babraham Institute | https://www.bioinformatics.babraham.ac.uk/projects/fastqc/ |
| Salmon (v0.7.2) | Patro et al., 2017 | https://combine-lab.github.io/salmon/ |
| Rstudio (v1.0.143 – v1.1.463) | RStudio, Inc | https://rstudio.com/ |
| DESeq2 (v1.14.1 and v1.28.1) | Love et al., 2014 | https://bioconductor.org/packages/release/bioc/html/DESeq2.html |
| GSEA (v3.0) | Mootha et al., 2003; Subramanian et al., 2005 | https://www.gsea-msigdb.org/ |
| HGNC Comparison of Orthology Predictions | HUGO Gene Nomenclature Committee | https://www.aenenames.ora/cai-bin/hcoo |
| Gene Ontology | Ashburner wt al., 2000; Gene Ontology Consortium | http://www.geneontology.org/ |
| GraphPad Prism (v7.04 – v9.1.0) | Graphpad Software, LLC | N/A |
| FlowJo (v10.0.8) | TreeStar | N/A |
| ggplot2 (v2.2.1) | Wickham, 2016 | https://ggplot2.tidyverse.org/ |
| R stats package (v3.3.2) | R Foundation | http://www.r-project.org/ |
| FSA package (v0.8.20) | R Foundation | http://www.r-project.org/ |
| AGeNT Surecall Trimmer (v4.0.1) | Agilent | N/A |
| Burrows-Wheeler Aligner (bwa-mem) (v0.7.12) | Li et al., 2009 #1 | http://bio-bwa.sourceforge.net/ |
| SAMtools (v1.6 and v1.8) | Li et al., 2009 #2 | https://github.com/samtools/ |
| Picard (v2.17.0) | Broad Institute | https://broadinstitute.github.io/picard/ |
| MuTect2 (GATK v4.0.0.0) | Broad Institute | https://gatk.broadinstitute.org/hc/enus/articles/360037593851-Mutect2 |
| SnpEff (v4.3) | Cingolani et al., 2012 | http://pcingola.github.io/SnpEff/ |
| NetMHCpan (v4.0) | Jurtz et al., 2017 | https://services.healthtech.dtu.dk/cgi-bin/sw_request |
| MuPeXI (v1.2.0) | Bjerregaard et al., 2017 | https://github.com/ambj/MuPeXI |
| Variant Effect Predictor (v87.27) | McLaren et al., 2016 | https://github.com/Ensembl/ensembl-vep |
| Circos (v0.69.4) | Krzywinski et al., 2009 | http://circos.ca/ |
| hisat2 | Kim et al., 2019 | http://daehwankimlab.github.io/hisat2/ |
| MACS2 | Zhang et al., 2008 | https://pypi.org/project/MACS2/ |
| Integrative Genomics Viewer (v2.5.3) | Broad Institute | https://software.broadinstitute.org/software/igv/ |
| ChromVAR | Schep et al., 2017 | https://greenleaflab.github.io/chromVAR/ |
| HOMER | Heinz et al., 2010 | http://homer.ucsd.edu/homer/ |
| Cell Ranger (v3.1.0) | 10X Genomics | https://support.10xgenomics.com/single-cell-gene-expression/software/downloads/latest |
| Seurat (v4.0) | Hao et al, 2021 | https://satijalab.org/seurat/ |
| R (v4.0.2) | R Foundation | http://www.r-project.org/ |
| Scikit-image | van der Walt et al., 2014 | https://scikit-image.org/ |
| OpenCV | Bradski, et al., 2000 | https://pypi.org/project/opencv-python/ |
| BD FACS Diva (v8.0.2) | Becton Dickinson | N/A |
| Zeiss ZEN 2012 (Blue Edition) | Zeiss | N/A |
| Nikon NIS-Elements D (v4.30.02) | Nikon | N/A |
| Adobe Photoshop CS6 | Adobe System | N/A |
| Adobe Illustrator CS6 | Adobe System | N/A |
| Other | ||
| Zeis LSM 700 confocal microscope | Zeiss | N/A |
| FACSAria II | Becton Dickinson | N/A |
| SMZ1000 Stereo Dissection Microscope | Nikon | N/A |
| IVIS Spectrum Imager | Caliper Life Sciences | N/A |
| LSR II | Becton Dickinson | N/A |
| LSRFortessa X-20 | Becton Dickinson | N/A |