

Abstract
Glycan structure identification is essential to understanding the roles of glycans in various biological processes. Previously, we developed GlycoDeNovo, a de novo algorithm for reconstructing glycan topologies from tandem mass spectra (MS/MS). In this work, we introduce GlycoDeNovo2 that contains two major improvements to GlycoDeNovo. First, we use the precursor mass measured for a peak that likely corresponds to a glycan to determine its potential compositions, which are used to constrain the search space, enable parallel computation, and hence speed up topology reconstruction. Second, we developed a procedure to calculate the empirical p-value of a reconstructed topology candidate. Experimental results are provided to demonstrate the effectiveness of GlycoDeNovo2.
Keywords: de novo glycan sequencing, MS/MS, p-value
Graphical Abstract
INTRODUCTION
Glycosylation is a highly regulated process in which one or more glycans (or oligosaccharides) are added to a protein or lipid and remodeled after attachment, with both stages being under the control of specific enzymes. It plays an essential role in various biological processes,1–3 such as protein folding, immunological response, signal transduction, cell adhesion, and so on. Previous studies show that the change in glycosylation patterns is frequently associated with pathological characteristics.4,5 Proper glycosylation is essential to achieve the required solubility, stability, and efficacy of many biopharmaceuticals.6,7 Therefore, glycan structural analysis is critical for understanding the multiple biological roles of glycosylation. Tandem mass spectrometry (MS/MS) is a widely used tool for elucidating the detailed structures of glycans;8,9 these consist of monosaccharides linked by glycosidic bonds. The larger glycans can be multiply branched and thus have treelike structures. In an MS/MS experiment, a glycan may be cleaved into fragments, forming a mass/charge spectrum composed of structural components that have been designated as glycosidic (B-, C-, Y-, Z-), cross-ring (A-, X-), and internal fragments.10 Accurate deduction of the glycan topology, i.e., its primary sequence, requires cleavage of every single glycosidic bond in an MS/MS experiment. However, MS/MS spectra are typically noisy and some sequence ions (glycosidic fragments) may be missing. In addition, the number of potential topologies (i.e., the search space) is huge, even for a moderate-sized glycan. Therefore, it is challenging to reconstruct the fully defined glycan structure from an MS/MS spectrum.
Database searching approaches11–14 retrieve glycan topology candidates by matching an experimentally acquired MS/MS spectrum with those of known glycans in their databases. The performance of this type of approach highly depends on the coverage of the databases, as well as the quality of MS/MS data in the databases, which unfortunately are generally incomplete. Brute-force search methods (e.g., ref 15) compare an experimental MS/MS spectrum to those of all possible theoretical structures, but they can work only for small glycans because the number of possible structures increases exponentially with respect to the glycan size. Although biosynthetic rules can be added to speed up topology searches by brute-force methods,16,17 our knowledge of the glycan biosynthetic rules remains limited. Several approaches grow topology candidates by exploring the relationships between peaks (i.e., mass differences corresponding to known fragments).18–23 To make computation feasible, it is natural to limit the size of intermediate results by only keeping a subset of high-scoring subtopologies18,19 or applying a mass tolerance threshold.20,22 Different from other approaches that use manually designed functions to score structure candidates, machine learning-based techniques were developed to establish better scoring functions from experimental data.21,22 However, neither a score nor a ranking of a topology candidate indicates its statistical significance. In addition, the speeds of the aforementioned approaches are still not fast enough for real-time inference. Real-time execution is needed for dynamic selection of the right fragments to achieve efficient and effective MS3 analysis.
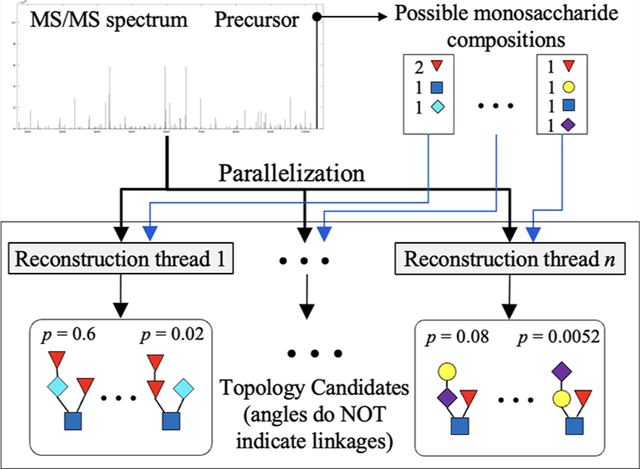
We previously developed GlycoDeNovo,22 a de novo algorithm for reconstructing glycan topologies from MS/MS data. In this work, we present GlycoDeNovo2, which offers two major improvements over GlycoDeNovo. First, GlycoDeNovo2 dramatically speeds up the candidate search process of GlycoDeNovo by limiting the monosaccharide compositions of potential candidates. In addition, the candidate search procedures with different monosaccharide composition constraints can be parallelized. Legal monosaccharide compositions can be obtained efficiently by querying the measured precursor mass against a precomputed mass-to-composition database. Second, GlycoDeNovo2 deploys a procedure to calculate the empirical p-value of each reconstructed topology. The monosaccharide composition constraint is also used by gNovo,24 another de novo glycan structure identification algorithm. For each peak in the order of their masses in a spectrum, gNovo calculates its monosaccharide composition and uses it to constraint the building of subtopologies for the peak.
METHODS
GlycoDeNovo2.
Given an experimental MS/MS spectrum, GlycoDeNovo2 (Figure 1) first preprocesses it and then uses the protonated precursor mass to retrieve all matched monosaccharide compositions and their theoretical spectra from a precomputed mass-to-composition database DBM2C. The retrieved theoretical spectra are filtered by the preprocessed experimental spectrum (i.e., the spectrum produced by removal of theoretical peaks that cannot be matched to experimental peaks within the specified mass accuracy). We modified the PeakInterpreter of GlycoDeNovo to use the retrieved compositions and their filtered theoretical spectra to speed up the topology search. Another advantage of using the filtered theoretical spectrum is that it can prevent error propagation, especially in computing the complementary peaks. In GlycoDeNovo, a complementary peak is calculated using the experimental precursor peak and a selected experimental peak. Hence, the mass measurement error in both experimental peaks can be accumulated into the computed complementary peak and further propagated in the downstream computations. This can be avoided by using the theoretical mass value of the selected precursors, as their mass measurements are accurate.
Algorithm 1:
Mass2Composition

|
Figure 1.

Pipeline of GlycoDeNovo2. After preprocessing the original experimental spectrum, GlycoDeNovo2 uses the experimental precursor m/z value to retrieve possible monosaccharide compositions and their theoretical spectra from the Mass2Composition Database (i.e., DBM2C, which is constructed by Algorithms 1 and 2). Blue peaks are the original experimental ions, and the red peaks are complementary ions that are added computationally. The theoretical spectrum for each possible composition is filtered by the experimental spectrum. This step significantly reduces the number of peaks needed to be considered in reconstructing the topologies. The topology reconstruction using a filtered spectrum is done by a composition-constrained PeakInterpreter (Algorithm 3). The reconstruction processes for individual spectra can be parallelized. The topology candidates of all filtered spectra are scored by the IonClassifier of GlycoDeNovo. Finally, GlycoDeNovo2 utilizes the Composition-to-topology database, built by Algorithms 4 and 5, to calculate the empirical p-values of the topology candidates.
The IonClassifier of GlycoDeNovo is reused to score the peaks (i.e., the possibility of a peak being a B-/C-ion) in the spectrum. A score is derived for each topology candidate by summing up the scores of its supporting B-/C-ions (peaks). Finally, GlycoDeNovo2 calculates an empirical p-value for the score of each reconstructed candidate. The p-value calculation uses a composition-to-topology database DBC2T, which can be precomputed. Below, we explain the preprocessing step, the mass-to-composition database, and the composition-to-topology database.
Throughout the rest of the paper, we use G to indicate the set of all monosaccharide classes being considered and k = |G| to indicate the size of G. Let C = [c1, c2, …, ck] be the monosaccharide composition, where ci is the number of the i-th monosaccharide class in the composition, and the monosaccharide classes are ordered from the lightest to the heaviest. We do not distinguish monosaccharides in the same class as they are not distinguishable by MS/MS. For example, glucose, galactose, and mannose are all treated as Hex. Hereafter, we use monosaccharide to indicate “monosaccharide class”.
Spectrum Preprocessing.
Precursor and fragment ions may be observed in different charge states with various metal charge carriers. The preprocessing procedure first converts the m/z values of all peaks to the mass of their corresponding singly protonated species in a given MS/MS spectrum. It is common that some glycosidic fragments might not be observed due to secondary fragmentations, or lack of charge carriers. Without those missing peaks, our topology reconstruction algorithm may fail to derive the right candidates. In theory, when a glycan is cleaved only once, two complementary ions should appear. Hence, missing peaks can be recovered from their complementary peaks. For example, B-/C-/A-ions can be recovered from Y-/Z-/X-ions, respectively, and vice versa. Since the precursor ion is known, we can calculate the complementary peak of each experimentally observed peak and add a computed peak to the spectrum if it is missing in the original spectrum. Then we iteratively merge peaks within 0.001 Da starting from the closest pair of peaks.
Mass-to-Composition Database.
The mass-to-composition database DBM2C is indexed by precursor masses and stores all possible monosaccharide compositions of glycans with precursor masses smaller than a predefined threshold Mmax (in the current setting, Mmax = 2980 Da). DBM2C also stores the theoretical MS/MS spectra corresponding to each monosaccharide composition. Two algorithms, Mass2Composition and Composition2Spectrum, were designed and implemented to create DBM2C. Mass2Composition (Algorithm 1) efficiently derives all monosaccharide compositions in a recursive way. It starts from an empty composition and calls itself recursively to expand the composition by adding one monosaccharide each time. Figure 2 shows that larger masses tend to have more monosaccharide compositions. For each monosaccharide composition and a specified derivatization method, Composition2Spectrum (Algorithm 2) calculates the theoretical spectra of a monosaccharide composition as the union of all protonated B-/C-/Y-/Z-ions produced from all possible glycans satisfying the composition constraint.
Figure 2.

Distribution of the number of monosaccharide compositions with respect to the protonated m/z of the precursor ions. Each dot indicates the number of monosaccharide compositions of one mass.
Composition-Constrained PeakInterpreter.
The PeakInterpreter algorithm of GlycoDeNovo builds an interpretation-graph that specifies how to interpret each peak using the subtopology reconstructed for other lighter peaks. By back-
Algorithm 2:
Composition2Spectrum

|
tracing the interpretation graph, we are able to obtain all topology candidates. PeakInterpreter maintains a pool of candidates, each of which serves as a potential building block for interpretation of a heavier peak. PeakInterpreter starts from the lightest peak and tries to interpret every peak as a B-ion, C-ion, or the precursor ion by searching for all allowable combinations of building blocks in the candidate pool that can be appended to a monosaccharide to derive a candidate set matching a heavier peak. The runtime of PeakInterpreter depends on the number of peaks to be interpreted and can increase significantly as the peak number increases. In this work, we improve PeakInterpreter to derive PeakInterpreter2 (Algorithm 3) that utilizes the monosaccharide composition constraint to dramatically reduce the search space for the following two reasons. First, PeakInterpreter2 only needs to interpret the experimental peaks that can be matched to those theoretically allowed by the composition constraint, which dramatically reduces the number of peaks to be interpreted. Second, PeakInterpreter2 does not need to examine the topologies that break the composition constraint.
Composition-to-Topology Database.
The composition-to-topology database DBC2T allows one to retrieve all topologies using a monosaccharide composition query. DBC2T organizes topologies and their subtopologies into topology sets and topology super sets. A topology super set contains all topologies (or subtopologies) of the same monosaccharide composition, which are organized in topology sets. A topology set contains topologies (or subtopologies) that have the same monosaccharide composition, are rooted at the same monosaccharide, and share the same branching pattern at its root. A branching pattern specifies the number of branches of all topologies (or subtopologies) in this topology set and the monosaccharide composition of each branch (i.e., each branch contains a set of subtopologies in a topology super set). The topology sets and topology super sets are stored in two cross-referred databases, DBC2TS and DBC2TSS, respectively. DBC2TS and DBC2TSS together effectively organize all topologies and subtopologies in a directed acyclic graph (DAG), which is similar to the interpretation graph. Each node in this DAG is either a topology set or a topology super set. A comprehensive DBC2T can be precomputed by traversing this DAG and be used later in calculating the p-value of a topology candidate. It is also indexed by the masses of topologies and stores the theoretical spectrum of each topology. This process is very time-consuming, but it fortunately only needs to be run once. For very large glycans, the number of possible topologies can be too large to precompute and store offline. For the purpose of computing empirical p-values, we can instead sample the DAG to obtain the desired number of topologies.
The construction of DBC2TS and DBC2TSS utilizes two algorithms, Composition2TSS (Algorithm 4) and CreateRootedTSS (Algorithm 5). Composition2TSS takes a monosaccharide composition C = [c1, c2,⋯, ck] as input and recursively reconstructs and saves all possible typologies (or subtopologies) satisfying this composition. The algorithm iterates through available monosaccharides in C. Each time, it picks a monosaccharide, say mi, as a root, and then calls the algorithm CreateRootedTSS (Algorithm 4) with the remaining composition to create all topologies (or subtopologies) rooted at mi.
Calculate Empirical p-Value of Topology Candidate.
After reconstructing the topology candidates using PeakInterpreter2, the IonClassifier of GlycoDeNovo is reused to score each peak in the given experimental spectrum. A score is derived for each topology candidate by summing up the IonClassifier scores of its supporting peaks. Note that each peak is given a score (the probability of being a B-/C-ion) by IonClassifier. To avoid double-counting, we do not count Y-/Z-ions as they are complementary to B-/C-ions. We can rank the topology candidates by their scores, which, however, do not indicate their statistical significance. Hence, we need to obtain the corresponding p-values to assess the likelihood of obtaining such a topology by random. GlycoDeNovo2 takes an empirical approach to achieve this. First, it samples with replacement a large number of topologies (currently set as up to the maximum of 10000 or 10% of the topologies queried from DBC2T), whose masses are within the mass accuracy of the experimental precursor mass, from the precomputed composition-to-topology database DBC2T. The theoretical spectrum for each sampled topology is matched against the experimental spectrum, and the IonClassifier scores of the matched peaks are summed up to derive a score of the sampled topology. The scores of all sampled topologies form an empirical distribution that can be used to derive a p-value for the score of a topology candidate reconstructed by PeakInterpreter2.
EXPERIMENTAL RESULTS
Data.
To test GlycoDeNovo2, we used 128 electronic excitation dissociation (EED) MS/MS spectra with their precursor mass values ranging from 668.35 to 3188.59 Da. Twenty-nine of these spectra were produced by analyses of synthetic or purified glycan standards (Table 1),22 and the rest were generated by LC–MS/MS analyses of glycans released from the glycoprotein standards ribonuclease B and bovine submaxillary mucin, and glycoproteins in human serum, each of which had been derivatized as indicated in Table 2. A porous graphitic carbon (PGC) column was used for online LC separation because it achieves the highest performance in resolving isomeric glycan structures.25 EED MS/MS spectra were recorded on a 12-T solariX hybrid Qh-Fourier-transform ion cyclotron resonance (FTICR) mass spectrometer (Bruker Daltonics, Bremen, Germany). Each spectrum was acquired with a 0.5 s transient, resulting in a typical mass resolving power of around 191000 at m/z 400. The experimental details on glycan release and derivatization, as well as the acquisition
Algorithm 3:
PeakInterpreter2

|
Algorithm 4:
Composition2TSS

|
of off-line and online EED tandem mass spectra, can be found in the Supporting Information.
Table 1.
Glycan Standards Used in This Study
| Short Name | Formula | Structure (CFG with linkage placement notation) |
|---|---|---|
| SLa | [Neu5Ac(α2–3) Gal(β1–3)] [Fuc(α1–4)] GlcNAc |

|
| SLx | [Neu5Ac(α2–3) Gal(β1–4)] [Fuc(α1–3)] GlcNAc |

|
| Lewis b | [Fuc(α1–2) Gal(β1–3)] [Fuc(α1–4)] GlcNAc |

|
| Lewis y | [Fuc(α1–2) Gal(β1–4)] [Fuc(α1–3)] GlcNAc |

|
| LNT | Gal(β1–3) GlcNAc(β1–3) Gal(β1–4) Glc |

|
| LNnT | Gal(β1–4) GlcNAc(β1–3) Gal((β1–4) Glc |

|
| LNFP I | Fuc(α1–2) Gal(β1–3) GlcNAc(β1–3) Gal(β1–4) Glc |

|
| LNFP II | [Gal(β1–3)] [Fuc(α1–4)] GlcNAc(β1–3) Gal(β1–4) Glc |

|
| LNFP III | [Gal(β1–4)] [Fuc(α1–3)] GlcNAc(β1–3) Gal(β1–4) Glc |

|
| CelHex | Glc(β1–4) Glc(β1–4) Glc((β1–4) Glc(β1–4) Glc(β1–4) Glc |
|
| MalHex | Glc(α1–4) Glc(α1–4) Glc(α1–4) Glc(α1–4) Glc(α1–4) Glc |
|
| N002 | [Neu5Ac(α2–3) Gal(β1–4) GlcNAc(β1–2) Man(α1–3)] [Neu5Ac(α2–3) Gal(β1–4) GlcNAc(β1–2) Man(α1–6)] Man(β1–4) GlcNAc(β1–4) GlcNAc |

|
| N003 | [Neu5Ac(α2–6) Gal(β1–4) GlcNAc(β1–2) Man(α1–3)] [Neu5Ac(α2–6) Gal(β1–4) GlcNAc(β1–2) Man(α1–6)] Man(β1–4) GlcNAc(β1–4) GlcNAc |

|
| N012 | [Neu5Ac(α2–3) Gal(β1–4) GlcNAc(β1–2) Man(α1–3)] [[Man(α1–3)] [Man(α1–6)] Man(α1–6)] Man(β1–4) GlcNAc(β1–4) GlcNAc |

|
| N013 | [Neu5Ac(α2–6) Gal(β1–4) GlcNAc(β1–2) Man(α1–3)] [[Man(α1–3)] [Man(α1–6)] Man(α1–6)] Man(β1–4) GlcNAc(β1–4) GlcNAc |

|
| N222 | [Neu5Ac(α2–3) Gal(β1–4) GlcNAc(β1–2) Man(α1–6)] [Gal(β1–4) GlcNAc(β1–2) Man(α1–3)] Man(β1–4) GlcNAc(β1–4) GlcNAc |

|
| N223 | [Neu5Ac(α2–6) Gal(β1–4) GlcNAc(β1–2) Man(α1–6)] [Gal(β1–4) GlcNAc(β1–2) Man(α1–3)] Man(β1–4) GlcNAc(β1–4) GlcNAc |

|
| N233 | [Neu5Ac(α2–3) Gal(β1–4) GlcNAc(β1–2) Man(α1–3)] [Neu5Ac(α2–6) Gal(β1–4) GlcNAc(β1–2) Man(α1–6)] Man(β1–4) GlcNAc(β1–4) GlcNAc |

|
| NA2F | [Gal(β1–4) GlcNAc(β1–2) Man(α1–6)] [Gal(β1–4) GlcNAc(β1–2) Man(α1–3)] Man(β1–4) GlcNAc(β1–4) [Fuc(α1–6)] GlcNAc |

|
| A2F | [Neu5Ac(α2–6) Gal(β1–4) GlcNAc(β1–2) Man(α1–3)] [Neu5Ac(α2–6) Gal(β1–4) GlcNAc(β1–2) Man(α1–6)] Man(β1–4) GlcNAc(β1–4) [Fuc(α1–6)] GlcNAc |

|
| Man9 | [[Man(α1–2) Man(α1–6)] [Man(α1–2) Man(α1–3)] Man(α1–6)] [Man(α1–2) Man(α1–2) Man(α1–3)] Man(β1–4) GlcNAc(β1–4) GlcNAc |

|
Table 2.
Empirical p-Valuesa
| glycan | REM | metal | no. of peaks used by GlycoDeNovo | no. of peaks used by GlycoDeNovo2 | no. of candidates | p-value |
|---|---|---|---|---|---|---|
| Lewis b | O18 | Cs | 329 | 10 | 3 | 0.03571 |
| Lewis b | O18 | Na | 216 | 11 | 4 | 0.03571 |
| Lewis y | O18 | Cs | 461 | 11 | 4 | 0.03571 |
| Lewis y | O18 | Na | 283 | 11 | 3 | 0.03571 |
| LNFP I | O18 | Cs | 469 | 12 | 16 | 0.01333 |
| LNFP I | O18 | Na | 516 | 8 | 13 | 0.01333 |
| LNFP II | O18 | Cs | 390 | 10 | 16 | 0.01333 |
| LNFP II | O18 | Na | 534 | 12 | 21 | 0.01333 |
| LNFP III | O18 | Cs | 471 | 10 | 16 | 0.01333 |
| LNFP III | O18 | Na | 477 | 8 | 17 | 0.01333 |
| LNFP II | D-R | Na | 546 | 17 | 13 | 0.01333 |
| NA2F | O18 | Na | 2389 | 23 | 101 | <10−5 |
| Man9 | O18 | Na | 2532 | 26/42/42/39 | 468 | <10−5 |
| A2F | Red | Na | 2646 | 56/105/126/78/111/95/153/102 | 1012216 | <10−5 |
| A2F | D-R | Na | 914 | 28/34/17/23/20/40/29 | 37 | <10−5 |
| N002 | D-R | Na | 2320 | 28/33/63/59/46/55/95/52 | 157478 | <10−5 |
| N003 | D-R | Na | 1571 | 19/23/47/44/30/40/65/32 | 1056 | <10−5 |
| N012 | D-R | Na | 2683 | 32/57/46 | 5001 | <10−5 |
| N013 | D-R | Na | 2544 | 31/45/42 | 3767 | <10−5 |
| N222 | D-R | Na | 953 | 20/34/37 | 51 | <10−5 |
| N223 | D-R | Na | 2674 | 36/54/61 | 14963 | <10−5 |
| N233 | D-R | Na | 2326 | 27/28/60/65/47/49/93/47 | 2557 | <10−5 |
| Lewis b | none | Na | 218 | 13 | 4 | 0.03571 |
| LNT | none | Na | 317 | 7 | 5 | 0.1 |
| LNnT | none | Na | 270 | 9 | 5 | 0.1 |
| SLa | none | Na | 459 | 11/17/15 | 14 | 0.00521 |
| SLx | none | Na | 333 | 13/19/17 | 22 | 0.00521 |
| CelHex | none | Na | 412 | 11 | 11 | 0.09091 |
| MalHex | none | Na | 468 | 11 | 11 | 0.09091 |
All glycans are permethylated.
The “REM” column indicates the type of reducing end modifications (O18 = 18O-labeled, D-R = deutero-reduced, Red = reduced). The “no. of peaks used by GlycoDeNovo” column lists the peak number of each preprocessed spectrum (i.e., used by PeakInterpreter of GlycoDeNovo). The “#no. of peaks used by GlycoDeNovo2” column lists the peak number in each filtered spectrum used by PeakInterpreter2 of GlycoDeNovo2. Some have multiple filtered spectra. For example, N002 has eight filtered spectra. The “no. of andidates” column lists the number of the reconstructed topology candidates. The “p-value” column lists the empirical p-values of the correct topologies.
All spectra were manually interpreted based on our current knowledge of the EED fragmentation process and the glycan
Algorithm 5:
CreateRootedTSS

|
biosynthetic pathways. The peak assignment mass accuracy is typically 1 ppm or better for spectra acquired by direct infusion and 2 ppm or better for spectra acquired by LC–MS/MS. All 128 spectra were used in comparing the speeds of GlycoDeNovo and GlycoDeNovo2 but only those produced by glycan standards with known structures were used in demonstrating the p-value calculation function of GlycoDeNovo2.
Runtime Comparison.
We implemented GlycoDeNovo2 based on GlycoDeNovo by adding the monosaccharide composition constraint and parallel computing. Figure 3 compares the efficiency and scalability of GlycoDeNovo2 and GlycoDeNovo. They were both run on computers of the same setting (Intel Core i7-9750H CPU @ 2.60 GHz, 16.0 GB RAM) for a fair comparison. Each reconstruction thread only uses one CPU core. To deal with uncontrollable system fluctuations, we ran both algorithms 10 times on each MS/MS spectrum and calculated the mean of the ratios between their runtimes. In all cases, GlycoDeNovo2 runs significantly faster than GlycoDeNovo, and this speed advantage is more pronounced for larger glycans that tend to generate a higher number of peaks in their tandem mass spectra. For example, on small glycans (e.g., Lewis b and Lewis y), GlycoDeNovo2 runs ~5× faster than GlycoDeNovo. The speed advantage of GlycoDeNovo2 is more pronounced on larger glycans, which tend to have more peaks in their spectra. For example, GlycoDeNovo2 runs ~10× faster on N222 and ~100 times faster on NA2F. With this improvement in running speed, it is possible to reconstruct topologies from MS/MS data in real-time, even for large glycans. This ability is key to intelligent selection of MS2 fragments for MS3 analysis following online LC separation.
Figure 3.

Compare the speeds of GlycoDeNovo and GlycoDeNovo2. The x-axis indicates the peak numbers of spectra. The y-axis is the running time ratio between GlycoDeNovo and GlycoDeNovo2. Each dot represents one experimental spectrum. There are 128 spectra in total.
Time Complexity Analysis.
We22 previously showed that the time complexity of GlycoDeNovo PeakInterpreter is O(|G| × NH+1), where G is the set of the allowed monosaccharide classes, N is the number of peaks in the MS/MS spectrum being considered, and H (1 ≤ H ≤ 4) is the maximum branching number allowed in glycans and can be adjusted by users to match with their data. The number of peaks is a key base factor affecting the speed. As glycan structures become more complicated, the number of MS/MS peaks in general increases, and this expansion results in an exponential growth in running time. GlycoDeNovo2 utilizes the composition constraint to significantly reduce the number of peaks that need to be considered (Figure 4). In our experiments, GlycoDenovo2 on average only uses ~4.5% of peaks considered by GlycoDeNovo. Taking the spectrum of sialyl Lewis a (SLa) as an example, GlycoDeNovo needs to interpret 459 peaks. GlycoDeNovo2 first retrieves three monosaccharide compositions: [2 Fuc, 1 HexNAc, 1 Neu5Gc], [1 Fuc, 1 Hex. One HexNAc, 1 Neu5Ac], and [2 Xyl, 1 Fuc, 2 HexNAc], where each digit indicates the number of the following monosaccharide contained in a legal topology candidate. The corresponding three filtered spectra have only 11, 17, and 15 peaks, respectively, which are substantially lower than the number of peaks in the original spectrum. As the result, GlycoDeNovo2 runs 6.5 faster than GlycoDeNovo in this case. The reconstruction results of SLa are provided as an example in the Supporting Information.
Figure 4.

Comparison of the number of peaks used in topology reconstruction. The x-axis indicates the protonated m/z values of the precursors. The y-axis indicates the ratio between the number of peaks used by GlycoDeNovo and that used by Glycoenovo2. Each dot represents one experimental spectrum. There are 128 spectra in total.
Empirical p-Values of Reconstructed Topologies.
Like GlycoDeNovo, GlycoDeNovo2 is able to correctly reconstruct the topologies of all glycans listed in Table 1. In addition, GlycoDeNovo2 calculates the statistical significance of the topology candidates. Table 2 lists the empirical p-values of the correct topology candidates for the glycans in Table 1 and clearly indicates the correct topology candidates for those glycans are statistically significant.
DISCUSSION
The current implementation of GlycoDeNovo2 has only been tested on high-resolution EED tandem mass spectra of permethylated glycans, as these are the only type of tandem mass spectra included in the training data set used to establish the IonClassifier for topology ranking here. The benefits of permethylation for glycan structural analysis are well documented: it increases sensitivity, minimizes facile loss of sialic acid residues, facilitates differentiation of terminal and internal fragments, and prevents gas-phase structural rearrangement during tandem MS analysis. It is possible, however, to apply GlycoDeNovo2 to analyze tandem mass spectra of other glycan derivatives, as demonstrated previously on glycans modified with a reducing-end fixed charge.26 To ensure that the reducing and nonreducing ends of glycans are unambiguously identified we recommend that users apply one of these or some other straightforward derivatization strategy when using GlycoDeNovo or GlycoDeNovo2 in conjunction with analysis of native glycans.
Analysis of tandem mass spectra generated by other fragmentation methods should also be possible, provided that the dissociation technique can produce a complete or near-complete series of glycosidic cleavages. As shown previously, by turning on the “gap” option, GlycoDeNovo can successfully reconstruct topologies from tandem mass spectra with no more than one consecutive missed cleavage.25 Fragmentation methods that fall into this category may include ultraviolet photodissociation (UVPD), electron transfer dissociation (ETD), electron transfer/higher-energy collision dissociation (EThcD), charge transfer dissociation (CTD), and potentially negative mode collision-induced dissociation (nCID). It is important to note that while the PeakInterpreter module can be easily adopted to handle different types of tandem mass spectra, the IonClassifier must be re-established for each tandem MS method using a training data set consisting of spectra generated by the same dissociation technique.
To date, both GlycoDeNovo and GlycoDeNovo2 have only been evaluated on spectra acquired on FTICR MS or Omnitrap-Orbitrap instruments,27 with the mass tolerance set to 5 ppm. To evaluate the influence of the mass accuracy setting, we retrained the IonClassifier and performed candidate ranking on the same data set used previously, but with a 10 ppm mass tolerance. For a biantennary disialylated glycan (N002 in Tables 1 and 2), the number of reconstructed topologies increased from 157478 at 5 ppm to 292778 at 10 ppm, an ~86% increase, due to a higher chance in peak misassignment. However, the IonClassifier still correctly identified the true topology as the top-ranked candidate by itself. This suggests that our approach could be used to analyze spectral data acquired on instruments with moderate mass accuracy, such as time-of-flight (TOF) instruments equipped for ECD. Given the recent advance in MS instrumentation, particularly the availability of an ECD cell on commercial qTOF instruments, the ability of GlycoDeNovo to analyze moderate-quality tandem mass spectra is crucial for its adoption by the glycoscience research community.
We have so far focused on the development and optimization of GlycoDeNovo for the analysis of free or derivatized oligosaccharides. Recently, several algorithms (e.g., GlycoSeq,28 pGlyco 2.0,29 and StrucGP30) have been developed for elucidating glycan topologies from MS/MS spectra in the context of glycopeptide identification. GlycoSeq28 was developed for sequencing N-linked glycans in glycopeptides from CID MS/MS spectra. It employs glycosidic linkage rules defined by glycan synthetic pathways and glycosyltransferases to eliminate improbable topology candidates. pGlyco 2.029 searches for glycan candidates by matching a spectrum against a user-specified glycome database. StrucGP,30 which was developed for de novo topology interpretation of N-glycans in glycopeptides from HCD MS/MS spectra, divides an N-glycan into three modules (core structure, glycan subtypes, and branch structures) and identifies each module using distinct patterns of Y ions or a combination of distinguishable B/Y ions. Prior knowledge about branch structures is needed to build a theoretical branch structure database with a mass range up to 1300 Da. Identification of branch structure is done by matching experimental MS/MS spectra with the database. Given the flexibility of GlycoDeNovo2, we anticipate that it can be adapted to reconstructing glycan topologies from the MS/MS spectra of glycopeptides recorded under conditions where peaks corresponding to the products of glycosidic cleavage are dominant.
Data & Software:
A public Github repository (https://github.com/Cyrus9721/GlycoDenovo2) contains the spectral data of the 29 glycan standards (Table 1) and the GlycoDeNovo2 software (MATLAB executable and Python components) with running instructions. The raw spectral data for LC–MS/MS analyses of released N- and O-linked glycans will be made available when their respective main articles are published.
CONCLUSIONS
We present GlycoDeNovo2, a new, fast algorithm for de novo reconstruction of glycan topologies from MS/MS data. It offers a functionality to calculate the p-values of the reconstructed topologies. It allows the determination of the monosaccharide compositions for glycans satisfying any given precursor mass, within defined mass measurement accuracy limits, which can then be used to constrain the search space of potential topologies. The mapping from masses to monosaccharide compositions can be precomputed. A theoretical spectrum can be precomputed for each monosaccharide composition to include the theoretical glycosidic fragments of all topology candidates satisfying the monosaccharide composition constraint. Given an experimental MS/MS spectrum, GlycoDeNovo2 retrieves all monosaccharide compositions and their theoretical spectra, which are within the mass accuracy of the experimental precursor mass. The retrieved theoretical spectra are then filtered by the experimental spectrum before being used for reconstructing topology candidates. The number of peaks in such a filtered theoretical spectrum is substantially smaller than that in the experimental spectrum. Hence, it takes a considerably shorter time to reconstruct topologies from a filtered theoretical spectrum. In addition, the reconstruction process for each monosaccharide composition can run independently, i.e., GlycoDeNovo2 can parallelize the reconstruction processes for all monosaccharide compositions. Experimental results show that GlycoDeNovo2 runs significantly faster than its predecessor GlycoDeNovo. Existing topology reconstruction algorithms assign a numerical score to each topology candidate. However, the statistical significance of such a score is unknown. GlycoDeNovo2 deploys a procedure to calculate the empirical p-values of a reconstructed topology candidate. In our experiments, a set of standard glycans, whose structures are known, were used to demonstrate that GlycoDeNovo2 can reconstruct the correct topologies, with significant p-values.
Supplementary Material
ACKNOWLEDGMENTS
This work was supported by NIH R01 GM132675, NIH R24 GM134210, NIH S10 RR025082, and NSF OAC 1920147. The contents are solely the responsibility of the authors and do not represent the official views of the awarding offices.
Footnotes
Supporting Information
The Supporting Information is available free of charge at https://pubs.acs.org/doi/10.1021/jasms.1c00288.
Sample preparation, a reconstruction example (PDF)
Peak lists (ZIP)
Complete contact information is available at: https://pubs.acs.org/10.1021/jasms.1c00288
The authors declare no competing financial interest.
Contributor Information
Zizhang Chen, Department of Computer Science, Brandeis University, Waltham, Massachusetts 02453, United States.
Juan Wei, Department of Biochemistry, Boston University School of Medicine, Boston, Massachusetts 02118, United States.
Yang Tang, Department of Chemistry, Boston University, Boston, Massachusetts 02215, United States.
Cheng Lin, Department of Biochemistry, Boston University School of Medicine, Boston, Massachusetts 02118, United States.
Catherine E. Costello, Department of Biochemistry, Boston University School of Medicine, Boston, Massachusetts 02118, United States; Department of Chemistry, Boston University, Boston, Massachusetts 02215, United States.
Pengyu Hong, Department of Computer Science, Brandeis University, Waltham, Massachusetts 02453, United States.
REFERENCES
- (1).Helenius A; Aebi M Intracellular functions of N-linked glycans. Science 2001, 291 (5512), 2364–9. [DOI] [PubMed] [Google Scholar]
- (2).Ohtsubo K; Marth JD Glycosylation in cellular mechanisms of health and disease. Cell 2006, 126 (5), 855–67. [DOI] [PubMed] [Google Scholar]
- (3).Varki A Biological roles of glycans. Glycobiology 2017, 27 (1), 3–49. [DOI] [PMC free article] [PubMed] [Google Scholar]
- (4).Dennis JW; Granovsky M; Warren CE Glycoprotein glycosylation and cancer progression. Biochim. Biophys. Acta 1999, 1473 (1), 21–34. [DOI] [PubMed] [Google Scholar]
- (5).Dube DH; Bertozzi CR Glycans in cancer and inflammation–potential for therapeutics and diagnostics. Nat. Rev. Drug Discov 2005, 4 (6), 477–88. [DOI] [PubMed] [Google Scholar]
- (6).Jefferis R Glycosylation as a strategy to improve antibody-based therapeutics. Nat. Rev. Drug Discov 2009, 8 (3), 226–34. [DOI] [PubMed] [Google Scholar]
- (7).Sola RJ; Griebenow K Glycosylation of therapeutic proteins: an effective strategy to optimize efficacy. BioDrugs 2010, 24 (1), 9–21. [DOI] [PMC free article] [PubMed] [Google Scholar]
- (8).Dell A; Morris HR Glycoprotein structure determination by mass spectrometry. Science 2001, 291 (5512), 2351–6. [DOI] [PubMed] [Google Scholar]
- (9).Zaia J Mass spectrometry of oligosaccharides. Mass Spectrom Rev 2004, 23 (3), 161–227. [DOI] [PubMed] [Google Scholar]
- (10).Domon B; Costello CE A systematic nomenclature for carbohydrate fragmentations in FAB-MS/MS spectra of glycoconju-gates. Glycoconjugate Journal 1988, 5 (4), 397–409. [Google Scholar]
- (11).Tseng K; Hedrick JL; Lebrilla CB Catalog-library approach for the rapid and sensitive structural elucidation of oligosaccharides. Anal. Chem 1999, 71 (17), 3747–54. [DOI] [PubMed] [Google Scholar]
- (12).Joshi HJ; Harrison MJ; Schulz BL; Cooper CA; Packer NH; Karlsson NG Development of a mass fingerprinting tool for automated interpretation of oligosaccharide fragmentation data. Proteomics 2004, 4 (6), 1650–64. [DOI] [PubMed] [Google Scholar]
- (13).Lohmann KK; von der Lieth CW GlycoFragment and GlycoSearchMS: web tools to support the interpretation of mass spectra of complex carbohydrates. Nucleic Acids Res 2004, 32 (Web Server issue), W261–6. [DOI] [PMC free article] [PubMed] [Google Scholar]
- (14).Cooper CA; Gasteiger E; Packer NH GlycoMod–a software tool for determining glycosylation compositions from mass spectrometric data. Proteomics 2001, 1 (2), 340–9. [DOI] [PubMed] [Google Scholar]
- (15).Gaucher SP; Morrow J; Leary JA STAT: a saccharide topology analysis tool used in combination with tandem mass spectrometry. Anal. Chem 2000, 72 (11), 2331–6. [DOI] [PubMed] [Google Scholar]
- (16).Ethier M; Saba JA; Ens W; Standing KG; Perreault H Automated structural assignment of derivatized complex N-linked oligosaccharides from tandem mass spectra. Rapid Commun. Mass Spectrom 2002, 16 (18), 1743–54. [DOI] [PubMed] [Google Scholar]
- (17).Ethier M; Saba JA; Spearman M; Krokhin O; Butler M; Ens W; Standing KG; Perreault H Application of the StrOligo algorithm for the automated structure assignment of complex N-linked glycans from glycoproteins using tandem mass spectrometry. Rapid Commun. Mass Spectrom 2003, 17 (24), 2713–20. [DOI] [PubMed] [Google Scholar]
- (18).Tang H; Mechref Y; Novotny MV Automated interpretation of MS/MS spectra of oligosaccharides. Bioinformatics 2005, 21 (Suppl 1), i431–9. [DOI] [PMC free article] [PubMed] [Google Scholar]
- (19).Sun W; Lajoie GA; Ma B; Zhang K A Novel Algorithm for Glycan de novo Sequencing Using Tandem Mass Spectrometry. In Bioinformatics Research and Applications; Springer International Publishing: Switzerland. 2015; pp 320–330. [Google Scholar]
- (20).Dong Liang; Shi Bing; Tian Guangdong; Li YanBo; Wang Bing; Zhou MengChu. An Accurate de novo Algorithm for Glycan Topology Determination from Mass Spectra. IEEE/ACM Trans Comput. Biol. Bioinform 2015, 12 (3), 568–78. [DOI] [PubMed] [Google Scholar]
- (21).Kumozaki S; Sato K; Sakakibara Y A Machine Learning Based Approach to de novo Sequencing of Glycans from Tandem Mass Spectrometry Spectrum. IEEE/ACM Trans Comput. Biol. Bioinform 2015, 12 (6), 1267–74. [DOI] [PubMed] [Google Scholar]
- (22).Hong P; Sun H; Sha L; Pu Y; Khatri K; Yu X; Tang Y; Lin C GlycoDeNovo - an Efficient Algorithm for Accurate de novo Glycan Topology Reconstruction from Tandem Mass Spectra. J. Am. Soc. Mass Spectrom 2017, 28 (11), 2288–2301. [DOI] [PMC free article] [PubMed] [Google Scholar]
- (23).Shan B; Ma B; Zhang K; Lajoie G Complexities and algorithms for glycan sequencing using tandem mass spectrometry. J. Bioinform Comput. Biol 2008, 6 (1), 77–91. [DOI] [PubMed] [Google Scholar]
- (24).Ju F; Zhang J; Bu D; Li Y; Zhou J; Wang H; Wang Y; Huang C; Sun S De novo glycan structural identification from mass spectra using tree merging strategy. Comput. Biol. Chem 2019, 80, 217–224. [DOI] [PubMed] [Google Scholar]
- (25).Wei J; Tang Y; Bai Y; Zaia J; Costello CE; Hong P; Lin C Toward Automatic and Comprehensive Glycan Characterization by Online PGC-LC-EED MS/MS. Anal. Chem 2020, 92 (1), 782–791. [DOI] [PMC free article] [PubMed] [Google Scholar]
- (26).Tang Y; Pu Y; Gao J; Hong P; Costello CE; Lin C De novo glycan sequencing by electronic excitation dissociation and fixed-charge derivatization. Anal. Chem 2018, 90 (6), 3793–3801. [DOI] [PMC free article] [PubMed] [Google Scholar]
- (27).Wei J; Papanastasiou D; Kosmopoulou M; Smyrnakis A; Tang Y; Zaia J; Hong P; Costello CE; Lin C EED MS2-guided-MS3 on Q Exactive-Omnitrap: a novel approach toward automated, de novo glycan sequencing. 68th ASMS Conference on Mass Spectrometry and Allied Topics (Reboot) 2020, 34, 1. [Google Scholar]
- (28).Yu CY; Mayampurath A; Zhu R; Zacharias L; Song E; Wang L; Mechref Y; Tang H Automated Glycan Sequencing from Tandem Mass Spectra of N-Linked Glycopeptides. Anal. Chem 2016, 88 (11), 5725–32. [DOI] [PMC free article] [PubMed] [Google Scholar]
- (29).Liu MQ; Zeng WF; Fang P; Cao WQ; Liu C; Yan GQ; Zhang Y; Peng C; Wu JQ; Zhang XJ; Tu HJ; Chi H; Sun RX; Cao Y; Dong MQ; Jiang BY; Huang JM; Shen HL; Wong CCL; He SM; Yang PY pGlyco 2.0 enables precision N-glycoproteomics with comprehensive quality control and one-step mass spectrometry for intact glycopeptide identification. Nat. Commun 2017, 8 (1), 438. [DOI] [PMC free article] [PubMed] [Google Scholar]
- (30).Shen J; Jia L; Dang L; Su Y; Zhang J; Xu Y; Zhu B; Chen Z; Wu J; Lan R; Hao Z; Ma C; Zhao T; Gao N; Bai J; Zhi Y; Li J; Zhang J; Sun S StrucGP: de novo structural sequencing of site-specific N-glycan on glycoproteins using a modularization strategy. Nat. Methods 2021, 18 (8), 921–929. [DOI] [PubMed] [Google Scholar]
Associated Data
This section collects any data citations, data availability statements, or supplementary materials included in this article.