Abstract
Commercial bone sonometers measure broadband ultrasonic attenuation (BUA) and/or speed of sound (SOS) in order to assess bone status. Phase velocity, which is usually measured in frequency domain, is a fundamental material property of bone that is related to SOS, which is usually measured in time domain. Four previous in vitro studies indicate that phase velocity in human cancellous bone decreases with frequency (i.e. negative dispersion). In order to investigate frequency-dependent phase velocity in vivo, through-transmission measurements were performed in 73 women using a GE Lunar Achilles Insight ® commercial bone sonometer. Average phase velocity at 500 kHz was 1489 ± 55 m/s (mean ± standard deviation). Average dispersion rate was −59 ± 52 m/sMHz. Group velocity was usually lower than phase velocity, as is expected for negatively-dispersive media. Using a stratified model to represent cancellous bone, the reductions in phase velocity and dispersion rate in vivo as opposed to in vitro can be explained by 1) the presence of marrow instead of water as a fluid filler, and 2) the decreased porosity of bones of living (compared with deceased) subjects.
Keywords: calcaneus, trabecular bone, cancellous bone, velocity, dispersion, osteoporosis
Introduction
Commercial bone sonometers measure broadband ultrasonic attenuation (BUA) and/or speed of sound (SOS) in order to assess bone status (Laugier, 2004). Many studies document the utility of SOS for this purpose (Rossman et al., 1989; Tavakoli and Evans, 1991; Zagzebski et al., 1991; Schott et al., 1995; Turner et al., 1995; Njeh et al., 1996, Hans et al., 1996; Gluer et al., 1996; Bouxsien, 1997; Bauer et al., 1997; Laugier et al., 1997; Strelitzki and Evans, 1996; Strelitzki, et al., 1997; Nicholson et al., 1996; Nicholson et al., 1998, Thompson et al., 1998; Hans et al., 1999, H. Trebacz, and A. Natali, et al., 1999; Hoffmeister et al., 2000; Hoffmeister et al., 2002; Chaffai et al., 2002; Lee et al., 2003; Gluer et al., 2004; Yamoto et al., 2006).
Measures of wave velocity include phase velocity (velocity of a single-frequency component), group velocity (velocity of the center of a pulse), and signal velocity (velocity of the front of a pulse) (Morse and Ingard, 1986). These quantities are all closely related to time-domain SOS measurements performed by commercial bone sonometers. Several investigators have reported that phase velocity usually (but not always) decreases with frequency in human calcaneus samples in vitro (Stelitzki and Evans, 1996; Nicholson et al., 1996; Droin et al., 1998; Wear, 2000). This is unusual for biologic tissue and is contrary to what one might expect based on models relating frequency-dependent attenuation and frequency-dependent phase velocity (O’Donnell et al., 1981; Waters et al., 2000; Mobley et al., 2003). However, the so-called “restricted-bandwidth form” of the Kramers-Kronig relations has been shown to accurately predict negative dispersion in bovine cancellous bone (Waters and Hoffmeister, 2005). Negative dispersion can also be explained by interference between fast and slow longitudinal modes in cancellous bone even when each mode is positively-dispersive (Marutyan et al., 2006a; Marutyan et al., 2006b).
Another model that can predict negative dispersion is the so-called “stratified model.” The simplest example of a stratified medium consists of alternating parallel layers of two materials as shown in Figure 1. Fundamental theory of stratified media was developed by Bruggeman (1935), Tarkov (1940), Riznichenko (1949), Postma (1955), and Rytov (1956). Brekhovskikh (1980) wrote a nice summary. Plona and co-workers (1987) demonstrated good agreement between theory and experiment for negative dispersion in aluminum/water and plexiglass/water stratified media. While the stratified model is based on a simplistic geometric model for cancellous bone, it can be useful for understanding the dependences of phase velocity on various structural and material parameters of the two components: 1) the trabecular bone material, and 2) the fluid filler, which is either marrow (in vivo) or water (in vitro). The stratified model has been shown to be useful for predicting angular dependence of fast and slow compressional waves in bovine cancellous bone in vitro (Hughes et al., 1999; Padilla and Laugier, 2000), negative dispersion in human cancellous bone in vitro (Wear, 2001; Lee, 2006), and negative dispersion in cancellous-bone-mimicking phantoms (Lee, 2006).
Figure 1.
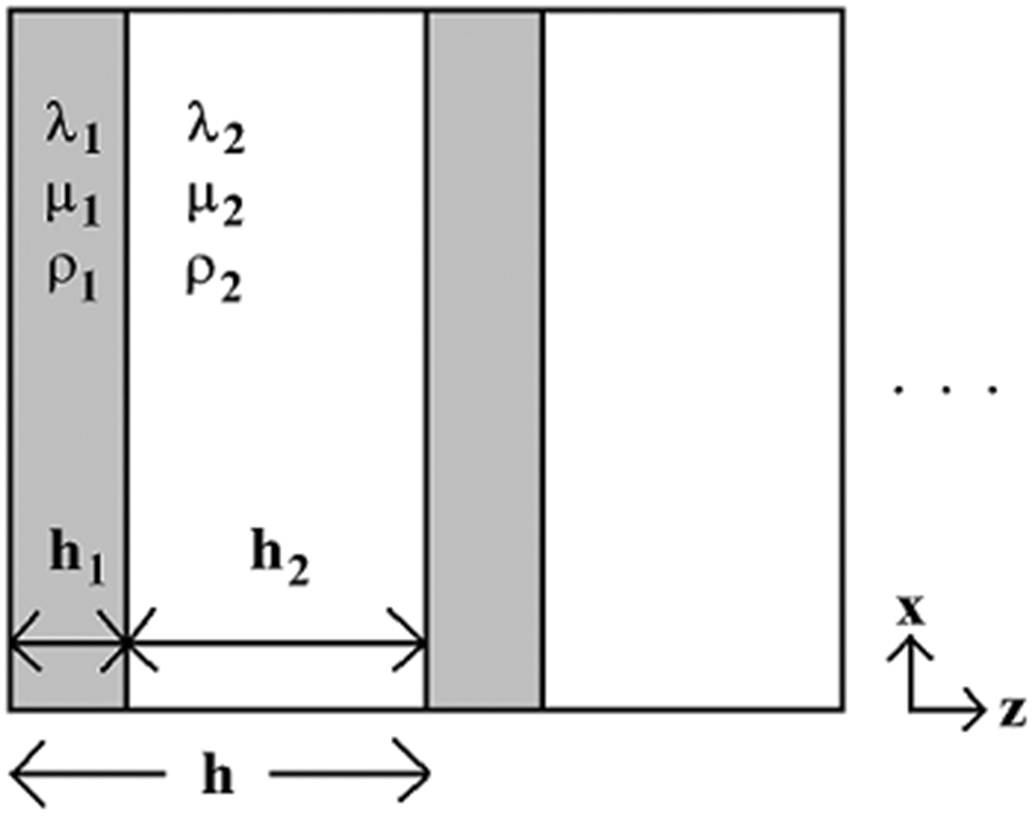
The stratified model represents a composite medium as a one-dimensional structure of alternating layers of two media with density ρ and Lamé constants λ and μ.
Most publications of phase velocity and dispersion in bone report measurements performed on bone samples in vitro. One exception provides measurements on a single human volunteer, and shows gradual negative dispersion (Chen and Chen, 2006). The present study offers the first in vivo measurements of phase velocity and dispersion in a large human population (73 women). The stratified model is used to provide context for a comparison between these in vivo measurements and previous in vitro measurements.
Methods
Data Acquisition
A GE Lunar Achilles Insight ® clinical bone sonometer was used for data acquisition (http://www.gehealthcare.com/usen/bone_densitometry/products/achilles.html). This system used a circular (25.4 mm diameter), broadband, piston transducer (center frequency = 500 kHz) for transmission of ultrasound medio-laterally through the foot. Radiofrequency (RF) data were acquired using 52 central elements (corresponding to a 25.4-mm-diameter circular area) of the Insight’s 590-element 2D receiver array. The element spacing was 3.175 mm. The element size was about 2 mm. The beam propagation distance was 10 cm. Data were digitized at 10 MHz. Signals from the 52 central elements were summed in order to form a single output signal. The Achilles Insight displays a real-time attenuation image in order to permit accurate positioning of the foot prior to data acquisition. Calibration spectra were obtained by performing measurements with only a temperature-controlled water path between the transmitting and receiving transducers.
In order to validate the data acquisition and analysis hardware/software, phase velocity measurements were performed on a 25.8-mm-thick polycarbonate plate that had previously been interrogated using a laboratory setup consisting of two co-axially aligned, focused 500 kHz Panametrics (Waltham, MA) 25.4-mm-diameter transducers, a Panametrics 5800 pulser / receiver, and a LeCroy 9310C digitizing oscilloscope (Wear, 2000).
Clinical Protocol
Measurements were performed in the non-dominant feet of 73 ambulatory, non-pregnant women who were free of conditions that may be associated with altered bone metabolism including chronic renal disease, chronic liver disease, hyperparathyroidism, active hyperthyroidism, hypothyroidism, diabetes (type I or type II), cancer, Paget’s disease, anorexia, bulimia, lactose intolerance, milk allergy, malabsorption syndrome, osteomalacia (Rickets), Vitamin D deficiency, or rheumatoid arthritis. Each subject removed shoes, socks, and/or stockings. A mist of isopropyl alcohol was sprayed on the foot in order to enhance coupling between the ultrasound beam and the foot. Table I gives demographic information. The set of volunteers included 5 African Americans, 9 Asian Americans, and 59 Caucasians. A GE Lunar PIXI DEXA calcaneal bone densitometer was used to measure areal BMD, which was reported in absolute units (g/cm2) and also as a T-score (the number of standard deviations above or below the mean value for the normal reference population).
Table I.
Demographic information for clinical study.
| Mean | Standard Deviation | Range | |
|---|---|---|---|
| Age (years) | 47 | 13 | (21, 78) |
| Height (inches) | 64 | 2 | (59, 68) |
| Weight (lb.s) | 136 | 26 | (95, 220) |
| BMD (gm/cm2) | 0.467 | 0.092 | (0.241, 0.700) |
| DEXA T-score | −0.4 | 1.1 | (−3.2, 2.8) |
Data Analysis
Phase velocity was computed using
| (1) |
where ω = 2πf, and f is frequency. The calcaneal thickness, d, was assumed to be 2.5 cm, which corresponds to the average value reported by Nicholson et al. (1997) based on post-mortem measurements from 28 female calcanea. The speed of sound in water, cw, was assumed to be 1525 m/s (at 37° in the Achilles temperature-controlled water reservoirs) (Kaye and Laby, 1973). The phase difference, Δϕ(ω), which is the difference between the phases of the water-path-only-measurement and the in vivo measurement, was computed as follows. The Fast Fourier Transform (FFT) of each digitized received signal was taken. The frequency-dependent phase of the signal at each frequency was computed from the inverse tangent of the ratio of imaginary to real parts of the FFT. Since the inverse tangent function yields principal values between -π and π, the phase had to be unwrapped by adding an integer multiple of 2π to all frequencies above each frequency where a discontinuity appeared. Another method for dispersion measurement is the split-spectrum processing technique described by Chen and Chen (2006).
In order to provide a useful comparison for phase velocity measurements, group velocity, cg, was also measured, using both time-domain and frequency-domain methods. For the time-domain method, the following formula was used:
| (2) |
where Δt is the difference in arrival times of envelope maxima between the water-path-only-measurement and the in vivo measurement. In order to suppress low frequency noise, digitized pulses were bandpass filtered (Gaussian filter with center frequency of 500 kHz and standard deviation of 200 kHz) prior to envelope detection. Signal envelopes were computed using the Hilbert transform.
For the frequency-domain method, the following formula was used (Morse and Ingard, 1986, and Duck, 1990):
| (3) |
where cpc is the phase velocity at the center frequency of the pulse (500 kHz), ωc. This method was previously employed by Strelitzki and Evans (1996).
Substitution techniques can exhibit appreciable error if the velocity differs substantially between the sample and the reference (Kaufman et al., 1995). However, this diffraction-related error has been reported to be negligible in cancellous specimens from human calcaneus in vitro (Droin et al., 1998).
Results
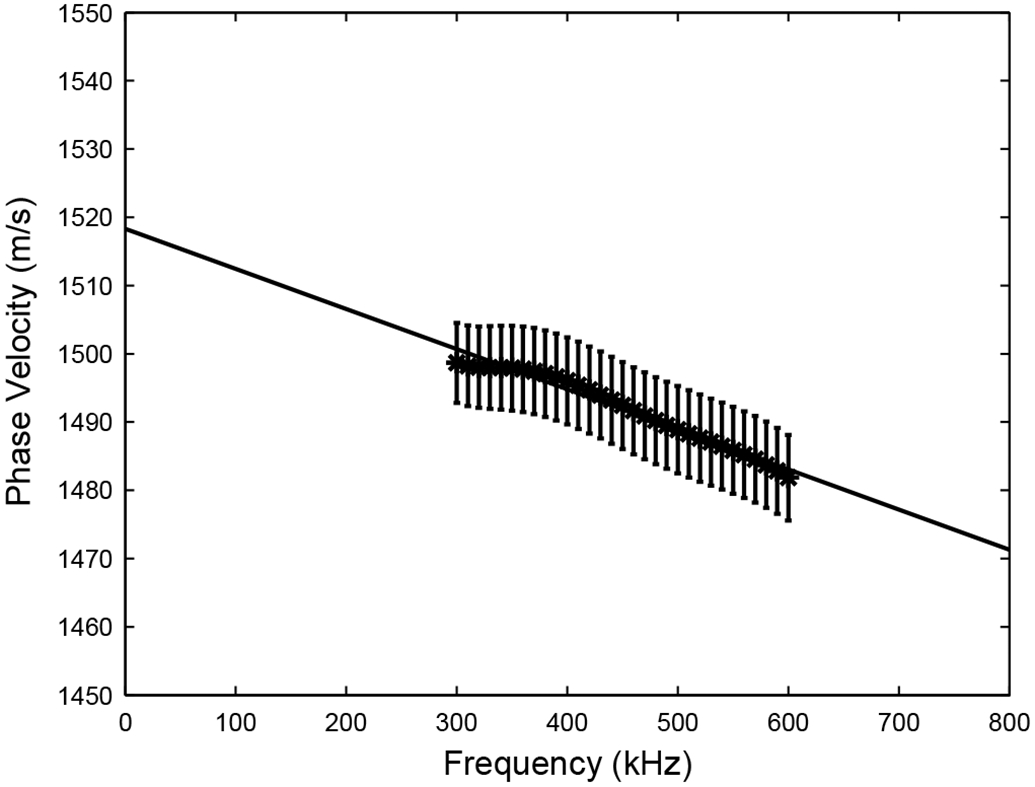
Figure 2 shows measurements of phase velocity in the polycarbonate plate obtained using 1) the GE Achilles Insight, and 2) Panametrics transducers in a water tank (Wear, 2000). The two sets of measurements are in good agreement with each other. This agreement establishes confidence in the clinical data acquisition and analysis systems.
Figure 2.
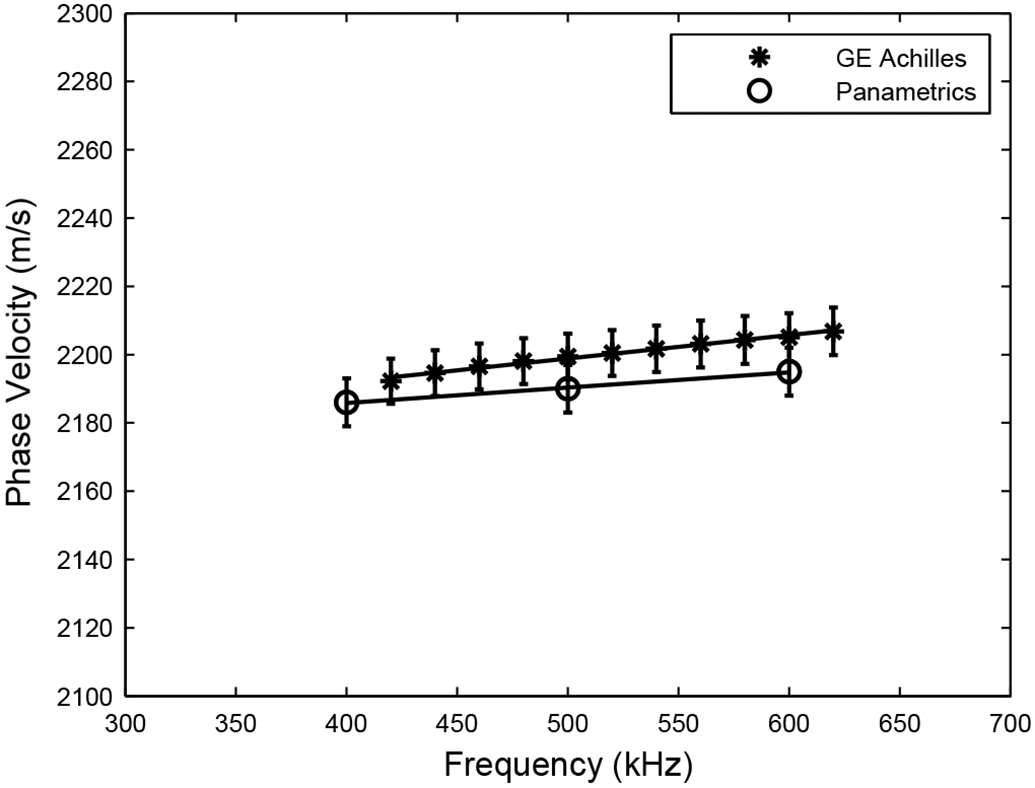
Measurements of frequency-dependent phase velocity on polycarbonate plate obtained using 1) the GE Achilles Insight, and 2) Panametrics transducers in a water tank.
Figure 3 compares time-domain and frequency-domain measurements of group velocity in 73 women. The two sets of measurements are in excellent agreement and reinforce confidence in the group and phase velocity measurement methods. The fact that some group velocity estimates are quite low (near 1350 m/s) may be partially due to the fixed heel width assumption (2.5 cm). Equations (1) and (2) underestimate group velocity when d is underestimated and Δt > 0.
Figure 3.
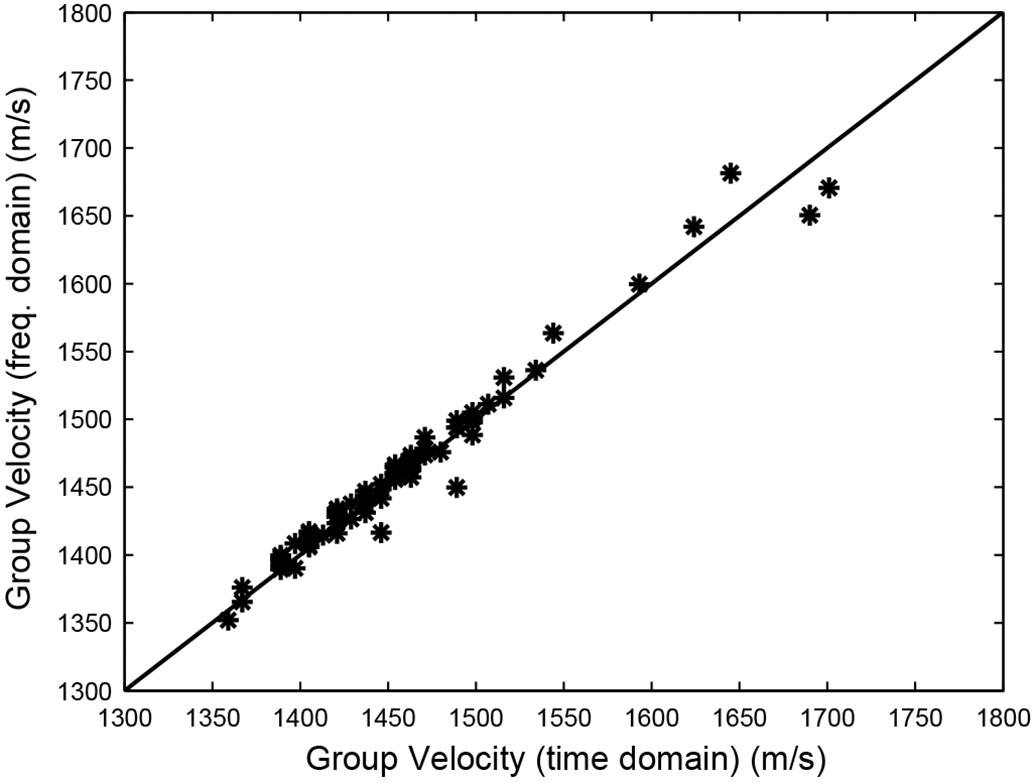
Time domain vs. frequency domain measurements of group velocity in 73 women.
Figure 4 compares group and phase velocity measurements in 73 women. The phase velocity measurements tend to be higher, as is expected in negatively-dispersive media (see Equation 3).
Figure 4.
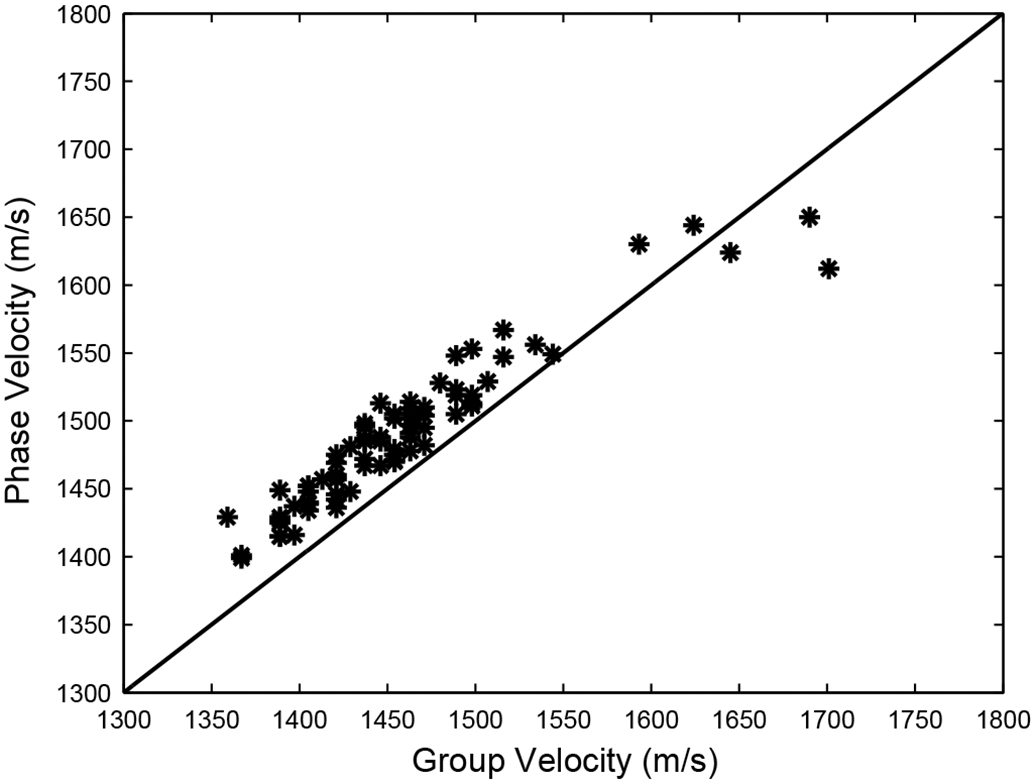
Phase velocity vs. group velocity in 73 women.
Figure 5 shows average frequency-dependent phase velocity in 73 women. Average phase velocity at 500 kHz was 1489 ± 55 m/s (mean ± standard deviation). Average dispersion rate (obtained from a linear least-squares regression fit) was −59 ± 52 m/sMHz.
Figure 5.
Average frequency-dependent phase velocity in 73 women. Error bars denote standard errors.
Discussion
The mean calcaneal dispersion rate of −59 m/sMHz measured here in vivo was more negative than those previously reported in vitro, which range from −15 to −40 m/sMHz (average of the four studies: −26.25 m/sMHz). See Table II. Two main differences between the present in vivo experiment and previous in vitro experiments may account for part or all of this disparity. First, pores in the cancellous bone frame in vivo are filled with marrow rather than water. Second, the present in vivo experiment was performed on living women while the previous in vitro experiments were performed on calcaneus samples from cadavers. The former are likely to have had lower-porosity bone.
Table II.
Estimates of dispersion rate in human calcaneus from Wear (2000), Nicholson et al. (1996, Table 1), Strelitzki and Evans, (1996, Table 2), Droin, Berger, and Laugier (1998, Table 1), and the present paper.
| Author(s) | n | Frequency Range (kHz) |
Age Range (years) |
Dispersion rate (mean ± standard deviation) (m/sMHz) |
|
|---|---|---|---|---|---|
| Nicholson et al. | in vitro | 70 | 200 - 800 | 22 - 76 | −40 |
| Strelitzki and Evans | in vitro | 10 | 600 - 800 | unknown | −32 ± 27 |
| Droin et al. | in vitro | 15 | 200 - 600 | 69 - 89 | −15 ± 13 |
| Wear (2000) | in vitro | 24 | 200 - 600 | unknown | −18 ± 15 |
| Wear (present paper) | in vivo | 73 | 300 - 600 | 21 - 78 | −59 ± 52 |
The stratified model was employed to investigate differences in phase velocity and dispersion between the in vivo and in vitro measurements. The stratified model is illustrated in Figure 1. Two homogeneous materials are arranged in alternating layers. Each material is characterized by its density, ρ, and its first and second Lamé constants, λ and μ. The widths of the alternating layers are denoted by h1 and h2. The width of the periodic unit is h = h1 + h2 and is assumed to be small relative to the wavelength. The structural periodicity imposes periodic conditions on the solution to the wave equation. Thus velocities and pressures at a location z are the same as those at z + nh where n is an integer. Continuity of velocities and pressures is also assumed at layer boundaries.
For plane wave propagation perpendicular to the planar interfaces between adjacent layers, the dispersion relation for the longitudinal wave is given by (Brekhovskikh, 1980)
| (4) |
where k1 = ω/ c1, k2 = ω/ c2,
| (5) |
and the phase velocity of the longitudinal wave for propagation perpendicular to the layers is given by czz = ω/ξ where ω=2 πf and f is the frequency of the wave. The right hand side of Equation (5) may be computed from the structural and material properties of the two media. After taking an inverse cosine and dividing by h, ξ is obtained. Phase velocity is then computed from czz = ω/ξ.
The stratified model requires assumptions for values of structural and material parameters of the fluid filler (marrow in vivo or water in vitro) and the bone trabeculae. The structural parameters (h1 and h2) were taken from micro-architectural analysis of 60 human calcanea (Ulrich et al., 1999). The lattice spacing h = h1 + h2 was taken to be 811 microns, which is the sum of the mean values for trabecular separation (Tb.Sp = 684 μm) and trabecular thickness (Tb.Th = 127 μm) in human calcaneus. Three values for the ratio of bone volume to total volume, BV/TV = h1 / (h1 + h2), were used: 0.083, 0.117, and 0.150. These values correspond to the mean plus or minus one standard deviation for BV/TV measured from microCT analysis of human calcaneus (Ulrich et al., 1999). BV/TV = 1 – porosity. The layer thicknesses were obtained from h1 = h * BV/TV and h2 = h – h1.
The material parameters for marrow were obtained as follows. Generally speaking, marrow may contain both hematopoietic and adipose constituents. The relative proportion of adipose increases with age, however, and the conversion of marrow from hematopoietic to adipose in calcaneus is nearly complete by the age of 20 (Christy, 1981; Les et al., 2002). Therefore, material properties for marrow were assigned to values for fat, which were obtained from the material properties library from Wave 2000 Pro ® software (Cyberlogic, New York, NY).
Figure 6 shows stratified model predictions for phase velocity vs. frequency in cancellous bone assuming four different sets of material parameters for the trabecular material—obtained from Grenoble et al. (1972), Cowin et al. (1989), and Luo et al. (1999). The four different parameter sets yield similar phase velocity curves, all with negative dispersion. The stratified models underestimate phase velocity at 500 kHz, however, by about 35 m/s. The parameters from Cowin (1999) were used to generate phase velocity predictions given below. Table III shows values assumed for all structural and material parameters.
Figure 6.
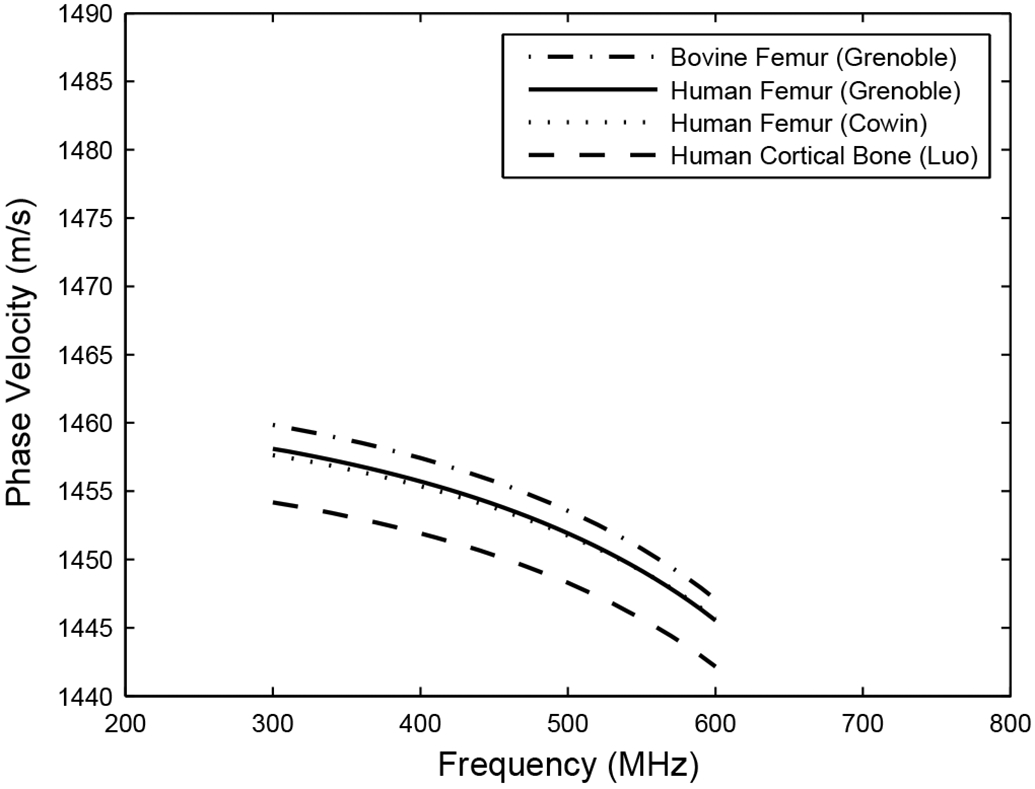
Stratified model predictions for phase velocity assuming four different sets of material parameters for bone trabeculae.
Table III.
Material and structural properties used as inputs for the stratified model. Material parameters for bone were taken from Cowin (1989). Structural parameters for bone were taken from Ulrich (1999). Material parameters for water and marrow (i.e. fat) were taken from the material properties library Wave 2000 Pro software (Cyberlogic, New York, NY) and Kaye and Laby (1973).
| Bone trabeculae | Water | Marrow | |
|---|---|---|---|
| Density (kg/m3) | 1850 | 1000 | 1055 |
| Longitudinal velocity (m/s) | 3260 | 1482 (at 20°C) | 1479 |
| Transverse velocity (m/s) | 1644 | 3.5 | 34.5 |
| First Lamé constant (λ) (MPa) | 9700 | 2241 | 2050 |
| Second Lamé constant (μ) (MPa) | 5000 | 0 | 0 |
| Bone Volume Fraction (BV/TV) (%) | 11.65 ± 3.33 | - | - |
| Lattice spacing: h = h1 + h2 (μm) | 811 | - | - |
Figure 7 shows the stratified model prediction of the effect of changing the fluid filler from water (in vitro) to marrow (in vivo). Phase velocity at 500 kHz drops by 14 m/s. This drop can explain about two thirds of the difference in phase velocity at 500 kHz previously reported in vitro, 1511 m/s (Wear, 2000), with the value reported here in vivo, 1489 m/s. Other investigators have also measured velocity to be lower when marrow is present. Nicholson and Bouxsein (2002) observed about twice as much reduction in phase velocity at 600 kHz, 43 m/s, in human calcaneus samples in vitro. Alves et al. (1996) observed a reduction of SOS at 500 kHz of 35 m/s, while Hoffmeister et al. (2002) found no significant difference at 2.25 MHz, in bovine cancellous bone in vitro.
Figure 7.
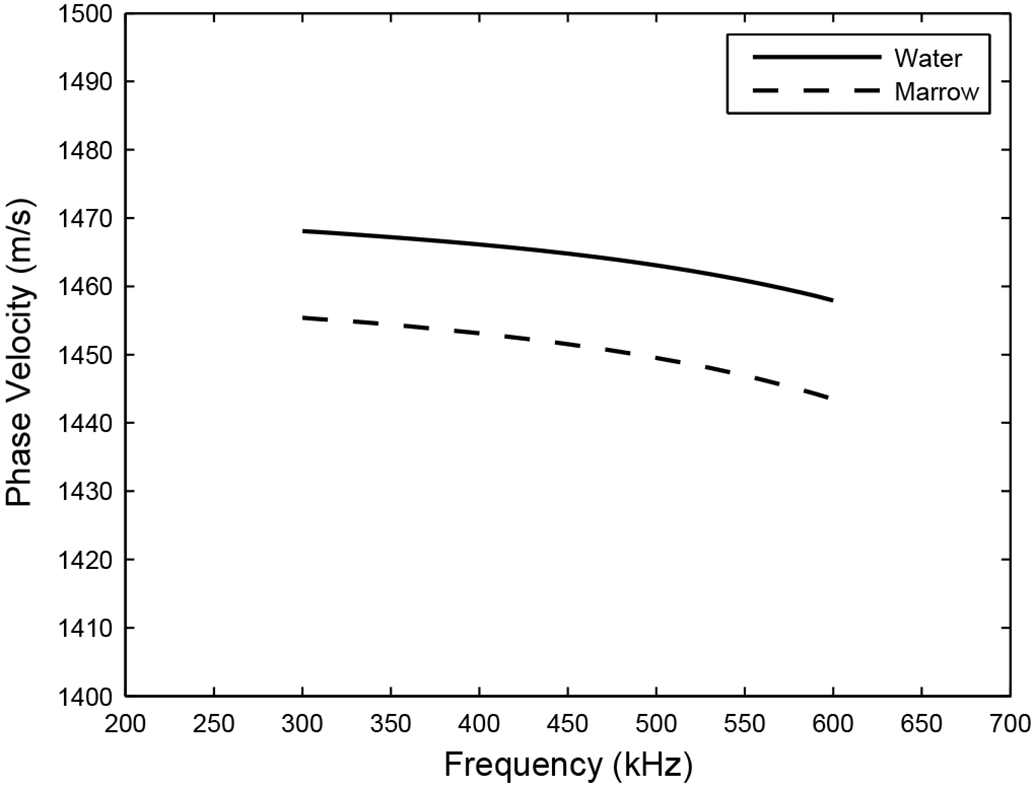
Stratified-model predictions for phase velocity in cancellous bone based on two options for the fluid filler: water (in vitro experiments) and marrow (in vivo experiments).
Figure 7 shows that dispersion rate (obtained from least-squares linear regression fits to the curves in Figure 7) drops from −33 m/sMHz to −38 m/sMHz. Therefore, replacing water with marrow can be expected to reduce the dispersion rate by an amount on the order of 5 m/sMHz.
Figure 8 shows stratified model predictions for BV/TV values equal to the mean plus or minus one standard deviation for values reported by Ulrich et al. (1999) for human calcaneus. This analysis is relevant because it is plausible that the living human subjects in the current in vivo study tended to have higher BV/TV (i.e. lower porosity) than the cadaveric calcaneus specimens in the in vitro studies. Figure 8 shows that each reduction of BV/TV by one standard deviation is accompanied by a reduction in dispersion rate of about 25 m/sMHz. Therefore, a presumed lower porosity (i.e. higher BV/TV) of younger, living bone would help explain measurements of steeper negative dispersion. (This is consistent with the fact that Nicholson et al., whose test population had an unusually high representation of young women, measured the steepest negative dispersion among the four in vitro studies. See Table II.)
Figure 8.
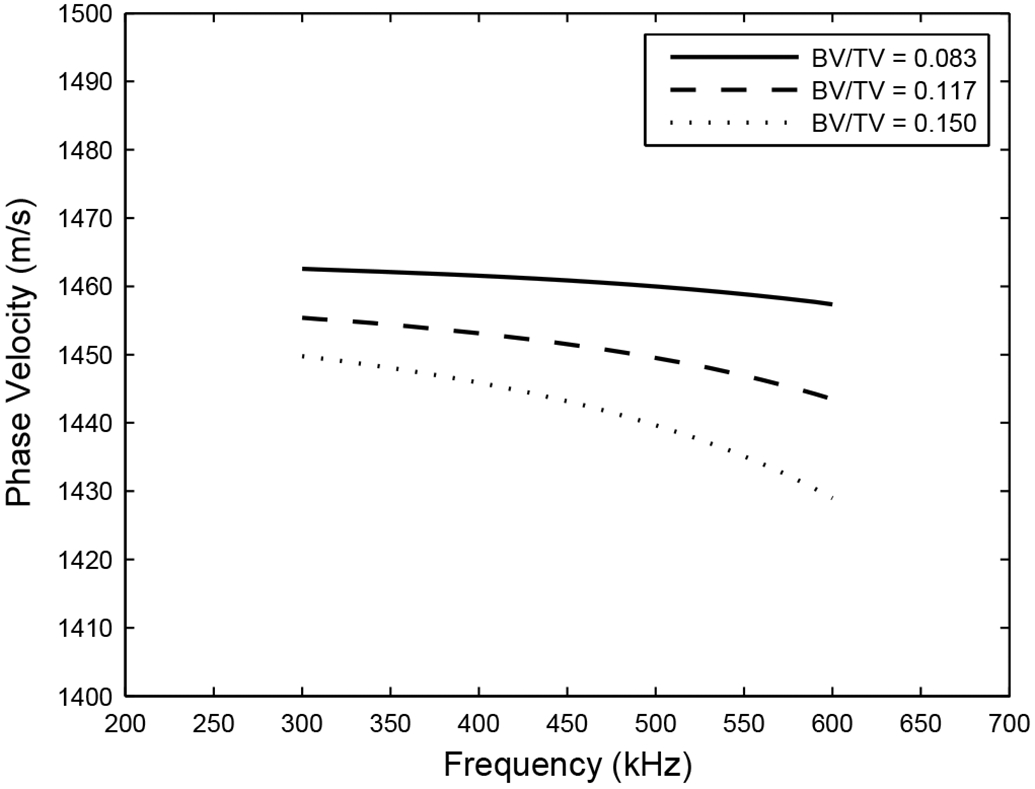
Stratified-model predictions for phase velocity in cancellous bone as a function of ratio of bone volume to total volume (BV/TV). The values for BV/TV shown correspond to the mean ± one standard deviation for BV/TV reported in human calcaneus (Ulrich et al, 1999).
Conclusion
This study represents the first large-scale investigation of calcaneal dispersion in vivo. Negative dispersion, previously reported in human calcaneal cancellous bone samples in vitro, is also exhibited in vivo. Phase velocity is lower, and dispersion rate is more negative, in calcanea from women in vivo than in cancellous bone samples in vitro. Although the stratified model tends to underestimate phase velocity at 500 kHz by about 35 m/s, it is useful for predicting dispersion, and for quantitatively explaining the differences in phase velocity and dispersion between in vivo and in vitro measurements.
Acknowledgements
The author is grateful for funding provided by the US Food and Drug Administration Office of Women’s Health. The author is grateful to Rich Morris, General Electric Corporation, Madison, WI, for providing the custom radio frequency interface for the GE Achilles. The mention of commercial products, their sources, or their use in connection with material reported herein is not to be construed as either an actual or implied endorsement of such products by the Department of Health and Human Services.
References
- Alves JM, Ryaby JT, Kaufman JJ, Magee FP, and Siffert RS, (1996), “Influence of marrow on ultrasonic velocity and attenuation in bovine trabecular bone,” Calcif. Tissue Int, 58, 362–367. [DOI] [PubMed] [Google Scholar]
- Bauer DC, Gluer CC, Cauley JA, Vogt TM, Ensrud KE, Genant HK, and Black DM, (1997) “Broadband ultrasound attenuation predicts fractures strongly and independently of densitometry in older women,” Arch. Intern, Med 157, 629–634. [PubMed] [Google Scholar]
- Bouxsein ML, and Radloff SE. (1997), “Quantitative ultrasound of the calcaneus reflects the mechanical properties of calcaneal trabecular bone,” J. Bone Miner. Res. 12, pp. 839–846. [DOI] [PubMed] [Google Scholar]
- Brekhovskikh LM, (1980), Waves in Layered Media, Academic Press, New York, p. 81. [Google Scholar]
- Bruggeman DAG (1935), “Berechnung verschiedener physikalischer Konstanten von heterogenen Substanzen (Calculation of physical constants from heterogeneous substances),” Ann. Phys. (Leipzig), 24, 636–664. [Google Scholar]
- Chaffai S, Peyrin F, Nuzzo S Porcher R, Berger G, and Laugier P, (2002), “Ultrasonic characterization of human cancellous bone using transmission and backscatter measurements: relationships to density and microstructure,” Bone, 30, 229–237. [DOI] [PubMed] [Google Scholar]
- Chen P and Chen T (2006), “Measurements of acoustic dispersion on calcaneus using split spectrum processing technique,” Med. Eng. & Phys 28, 187–193. [DOI] [PubMed] [Google Scholar]
- Christy M (1981), “Active bone marrow distribution as a function of age in humans,” Phys. Med. Biol, 26, 389–400. [DOI] [PubMed] [Google Scholar]
- Cowin SC, (1989), “The mechanical properties of cortical bone” in Bone mechanics, Cowin SC (Ed.), CRC Press, Boca Ratorn, FL, 97–127. [Google Scholar]
- Droin P, Berger G and Laugier P, (1998), “Velocity dispersion of acoustic waves in cancellous bone.” IEEE Trans. Ultrason. Ferro. Freq. Cont 45, 581–592. [DOI] [PubMed] [Google Scholar]
- Glüer CC, Cummings SR, Bauer DC, Stone K, Pressman A, Mathur A, and Genant HK (1996), “Osteoporosis: Association of recent fractures with quantitative US findings,” Radiology, 199, 725–732. [DOI] [PubMed] [Google Scholar]
- Glüer CC, Eastell R, Reid DM, Felsenbert D, Roux C, Barkmann R, Timm W, Blenk T, Armbrecht G, Stewart A, Clowes J, Thomasius FE, and Kolta S, (2004), “Association of five quantitative ultrasound devices and bone densitometry with osteoporotic vertebral fractures in a population-based sample: the OPUS study,” J. Bone Miner. Res, 19, 782–793. [DOI] [PubMed] [Google Scholar]
- Grenoble DE, Katz JL, Dunn KL, Gilmore RS, and Lingamurty K (1972), “The elastic properties of hard tissues and apatites,” J. Biomed. Mater. Res, 6, 221–233. [DOI] [PubMed] [Google Scholar]
- Hans D, Dargent-Molina P, Schott AM, Sebert JL, Cormier C, Kotzki PO, Delmas PD, Pouilles JM, Breart G, and Meunier PJ (1996), “Ultrasonographic heel measurements to predict hip fracture in elderly women: the EPIDOS prospective study,” Lancet, 348, 511–514. [DOI] [PubMed] [Google Scholar]
- Hans D, Wu C, Njeh CF, Zhao S, Augat P, Newitt D, Link T, Lu Y, Majumdar S, and Genant HK (1999), “Ultasound velocity of cancellous cubes reflects mainly bone density and elasticity,” Calcif. Tissue Intl. 64, 18–23. [DOI] [PubMed] [Google Scholar]
- Hoffmeister BK, Whitten SA, and Rho JY, (2000), “Low-megahertz ultrasonic properties of bovine cancellous bone,” Bone, 26, 635–642. [DOI] [PubMed] [Google Scholar]
- Hoffmeister BK Whitten SA, Kaste SC and Rho JY, (2002), “Effect of collagen and mineral content on the high-frequency ultrasonic properties of human cancellous bone,” Osteo. Int’l, 13, 26–32. [DOI] [PubMed] [Google Scholar]
- Hoffmeister BK, Auwarter JA, and Rho JY, (2002), “Effect of marrow on the high frequency ultrasonic properties of cancellous bone,” Phys. Med. Biol, 47, 3419–3427. [DOI] [PubMed] [Google Scholar]
- Hughes ER, Leighton TG, Petley GW, and White PR, (1999), “Ultrasonic propagation in cancellous bone: a new stratified model,” Ultrason. Med. Biol, 25, 881–821. [DOI] [PubMed] [Google Scholar]
- Kaye GWC, and Laby TH (1973), Table of Physical and Chemical Constants. London, UK: Longman. [Google Scholar]
- Kaufman JJ, Xu W, Chiabrera AE, and Siffert RS, (1995), “Diffraction effects in insertion mode estimation of ultrasonic group velocity,” IEEE Trans. Ultrason. Ferroelectr. Freq. Cont, 42, 232–242. [Google Scholar]
- Laugier P, Droin P, Laval-Jeantet AM, and Berger G (1997), “In vitro assessment of the relationship between acoustic properties and bone mass density of the calcaneus by comparison of ultrasound parametric imaging and quantitative computed tomography,” Bone. 20, 157–165. [DOI] [PubMed] [Google Scholar]
- Laugier P, (2004), “An overview of bone sonometry,” International Congress Series, 1274, 23–32. [Google Scholar]
- Lee KI, Roh H, and Yoon SW (2003), “Acoustic wave propagation in bovine cancellous bone: Application of the modified Biot-Attenborough model,” J. Acoust. Soc. Am, 114, 2284–2293. [DOI] [PubMed] [Google Scholar]
- Lee KI and Yoon SW, (2006), “Predictions of the stratified model for the dependence of phase velocity on microarchitectural parameters and porosity in trabecular bone,” Proc. WESPAC IX, Seoul, South Korea. [Google Scholar]
- Les CM, Whalen RT, Beaupre GS, Yan CH, Cleek TM, Wills JS (2002), “The x-ray attenuation characteristics and density of human calcaneal marrow do not change significantly during adulthood,” J. Ortho. Res, 20, 633–641. [DOI] [PubMed] [Google Scholar]
- Luo G Kaufman JJ, Chiabrera AE, Bianco B, Kinney JH, Haupt D, Ryaby JT and Siffert RS, (1999), “Computational methods for ultrasonic bone assessment,” Ultrasound Med. Biol, 25, 823–830. [DOI] [PubMed] [Google Scholar]
- Marutyan KR, Holland MR and Miller JG (2006a), “Anomalous negative dispersion in bone can result from the interference of fast and slow waves,” J. Acoust. Soc. Am, 120, EL55–EL61. [DOI] [PubMed] [Google Scholar]
- Marutyan KR, Bretthorst GL, and Miller JG (2006b), “Bayesian estimation of the underlying bone properties from mixed fast and slow mode ultrasonic signals,” J. Acoust. Soc. Am, 121, EL8 – EL15. [DOI] [PubMed] [Google Scholar]
- Mobley J Waters KR and Miller JG (2003), “Finite-bandwidth effects on the causal prediction of ultrasonic attenuation of the power-law form,” J. Acoust. Soc. Am. 114, 2782–2790. [DOI] [PubMed] [Google Scholar]
- Morse PM and Ingard KU (1986), Theoretical Acoustics. Princeton, NJ. Princeton University Press, chapter 9. [Google Scholar]
- Nicholson PHF, Lowet G, Langton CM, Dequeker J, and Van der Perre G, (1996), “Comparison of time-domain and frequency-domain approaches to ultrasonic velocity measurements in trabecular bone,” Phys. Med. Biol, 41, 2421–2435. [DOI] [PubMed] [Google Scholar]
- Nicholson PHF, Lowet G, Cheng XG, Boonen S, Van der Perre G, and Dequeker J (1997), “Assessment of the strength of the proximal femur in vitro: relationship with ultrasonic measurements of the calcaneus,” Bone, 20, 219–224. [DOI] [PubMed] [Google Scholar]
- Nicholson PHF, Muller R, Lowet G, Cheng XG, Hildebrand T, Ruegsegger P Van Der Perre G, Dequeker J, and Boonen S (1998), “Do quantitative ultrasound measurements reflect structure independently of density in human vertebral cancellous bone?,” Bone. 23, 425–431. [DOI] [PubMed] [Google Scholar]
- Nicholson PHF, and Bouxsein ML, “Bone marrow influences quantitative ultrasound measurements in human cancellous bone,” (2002), Ultrasound Med. & Biol, 28, 369–375. [DOI] [PubMed] [Google Scholar]
- Njeh CF, Hodgskinson R, Currey JD, and Langton CM (1996) “Orthogonal relationships between ultrasonic velocity and material properties of bovine cancellous bone,” Med. Eng. Phys, 18, 373–381. [DOI] [PubMed] [Google Scholar]
- O’Donnell M, Jaynes ET, and Miller JG (1981), “Kramers-Kronig relationship between ultrasonic attenuation and phase velocity.” J. Acoust. Soc. Am, 69, 696–70. [Google Scholar]
- Padilla F, and Laugier P, (2000), “Phase and group velocities of fast and slow compressional waves in trabecular bone,” J. Acoust. Soc. Am, 108, 1949–1952. [DOI] [PubMed] [Google Scholar]
- Plona TJ, Winkler KW, and Schoenberg M, (1987), “Acoustic waves in alternating fluid/solid layers,” J. Acoust. Soc. Am. 81, 1227–1234. [Google Scholar]
- Postma GW(1955), “Wave propagation in a stratified medium.” Geophysics, 20, 80. [Google Scholar]
- Rossman P, Zagzebski J, Mesina C, Sorenson J, and Mazess R,, (1989). “Comparison of Speed of Sound and Ultrasound Attenuation in the Os Calcis to Bone Density of the Radius, Femur and Lumbar Spine,” Clin. Phys. Physiol.Meas, 10, 353–360. [DOI] [PubMed] [Google Scholar]
- Riznichenko YV (1949), “Propagation of seismic waves in discrete and heterogeneous media,” Izv. Akad.. Nauk SSSR, Ser. Geogr. Geofiz, 13, 115. [Google Scholar]
- Rytov SM (1956), “Acoustical properties of a finely layered medium,” Akust. Zh., 2, 71, Sov. Phys – Acoust., 2, 67–80. [Google Scholar]
- Schott M, Weill-Engerer S, Hans D, Duboeuf F, Delmas PD, and Meunier PJ, (1995), “Ultrasound discriminates patients with hip fracture equally well as dual energy X-ray absorptiometry and independently of bone mineral density,” J. Bone Min. Res, 10, 243–249. [DOI] [PubMed] [Google Scholar]
- Strelitzki R, and Evans JA, (1996), “On the measurement of the velocity of ultrasound in the os calcis using short pulses,” Eur. J. Ultrasound, 4, 205–213. [Google Scholar]
- Strelitzki R, Evans JA, and Clarke AJ, (1997), “The influence of porosity and pore size on the ultrasonic properties of bone investigated using a phantom material,” Osteo. Int, 7, 370–375. [DOI] [PubMed] [Google Scholar]
- Tarkov AG (1940), “The problem of the anisotropy of elastic properties in rocks,” Mater. Vses. N.-I. Geol. In-ta Obshch. Seriya. Sb. 5, 209. [Google Scholar]
- Tavakoli MB and Evans JA (1991) “Dependence of the velocity and attenuation of ultrasound in bone on the mineral content,” Phys. Med. Biol, 36, 1529–1537. [DOI] [PubMed] [Google Scholar]
- Thompson P, Taylor J, Fisher A, and Oliver R,, (1998), “Quantitative heel ultrasound in 3180 women between 45 and 75 years of age: compliance, normal ranges and relationship to fracture history,” Osteo. Int’l, 8, 211–214. [DOI] [PubMed] [Google Scholar]
- Trebacz H and Natali A (1999). “Ultrasound velocity and attenuation in cancellous bone samples from lumbar vertebra and calcaneus,” Osteo. Int’l, 9, 99–105. [DOI] [PubMed] [Google Scholar]
- Turner H, Peacock M, Timmerman L, Neal JM, and Johnston CC Jr., (1995), “Calcaneal ultrasonic measurements discriminate hip fracture independently of bone mass,” Osteo. International, 5, 130–135. [DOI] [PubMed] [Google Scholar]
- Ulrich D, van Rietbergen B, Laib A, and Rüegsegger P, (1999). “The ability of three-dimensional structural indices to reflect mechanical aspects of trabecular bone,” Bone, 25, 55–60. [DOI] [PubMed] [Google Scholar]
- Waters KR, Hughes MS, Mobley J, Brandenburger GH, and Miller JG, (2000), “On the applicability of Kramers-Kronig relations for ultrasonic attenuation obeying a frequency power law,” J. Acoust. Soc. Am, 108, 556–563. [DOI] [PubMed] [Google Scholar]
- Waters KR, Hoffmeister BK, (2005), “Kramers-Kronig analysis of attenuation and dispersion in trabecular bone,” J. Acoust. Soc. Am, 118, 3912–3920. [DOI] [PubMed] [Google Scholar]
- Wear KA (2000), “Measurements of phase velocity and group velocity in human calcaneus,” Ultrason. Med. Biol, 26, 641–646. [DOI] [PMC free article] [PubMed] [Google Scholar]
- Wear KA (2001), “A stratified model to predict dispersion in trabecular bone,” IEEE Trans. Ultrason. Ferro. Freq. Cont, 48, 1079–1083. [DOI] [PMC free article] [PubMed] [Google Scholar]
- Yamoto Y, Matsukawa M, Otani T, Yamazaki K, and Nagano A, (2006), “Distribution of longitudinal wave properties in bovine cortical bone in vitro,” Ultrasonics, 44, e233 – e237. [DOI] [PubMed] [Google Scholar]
- Zagzebski JA, Rossman PJ, Mesina C, Mazess RB, and Madsen EL, (1991) “Ultrasound transmission measurements through the os calcis,” Calcif Tissue Int. 49, 107–111. [DOI] [PubMed] [Google Scholar]


