

Abstract
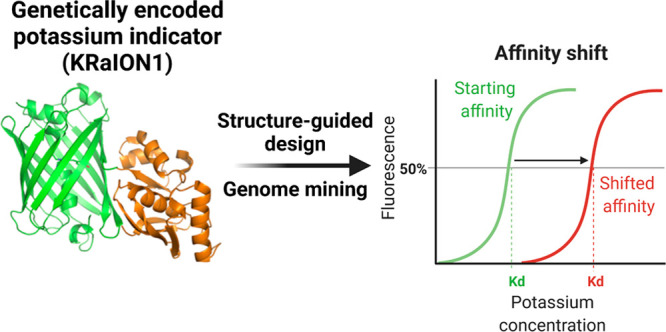
Genetically encoded potassium indicators lack optimal binding affinity for monitoring intracellular dynamics in mammalian cells. Through structure-guided design and genome mining of potassium binding proteins, we developed green fluorescent potassium indicators with a broad range of binding affinities. KRaION1 (K+ ratiometric indicator for optical imaging based on mNeonGreen 1), based on the insertion of a potassium binding protein, Kbp, from E. coli (Ec-Kbp) into the fluorescent protein mNeonGreen, exhibits an isotonically measured Kd of 69 ± 10 mM (mean ± standard deviation used throughout). We identified Ec-Kbp’s binding site using NMR spectroscopy to detect protein–thallium scalar couplings and refined the structure of Ec-Kbp in its potassium-bound state. Guided by this structure, we modified KRaION1, yielding KRaION1/D9N and KRaION2, which exhibit isotonically measured Kd’s of 138 ± 21 and 96 ± 9 mM. We identified four Ec-Kbp homologues as potassium binding proteins, which yielded indicators with isotonically measured binding affinities in the 39–112 mM range. KRaIONs functioned in HeLa cells, but the Kd values differed from the isotonically measured case. We found that, by tuning the experimental conditions, Kd values could be obtained that were consistent in vitro and in vivo. We thus recommend characterizing potassium indicator Kd in the physiological context of interest before application.
Keywords: potassium sensor, protein engineering, rational design, NMR structure, genome mining, fluorescent protein
Potassium ions serve key physiological roles in a range of cells and systems, including neurons and glia,1−6 cardiomyocytes,7 and renal cells,8,9 and potassium homeostasis is dysregulated in conditions including seizures, immune cell impairment, and ischemic events.10−12 Potassium concentration in cells, tissues, and organisms has been measured using electrodes or dyes.13−15 Recent attention has focused on genetically encoded fluorescent indicators because they could be targeted to specific cells.16
The potassium binding protein, Kbp, from E. coli (here E. coli-Kbp or Ec-Kbp for short) undergoes large conformational changes during potassium binding. Ec-Kbp consists of ∼150 amino acids forming two domains, LysM (lysin motif) and BON (bacterial OsmY and nodulation), and binds to one potassium ion.17 When binding occurs, Ec-Kbp’s conformational change brings the two domains closer together and orders the N-terminus such that it lies close to the C-terminus. However, Ec-Kbp’s binding site was not previously identified.17 The conformational change behavior parallels that of calmodulin and M13 in commonly used genetically encoded calcium indicators. Ec-Kbp’s conformational change makes it a good candidate for incorporation into genetically encoded sensors, particularly using split-fluorescent proteins, as used in the calcium indicator NCaMP7.18
The protein engineering community has used Ec-Kbp to develop genetically encoded K+ sensors. Two FRET sensors, GEPII 1.0 and KIRIN1, and a single-fluorescent protein K+ sensor, GINKO1, have been published.19,20 These sensors change fluorescence emission upon K+ binding, and although they have been used to measure K+ concentration in solution and cell culture, their binding affinities for K+ are not appropriate for accurate measurements of intracellular potassium concentrations (previously reported Kd values range from 0.40 to 2.6 mM), whereas textbook measurements of K+ concentrations are ∼140–150 mM for mammalian cells at resting potential.21,22 Extracellular K+ concentrations can fluctuate up to 30–80 mM in events of sustained neuron depolarization.23−25 In glia, intracellular K+ concentration can increase up to ∼60% during potassium concentration regulation.26,27 Without the ability to measure K+ dynamically in a cell-specific way, we will not understand K+ dynamics in different cell types in healthy and disease states. Our goal was to design and generate intracellularly expressed potassium sensors sensitive to changes in K+ comparable to those found in the intracellular milieu.
We report a family of green potassium indicators generated via two approaches. One approach was based on knowledge of the Ec-Kbp K+ binding site identified by NMR, while the second approach consisted of identifying and using alternative potassium binding proteins as sensing moieties. Guided mutagenesis was used to tune the indicator mNeonGreen (mNG)-Ec-Kbp’s Kd, yielding two mutants with isotonically measured binding affinities to K+ in the range of 96–138 mM and fluorescence dynamic ranges of ∼200% over the range of 0.1–150 mM K+. The identification of previously unannotated proteins from metagenomic databases that share 45–72% amino acid identity with Ec-Kbp and fusing these to mNeonGreen yielded indicators with isotonically measured K+ binding affinities ranging from 39 to 112 mM and fluorescence dynamic ranges of up to ∼200% over the range of 0.1–150 mM K+. The indicators generated are ratiometric by excitation. When expressed in HeLa cells that were permeabilized with valinomycin and CCCP ionophores, all tested indicators had Kd values below those measured in isotonic conditions in vitro. Thus, Kd could vary depending on the conditions used for its measurement.28 These indicators thus may be regarded as remaining in the prototype stage, as discrepancies in binding affinities require thoughtful consideration of how Kd is affected by cellular and environmental contexts. Future work is needed to identify the proper calibration conditions in each cell type of interest for the indicators described here and elsewhere.
Results and Discussion
Development of a Genetically Encoded Green Potassium Sensor
We used a design approach based on the insertion of the sensing moiety into a fluorescent protein as has been done with other indicators for calcium: ncpGCaMP6s, NTnC, and NCaMP7.18,29,30 NCaMP7, which contains mNG as a green fluorescent reporter, is 1.7-fold brighter than the calcium indicator GCaMP6s16 and has a maximum ΔF/F of 2700%. Our potassium indicator design used NCaMP7 as a template, as mNG is brighter than other characterized monomeric GFP proteins31 and the design allows for direct insertion of the binding domain into the fluorescent protein.
We replaced NCaMP7’s binding moiety with Ec-Kbp while preserving the original amino acid linkers between the fluorescent protein and the binding domain (Figure 1a,b). We performed detailed characterization of mNG-Ec-Kbp’s spectroscopic and biochemical properties at 0 and 150 mM under isotonic conditions (Table 1). The absorbance spectrum of mNG-Ec-Kbp shows two peaks at 408 and 508 nm that decrease and increase upon potassium administration, respectively (Figure 1c).32 Correspondingly, mNG-Ec-Kbp’s excitation fluorescence spectrum has two peaks at 407 and 507 nm, which result in identical emission maximums at 518 nm (Figure 1d). mNG-Ec-Kbp’s extinction coefficient (EC) ratio was 65 300/12 000 M–1cm–1 when excited at 408/507 at 0 mM K+ and 45 600/23 200 M–1cm–1 when excited at 407/507 at 150 mM K+. The corresponding quantum yields (QYs) obtained at 0 and 150 mM K+ when excited at 407/507 nm were 35/26% and 29/57%, respectively (Table 1). Therefore, upon potassium administration, the fluorescence excited at 507 nm increases due to both increasing QY and EC, while fluorescence excited at 407 nm decreases due to both decreasing QY and EC, confirming mNG-Ec-Kbp as a ratiometric indicator, which we named KRaION1: K+ ratiometric indicator for optical imaging based on mNeonGreen 1.
Figure 1.

Molecular design and properties of the genetically encoded green potassium indicator KRaION1 in solution. (a) Molecular design of the KRaION1 indicator. (b) The proposed structure of KRaION1 shown as a ribbon diagram according to the crystal structure of NCaMP7 (PDB: 6XW2) and NMR structure of the Ec-Kbp domain (PDB: 5FIM). (c) Absorbance spectra of KRaION1 at 0 and 150 mM potassium at pH = 7.4. (d) Fluorescence spectra of KRaION1 at 0 and 150 mM potassium at pH = 7.4. (e) Relative fluorescence intensity of KRaION1 at 0 and 150 mM potassium as a function of pH. (f) Fluorescence changes upon addition of 150 mM potassium as a function of pH at constant ionic strength. (g) Potassium association using stopped-flow fluorimetry. Association kinetics curves were acquired at a 40 mM final K+ concentration starting from K-free protein solution. Inset: the same association kinetics curve shown in the range of the 0–300 ms time frame. (h) Selectivity of KRaION1 to K+ and other cations represented as ΔF/F % measured by titration of Li+, Na+, K+, Rb+, Cs+, NH4+, Mg2+, Ca2+, and Zn2+. Calculated fluorescence was obtained at the highest expected intracellular concentration for each ion. (i) Fluorescent dynamic range and EC50 of KRaION1 measured in the range of 0–260 mM K+. (j) Potassium titration data points (open circles) measured at pH = 7.3 and constant ionic strength of 700 mM, fitted using Q = (Qmax – Q0)Y + Q0 function (green line).
Table 1. Spectral and Biochemical Properties of Green Fluorescence Potassium Sensors in Solution and in Cellsa.
| GINKO1 |
KRaION1 |
KRaION1/D9N |
KRaION2 |
|||||
|---|---|---|---|---|---|---|---|---|
| 0 mM K+ | 150 mM K+ | 0 mM K+ | 150 mM K+ | 0 mM K+ | 150 mM K+ | 0 mM K+ | 150 mM K+ | |
| absorbance (nm) | 399/501 | 400/500 | 407/509 | 407/509 | 409/508 | 407/506 | 402/508 | 404/508 |
| excitation (nm) | 399/500 | 399/500 | 408/507 | 407/507 | 406/506 | 407/504 | 403/506 | 405/506 |
| emission (nm) | 514 | 515 | 519 | 518 | 517 | 517 | 516 | 517 |
| extinction coefficient (M–1 cm–1) | 47 000/19 000 | 46 000/28 000 | 65 300/12 000 | 45 600/23 200 | 42 300/23 700 | 40 300/20 200 | 58 400/9300 | 47 400/26 100 |
| quantum yield (%) | n.d. | 7.7/59 | 35/26 | 29/57 | 28/14 | 23/47 | 26/23 | 29/61 |
| pKa | 7.5 | 7.3 | 7.7 | 7.4 | 7.7 | 7.3 | 7.7 | 7.1 |
| GINKO1 | KRaION1 | KRaION1/D9N | KRaION2 | |
|---|---|---|---|---|
| Kd (mM)b | 17 ± 7 | 69 ± 10 | 138 ± 21 | 96 ± 9 |
| Kd (mM)c | 21 ± 10 | 42 ± 10 | 100 ± 6 | 66 ± 9 |
| τfast/τslow (ms)d | 34(85%)/54 | 31(55%)/71 | 37(69%)/1211 | 26(60%)/890 |
| ΔF/Fmax (%)e | 29 | 302 | 434 | 318 |
| ΔR/Rmax (%)f | n.d. | 755 ± 88 | 1112 ± 160 | 943 ± 310 |
| intracellular Kd (mM)g | n.d. | 37 ± 9 | 95 ± 21 | 58 ± 6 |
Kd was calculated using the same equation used for in vitro calculations of Kd. n.d. stands for not determined.
K+ titration was conducted in isotonic conditions in a range of 0.1–700 mM K+.
K+ titration was conducted at constant 5 mM Na+ with an increasing concentration of 0.1–250 mM K+. The equation used to fit the titration data and obtain Kd is Q = (Qmax – Q0)Y + Q0.
τfast and τslow indicate time constants with the fluorescence trace fit according to ΔF/F(t) = Ae–t/τfast + Be–t/τslow + C with the percentage indicating A/(A + B).
Fluorescence dynamic range (ΔF/Fmax) values represent the percent max fluorescence change within the range of 0.1–700 mM K+.
Dynamic range of the excitation fluorescence ratio measured in live HeLa cells calibrated with valinomycin and CCCP within the range of 0–150 mM K+.
Intracellular characterization of Kd measured in HeLa cells calibrated with valinomycin and CCCP in the range of 0–150 mM K+.
We assessed the pH sensitivity of KRaION1, which exhibits a large fluorescence change in response to 150 mM K+ within the pH range of 7–8. The maximum dynamic range (ΔF/F) of 332% was seen at pH 7.5 (Figure 1e,f). Outside this range, the fluorescence response of the indicator decreased. This suggests KRaION1 would be sensitive to fluctuations in pH, as seen for other single fluorescent protein-based indicators.18,29,30 Monitored at pH = 7.4, KRaION1 displayed a fluorescence response upon binding K+ (at final [K+] = 40 mM) that was biexponential with time constants of τfast = 31 ms (55% of total amplitude) and τslow = 71 ms (remaining amplitude) (Figure 1g). Possible explanations for this include: at the single molecule level, potassium binding to Ec-Kbp’s binding pocket is fast, but the previously described17 conformational rearrangement of the protein is slow; alternatively, there could be two KRaION1 populations: one that can fold rapidly after potassium binding, and another that has to overcome a significant energy barrier to fold. KRaION1’s association kinetics response is comparable to that of GINKO1 under identical conditions, characterized by τfast = 34 ms (85% of total amplitude) and τslow = 54 ms (remaining amplitude). The fluorescence response of KRaION1 is about 3-fold faster than NCaMP7, perhaps due to the faster association kinetics of potassium ions with Ec-Kbp.
We also assessed KRaION1’s ion selectivity by measuring fluorescence changes obtained from titrations with the following ions: Li+, Na+, Rb+, Cs+, NH4+, Mg2+, Ca2+, and Zn2+ along with K+ (Figure 1h). Only Rb+, which has an ionic radius similar to K+, resulted in significant fluorescence increases of KRaION1. At the highest concentrations seen in mammalian cells,33−39 KRaION1’s ΔF/F % for K+ is the highest at ∼200% relative to all other ions, which remain below 50%. The ΔF/F % response for Li+, Ca2+, and Zn2+ ions increased above 50% only at concentrations that exceed expected intracellular values (Supplementary Figure 1a). Next, we measured KRaION1’s fluorescence response in conditions mimicking intracellular ion compositions40 by increasing potassium concentration until fluorescence reached an apparent plateau. The fluorescence increased to ∼286% of ΔF/F at ∼250 mM K+, and the corresponding EC50 was ∼45 mM (Figure 1i).
KRaION1’s Kd was obtained by fitting the fluorescence response to a single site binding model and was 69 ± 10 mM under isotonic conditions of variable K+ (Figure 1j). For comparison, GINKO1 had a Kd value of 17 ± 7 mM under similar conditions. These Kd values are less useful for the detection of small changes in mammalian cells’ intracellular potassium concentration, so we sought to optimize KRaION1 to achieve a higher Kd. To achieve this, we sought additional information about Ec-Kbp’s ion binding site.
Identification of Ec-Kbp’s Ion Binding Site
We used NMR spectroscopy to locate Ec-Kbp’s ion binding site. In NMR spectroscopy, local chemical shift differences between free and ligand-bound forms of proteins often provide evidence of binding site locations, but this was not feasible for Ec-Kbp due to the extreme line-broadening of many signals in its free form. Evidence for potassium binding site locations can be obtained using 15N-labeled ammonium ions to substitute for K+.41,42 However, Ec-Kbp unfolds at the pHs at which the ammonium 1H signal is distinct from the water 1H signal. Isotopes of potassium are quadrupolar nuclei with modest sensitivity, making them unsuitable for determining protein–ion contacts in solution. Instead, we used thallium(I) as a K+ mimic, allowing the measurement of direct two bond scalar couplings (2J 13C=O···205/203Tl+) (B. O. Smith, in preparation) of around 100 Hz in the HNCO spectrum (Figure 2a) that unambiguously identify the backbone carbonyls of V7 and A10 from loop 1 in Ec-Kbp’s N-terminal extension and G75, I77, and I80 from loop 5, the turn immediately preceding the BON domain’s last β-strand, as Tl+ ligands. We believe this is the first reported observation of scalar (J) coupling between a protein’s 13C enriched carbonyl carbons and a bound thallium ion. The large J couplings observed provide direct and unambiguous evidence of which groups coordinate with the ion. In fact, the variation in J for the different residues suggests the data may contain additional information about the interatomic distances and angles that could be decoded in the future.
Figure 2.

Identification and modification of Ec-Kbp’s potassium binding site. (a) 1H and 13C strips from HNCO spectra of K+ (magenta) and Tl+ (green) bound Ec-Kbp showing the residues whose crosspeaks are split by an additional J coupling in the Tl+ bound form. The black scale bars represent 100 Hz. (b) Refined configuration of the Ec-Kbp ion binding site. The ion is coordinated entirely by backbone carbonyls from loops 1 and 5 (backbone atoms shown as sticks). Sections of the rainbow-colored cartoon of the rest of the protein are visible. Coordinating carbonyl to K+ interactions and the K8 to G79 hydrogen bond are shown as yellow dashed lines. (c) Potassium titration data points for KRaION1 and mutants KRaION1/D9N and KRaION2 (open circles, squares, and triangles, respectively) measured at pH = 7.4 and constant ionic strength, fitted using the equation Q = (Qmax – Q0)Y + Q0 (denoted by a green line, blue line, and magenta line, respectively). (d) Potassium association using stopped-flow fluorimetry. Association kinetics curves were acquired at 40 mM final K+ concentration starting from K-free protein solution. (e) Association kinetics curves in the range of the 0–300 ms time frame.
Refined Structure of Ec-Kbp·K+
To provide an accurate structural model on which to base the mutagenesis of KRaION1’s potassium binding site, we recalculated the Ec-Kbp·K+ structure17 by incorporating a K+ ion restrained to the carbonyl oxygens identified as Tl+ ligands (PDB: 7PVC; Supplementary Table 1). The coordinating carbonyl oxygens were restrained to be between 2.75 ± 0.1 Å of the K+ ion, as suggested by Harding43 without any constraint on the C=O···K+ bond angle. Since the NMR structure calculation software, ARIA2.3/CNS, uses the OPLX force field with explicit TIP3P-like water representation for the water refinement stage,44 we used the parameters for K+ suggested by Mamatkulov and Schwierz.45 The refined structure differs little from the structure calculated without an ion included (Supplementary Figure 2a) but binds K+ between loops 1 and 5 at the center of a distorted square pyramid whose base of ∼3.3–4.7 Å on each side is formed by the carbonyl oxygens of residues V7, A10, I77, and I80, while G75’s carbonyl oxygen sits at the apex with the lateral sides ranging from 3.56 ± 0.40 Å for G75 and I80 to 5.05 ± 0.29 Å for G75 and V7. The five backbone carbonyls coordinate K+ at distances between 2.62 and 2.86 Å (Supplementary Table 2). K8’s carbonyl oxygen could be a sixth K+ ligand forming the vertex opposite G75’s carbonyl oxygen in an elongated octahedral coordination sphere. However, it lies more distant from K+ (3.98 ± 0.37 Å) and is instead involved in a hydrogen bond with the backbone amide of G79 (Figure 2b). The conserved glycine residues in the two loops allow the ion binding site to form. G11 adopts an extended conformation with a positive φ dihedral angle, and its lack of side chain allows the close approach of the two loops. G75 is in an α-helical conformation, but the side chain of any other residue at this position would disrupt the close packing of the conserved F6 with its neighboring residues. G79 contributes to a tight turn with a positive φ, allowing its amide to hydrogen bond with K8. The other conserved residue in loop 5, N76, has a role in the overall fold of the protein as its side-chain amide makes a pair of interdomain hydrogen bonds with V143 in the LysM domain. As well as contributing to ion binding, A10 likely ensures close contact can be made with V7 and G141 at the N-terminus of the final beta-strand in the LysM domain.
Pentavalent coordination of potassium in proteins is commonly observed,46 but it is possible that a water molecule could be involved in coordinating the ion raising the coordination number. The structure reveals a likely explanation for Ec-Kbp’s specificity for potassium and slightly larger ions over sodium: the two ion binding loops are already tightly packed with potassium bound, while accommodating sodium would dictate a shortening of each of the ion–carbonyl distances by approximately 0.36 Å to maintain favorable interactions, which does not seem sterically feasible. The structure also explains the roles of most of the conserved residues surrounding the ion binding site and explains why it is difficult to find mutations that subtly alter potassium affinity without abolishing it altogether.
Structure-Guided Mutagenesis Modulates K+ Binding
To fine-tune Ec-Kbp’s potassium binding affinity, we introduced mutations within and around the ion binding site, informed by the new NMR structure (Figure 2b and Supplementary Figure 2b). Since K+ appears to be coordinated by the protein’s backbone carbonyl groups, our scope for directly affecting the binding site was limited. We speculated that adjusting the electrostatic character of residues near the binding pocket could affect the stability of the K+ bound state and increase the Kd. We generated a set of KRaION1 mutants with altered residues within and near the K+ binding site. K8, A10, and N76 were swapped for another small residue (A, G) or to a negatively charged D. These choices were made on the basis of the residues’ electrostatic characteristics: positive or neutral residues were swapped for other neutral or negative residues, respectively. The conserved hydrophobic residues I77 and I80 were mutated to smaller amino acids that are either neutral, like A and G, or small and polar, like S. We deduced that nearby residues D9 and E12 could be mutated to remove their negative charges and make the local electrostatic environment less favorable for K+ binding without disrupting binding altogether. These residues were substituted with either polar, positively charged, or small nonpolar residue groups: N/A/K or Q/A/K.
We measured the fluorescence and absorbance spectra of the KRaION1 mutants over a range of K+ concentrations from 0 to 310 mM under nonisotonic conditions at pH = 7.3. We determined their apparent Kd, ΔF/F, baseline fluorescence brightness, and protein folding efficiency (Supplementary Table 3). We used nonisotonic conditions for quick screening of the variants’ functionality but used isotonic conditions for proper assessment of Kd to remove the effects of varying ionic strength on our measurements. KRaION1’s apparent Kd in these nonisotonic conditions was 12 ± 4 mM in comparison to a Kd of 69 ± 10 mM in isotonic conditions, suggesting the indicator’s Kd is affected by ionic strength. Variants with mutations made directly to the K+ binding site appeared to have disrupted functioning, as we observed fluorescence dynamic ranges of <30% and folding efficiency of <50% relative to KRaION1. However, mutants D9N and E12A, residues adjacent to the K+ binding site, exhibited higher isotonically measured Kd values of 138 ± 21 and 96 ± 9 mM with a ΔF/Fmax of 434% and 318%, respectively (Figure 2c). This suggested that changing the electrostatic environment of the binding pocket is possible through structure-guided rational design. Both mutants maintained selectivity to K+ over other ions and showed a decreased ΔF/F % response to Zn2+ (Supplementary Figure 1b,c). Relative to KRaION1, both mutants had different biexponential kinetics of association to K+. D9N had activation time constants of τfast = 37 ms (69% of total amplitude) and τslow = 1211 ms (remaining amplitude) (Figure 2d), and E12A had activation time constants of τfast = 26 ms (60% of total amplitude) and τslow = 890 ms (remaining amplitude) (Figure 2e). The D9N mutation led to slower activation kinetics, whereas the E12A mutation led to faster activation kinetics relative to KRaION1 and GINKO1. We named the mNG-Ec-Kbp-E12A mutant KRaION2 because of its favorable Kd and kinetics values.
Ec-Kbp Homologues Can Be Used as Alternative Binding Moieties
As an alternative approach for indicator design with a binding affinity relevant to the intracellular mammalian environment, we searched for Ec-Kbp homologues to use as the sensing moiety in our sensor. We used protein BLAST to search through a data set (env_nr) that contains proteins from whole genome shotgun sequencing (WGS) metagenomic projects. We selected four proteins with unknown functions that shared 45–72% amino acid identity with Ec-Kbp and in which the K+ binding site was also largely conserved (Supplementary Table 4, Figure 3a). Protein homologue names are based on the organism or origin of sample collection: Ec, E. coli (NCBI reference sequence: WP_000522415.1); C, compost (GenBank: MNG82101.1); Pa, P. aeruginosa (NCBI reference sequence: NP_253865.1); Hv, hydrothermal vent (GenBank: VAV91021.1); D, Defluviicoccus sp. (GenBank: SUS08588.1). Amino acid changes observed in the putative potassium binding site maintained the original residues’ electrochemical properties. A change in binding site residue V7 to I7 was observed in D-Kbp. Changes to residue I77 to V at equivalent positions were seen in all identified homologues with the exception of Hv-Kbp whose residue change was to T. Another change was seen in the Pa-Kbp homologue, in which residue I80 was swapped for V.
Figure 3.

Identification of alternative potassium binding proteins and comparison to Ec-Kbp. (a) Alignment of amino acid sequences of Ec-Kbp with five homologues obtained from a metagenomic BLAST search. Residues comprising the LysM and BON domains are shaded in gray and cyan, respectively. Residues highlighted in green indicate those that are conserved with the Ec-Kbp-identified potassium binding site. The β-sheet-forming regions and α-helix-forming regions are denoted by arrows and ribbons, respectively. Residues that were selected for site-directed mutagenesis in Ec-Kbp are denoted by asterisks. (b) Potassium titration data points for KRaION1 and homologues mNG-C-Kbp, mNG-Pa-Kbp, mNG-Hv-Kbp, and mNG-D-Kbp (open circles, squares, upward triangles, downward triangles, and diamonds, respectively) measured at pH = 7.4 and constant ionic strength, fitted using the equation Q = (Qmax – Q0)Y + Q0 (denoted by a green line, blue line, magenta line, purple line, and dark green line, respectively).
We exchanged Ec-Kbp for each of these homologues in the KRaION1 indicator to check their functionality. When tested at different K+ concentrations under isotonic conditions, all sensors had a fluorescence response that varied with K+ concentration, suggesting these homologues are also K+ binding proteins and sequence changes near the binding site did not disable their K+ binding function (Supplementary Table 5, Supplementary Figure 3). These alternative binding moieties confer a range of isotonically characterized binding affinities to the indicators from 39 to 112 mM (Figure 3b). One homologue, mNG-D-Kbp, displayed an isotonically measured Kd value of 112 ± 35 mM in the same range as KRaION1 and its D9N and E12A variants. Thus, alternative potassium binding domains can generate promising potassium indicator candidates with a variety of Kd’s.
In Vivo Characterization of Indicators in HeLa Cells
We focused on a subset of indicators to characterize in cultured HeLa cells: KRaION1, KRaION2, and KRaION1/D9N. In addition to KRaION1, we chose the D9N and E12A mutants due to their higher Kd, fast kinetics, and lower sensitivity to Zn2+. We excluded mNG-D-Kbp from this experiment because of its lower ΔF/F %. We used UV and cyan light to excite the fluorescence of KRaION1, KRaION2, and KRaION1/D9N (Figure 4a). To permeabilize the cells and allow intracellular diffusion of potassium while maintaining steady pH, we used the ionophores valinomycin and CCCP. We exchanged different concentrations of K+ into the extracellular space, and in between exchanges, cells were incubated in 0 mM K+ to allow sensor equilibration to baseline fluorescence. The ratio of fluorescence emission changes (F487 nm/F390 nm) showed KRaION1, KRaION2, and KRaION1/D9N responses when pulsed with K+ buffers ranging from 0 to 150 mM K+, suggesting the indicators are still functional in cells (Figure 4b). The excitation fluorescence ratio of the indicators measured when excited at two distinct wavelengths, ΔR/R0, increased up to 150 mM intracellular K+ with the max ΔR/R0 at 755 ± 88%, 943 ± 310%, and 1112 ± 160% for KRaION1, KRaION2, and KRaION1/D9N, respectively (Table 1).
Figure 4.

Calibration of KRaION1, KRaION2, and KRaION1/D9N in live HeLa cells. (a) Representative fluorescence images of KRaION1, KRaION2, and KRaION1/D9N in the green channel with UV and cyan excitations (n = 10 FOVs from three independent transfections each). Scale bars, 10 μm. (b) Representative excitation ratiometric response of KRaION1, KRaION2, and KRaION1/D9N at increasing [K+] from 0 to 150 mM, equilibrated with valinomycin and CCCP (n = 16, 18, and 21 cells, respectively, from 3 independent transfections; ratio was calculated as F478 nm/F390 nm for the spectral configuration shown in (a)). (c) Binding titration curves for KRaION1, KRaION2, and KRaION1/D9N when equilibrated with valinomycin and CCCP (n = 15, 20, and 20 cells from 2 independent transfections; KRaION1, and KRaION2, and KRaION1/D9N, respectively; data points, mean; error bars, standard deviation) presented as normalized excitation ratio F478 nm/F390 nm. Experiments were done at 33 °C.
We calculated the sensors’ Kd values when expressed in HeLa cells as 37 ± 9 mM for KRaION1, 58 ± 6 mM for KRaION2, and 95 ± 21 mM for KRaION1/D9N (Figure 4c). We selected KRaION1/D9N as the indicator with the highest fluorescence ratio to evaluate whether cells with a high expression of indicator have a different Kd value than those with lower expression. Kd values obtained accounting for these expression differences were 90 ± 41 and 94 ± 14 mM for high and low expressing cells, respectively, which overlap with our previously reported measurement that assumed equal expression across cells (Supplementary Figure 4a). However, these Kd values are inconsistent with the isotonically measured Kd values obtained in vitro. Cell calibration experiments performed with valinomycin alone without CCCP were even more inconsistent (Supplementary Table 6, Supplementary Figure 4b). When performing the same calibration experiment with valinomycin for GINKO1, we obtained an intracellular Kd value of 3 ± 0.23 mM, different from its isotonic value.
We attempted to understand this Kd discrepancy by measuring the indicator’s binding affinity at constant 5 mM Na+ and variable K+ in the range of 0.1 to 250 mM. In these conditions, we obtained a different Kd value for KRaION1 of 42 ± 10 mM, lower than the isotonic case but overlapping the HeLa cell case when calibrated with valinomycin and CCCP (Table 1). Overlap in Kd values between this in vitro measurement and cell calibration was also observed for KRaION2 and KRaION1/D9N at 66 ± 9 and 100 ± 6 mM, respectively. Different Kd values were observed in all other measured indicators under these in vitro conditions (Supplementary Table 7). This suggests the indicators are sensitive to changes in ionic strength when measured in vitro. Kd discrepancies have previously been studied for calcium and potassium probes.28,47 For potassium probes, a combination of several ionophores and sucrose was most effective in potassium calibration experiments in Jurkat and U937 cell types.28 This is consistent with our observations of cell calibration with a combination of valinomycin and CCCP versus just valinomycin. For these calibration experiments, we suggest identifying the best combination of ionophores for proper equilibration of ion concentrations in cell types of interest. Future potassium indicator engineering efforts may benefit from screens being fully performed in cell types of interest rather than in vitro with methods like robotic molecular screening, which has not yet been applied to potassium indicators.48
Conclusion
We have designed a set of potassium indicators on the basis of the insertion of Ec-Kbp mutants and homologue variants into mNeonGreen. Insertion of Ec-Kbp into mNeonGreen results in KRaION1, a bright and fast indicator, with an isotonically measured binding affinity for potassium of 69 ± 10 mM. We used two approaches to increase this Kd value: structure-guided mutagenesis and identification of alternative potassium binding proteins. We utilized NMR to determine the structure of Ec-Kbp to reveal that the backbone carbonyls of residues V7, A10, G75, I77, and I80 coordinate the potassium ion. With this information, we designed two mutants, KRaION1/D9N and KRaION2, with higher isotonically measured Kd values of 138 ± 21 and 96 ± 9 mM, respectively. We also identified four Ec-Kbp homologues that have a conserved binding site for potassium and can be alternative binding moieties in the indicator. When expressed intracellularly, KRaION1, KRaION2, and KRaION1/D9N maintain their functionality. However, Kd values measured in the intracellular environment with valinomycin and CCCP were lower than those observed in vitro. The measurement of Kd at constant sodium concentration gave values that overlapped with these intracellular conditions, raising the point that physiological characterization of potassium indicators needs to be performed carefully and may need to occur in the exact cell type and physiological context of interest. KRaION1’s apparent Kd for potassium was already more than 2 orders of magnitude higher in vitro than Ec-Kbp’s. Perhaps Ec-Kbp’s conformational change is frustrated by having its N- and C-termini tethered by mNG. This suggests further optimization of the linker sequences to mNG may be useful in optimizing KRaION1’s Kd. For all indicators, further structure-guided mutagenesis can be combined with other techniques such as high-throughput, multiparameter directed evolution approaches48 to further improve other parameters of interest, such as brightness and kinetics.
Materials and Methods
Molecular Cloning and Mutagenesis
De novo gene synthesis of the designed potassium sensor including Ec-Kbp and identified homologues and subsequent subcloning into the pBAD-HisD vector were done by Genscript. The genes were codon-optimized for human cells. Mutagenesis of individual residues in KRaION1 was done using the QuikChange Site-Directed Mutagenesis Kit (Agilent). Forward and reverse primers used to generate each mutant are provided in Supplementary Table 8. Indicators were transformed into TOP10 (Invitrogen) electrocompetent E. coli cells and grown on LB plates with 1:1000 dilution of carbenicillin and 0.002% arabinose. Confirmation of the correct mutation for each construct was done by colony sequencing (Eton Bioscience Inc.). For mammalian expression, the selected indicator genes were cloned into a mammalian expression vector pN1 (Clontech). The DNA sequence of GINKO1 was obtained from Addgene (plasmid #113112).
Protein Purification and in Vitro Characterization
Proteins were expressed and purified using the pBAD/HisB arabinose-inducible system (Invitrogen) in TOP10 cells (Invitrogen) cultured in RM medium as previously described.49,50 Before measurements, the proteins were dialyzed against various buffers depending on the subsequent measurement conditions (see sections below) and stored at 4 °C.
The following buffers were prepared for characterization: 150 mM NaCl, 25 mM HEPES, 25 mM MES, and 10 mM Tris (to be used as 0 mM K+) and 150 mM KCl, 25 mM HEPES, 25 mM MES, and 10 mM Tris. Absorbance was measured using a spectrophotometer (Hitachi Shimadzu UV-3600 Plus). The extinction coefficients were determined using alkine denaturation with 1 M NaOH as described previously.51 Fluorescence was measured using two excitation wavelengths at 400 and 480 nm and emission ranges of 410–700 and 490–700 nm, respectively, in the same buffers with 0 and 150 mM K+. Quantum yields were measured at 0 and 150 mM K+ buffers at excitation wavelengths of 405 and 480 nm (Edinburgh FLS1000 spectrometer).
For pKa measurements, 0 and 150 mM K+ buffers at various pH values were used to measure the fluorescence intensity in the range of 250–600 nm (Plate Reader Thermo Varioskan LUX). The kinetics of the fluorescence response was obtained with 480 nm excitation and 520/40 nm emission at 40 mM K+ concentration using stopped flow spectrophotometry (Applied Photophysics Ltd., SX 20).
For K+ titration under nonisotonic conditions, purified proteins in artificial mammalian cell cytoplasm buffer (12 mM NaHCO3 and 1 mM MgCl2 in 25 mM Tris/MES, pH 7.4) were diluted into a series of buffers with K+ (potassium d-gluconate) concentrations ranging from 0 to 260 mM. For the examination of K+ specificity, purified proteins were diluted into a series of buffers that each contained a different salt, these being: LiCl, NaCl, KCl, RbCl, CsCl, NH4Cl, MgCl2, and CaCl2 ranging from 0 to 260 mM and ZnCl2 at a range of 0 to 260 μM. The fluorescence spectrum of the purified proteins in each solution was measured with excitation at 490 nm and emission from 510 to 600 nm (Thermo Scientific Varioskan LUX).
For Kd characterization under
isotonic
conditions, the proteins were dialyzed against 25 mM MES, 25 mM HEPES
buffer at pH 7.3 and added to a series of isotonic solutions with
varied KCl to NaCl ratios. KCl concentrations tested were in the range
of 0 to 700 mM KCl. For characterization of Kd in a secondary condition, the 25 mM MES, 25 mM HEPES buffer
at pH 7.3 with constant 5 mM NaCl concentration and increasing concentrations
of KCl in the range of 0.1 to 250 mM K+ was used. Absorbance
and fluorescence from three technical replicates for each indicator
were measured at 24–26 °C (Tecan Spark Plate Reader).
Titration curves and Kd were later obtained
by fitting to the following equation using a custom Python script: Q = (Qmax – Q0)Y + Q0 where Q is fluorescence and Qmax and Q0 are maximum and minimum fluorescent yields,
respectively.  , where M is
a fixed concentration
component of the genetically encoded sensor, L is
the varying concentration component of K+, and Kd is the dissociation constant. All calculated
values are expressed as Kd ± standard
deviation.
, where M is
a fixed concentration
component of the genetically encoded sensor, L is
the varying concentration component of K+, and Kd is the dissociation constant. All calculated
values are expressed as Kd ± standard
deviation.
Ec-Kbp·Tl+ NMR and Ec-Kbp·K+ Structure Determination
To identify the amino acid groups that ligate the cation, a 0.25 mM sample of U–13C- and U–15N-labeled Ec-Kbp prepared as described previously17 was diluted in 20 mM sodium phosphate, pH 7.2, 0.01% w/v sodium azide, and 5% D2O with the addition of 1 mM thallium sulfate (to achieve 2 mM Tl+). From a 3D HNCO experiment recorded (1024 × 27 × 128 complex points for sweep widths of 9615 × 2127.7 × 2413.8 Hz in 1H, 15N, and 13C, respectively) at 14.1 T and 298 K on a Bruker AVANCE IIIHD spectrometer equipped with a TCI cryoprobe and processed conventionally, the cross peaks that were split by an additional coupling in the 13CO dimension were identified, making use of the backbone resonance assignment of Ec-Kbp·Tl+ (B. O. Smith, personal communications) in CCPN analysis software.52
The refined structure of the Ec-Kbp·K+ was calculated using the same restraints as in the original structure determination17 but with the addition of a potassium ion and 5 distance restraints of 2.75 ± 0.1 Å between it and the five coordinating carbonyls.43 The parameters for the singly charged potassium ion were added to the topallhdg5.3.pro and parallhdg5.3.pro files in the ARIA2.3/CNS software with the epsilon and sigma values set to 0.62 kJ mol–1 and 3.0695 Å in the OPLX section used during refinement in explicit water.45 Eight rounds of structure calculations starting from randomized coordinates in Cartesian space were executed with 100 structures each. The 20 structures from the final iteration with the lowest restraint energy were refined using the ARIA2.3/CNS software in explicit water. The refined structures were analyzed and figures prepared using PyMOL and Inkscape. The Ec-Kbp·K+ structure has been deposited at the protein data bank (PDB: 7PVC).
Metagenomic Search for Alternative Ec-Kbp Domains Using Protein BLASTp
To search for alternative potassium binding domains, we used NCBI’s BLASTp protein to protein sequence alignment tool. The Ec-Kbp amino acid sequence (NCBI reference sequence: WP_000522415.1) was used to search against the metagenomic database (env_nr). No other parameters were set to perform the search. The obtained results were filtered by percentage similarity of the amino acid sequences and were picked manually. The E-value metric was also taken into consideration, where numbers closest to 0 would be identified as good matches.
In Vitro Screening of KRaION1 Mutants and Homologues
Protein expression and purification was done as described above. To screen mutants and homologues for binding affinity, the proteins were dialyzed against 100 mM Tris buffer at pH 7.3 and assessed at different KCl concentration increments ranging from 0 to 310 mM KCl in 100 mM Tris at pH 7.3 using a Tecan Plate Reader (Tecan Spark). Sensor titration curves were fitted, and Kd values were obtained fitting into the single site binding equation described above.
In Vivo Characterization and Imaging in HeLa Cells
HeLa cells (ATCC) were cultured in Dulbecco’s modified Eagle’s medium (Gibco) with 10% fetal bovine serum (FBS; YEASEN Biotech) and were incubated at 37 °C with 5% CO2. Cells were plated on 12 mm coverslips (Fisher Scientific) coated with Matrigel in 24-well plates before transfection. Liposomal transfection was applied according to the manufacturer’s protocol (YEASEN Biotech). HeLa cells were transfected using Hieff Trans (YEASEN Biotech) according to the manufacturer’s protocol and imaged 36–48 h post-transfection using an inverted wide-field Nikon Eclipse Ti2 microscope equipped with a SPECTRA III light engine (Lumencor) and a Orca Flash4.0v3 camera (Hamamatsu), controlled by NIS-Elements AR software, and using a 20×, 0.75 NA objective lens.
The solutions with varying concentrations of K+ were prepared by mixing two stock solutions (25 mM MES, 25 mM HEPES, and 250 mM NaCl as the “no potassium solution” and 25 mM MES, 25 mM HEPES, and 250 mM KCl with potassium) in the corresponding ratios. Cell medium was replaced with 500 μL of 25 mM, 25 mM HEPES, and 250 mM NaCl buffer with 15 μM valinomycin and 5 μM CCCP and incubated for 15 min before perfusing. The solutions ranging from 0 to 150 mM K+ were administered with 15 μM valinomycin (Aladdin Biochemical Technology Co., Ltd.) and 5 μM CCCP (Shanghai Macklin Biochemical Co., Ltd.) right before perfusion. Cell calibration was also performed in the same manner with just 15 μM valinomycin.
To perform automated buffer exchange, the coverslip with the cells was transferred to the RC-26G flow chamber (Warner Instruments, USA) and connected to a custom-built perfusion system consisting of a peristaltic pump (Baoding Chuangrui Precision Pump Co., Ltd.), the SV06 12 port switch value (Runze Fluid, China), controlled heated platform (Warner Instruments, USA), and vacuum pump. The system was designed to offer programmable buffer exchange and continuous monitoring of flow rate, temperature, and channel switching. The perfusion system was controlled by the custom LabVIEW code (National Instruments Corporation; Supplementary Figure 5).
For live cell imaging, the programmable perfusion system was used to provide the series of extracellular buffers at a 1 mL/min flow rate with different potassium concentrations (0 to 150 mM K+ as described) containing valinomycin and CCCP or valinomycin alone, ensuring that the cells were bathed in a consistent environment without pipetting the desired solution manually. The buffer temperature was kept at 33 °C throughout the entire imaging.
Acknowledgments
We thank Orhan T. Celiker for help with Python script debugging. We are grateful to Yong Qian, Nick Barry, Demian Park, Monique Kauke, and Ishan Gupta for useful discussions. We thank Dr. Zhong Chen from Instrumentation and Service Center for Molecular Sciences at Westlake University for help with the spectroscopy measurements. We thank Donald Campbell and Jared Williamson for assistance with preparing Ec-Kbp for NMR spectroscopy. We thank Chenlei Gu from Westlake University for helping with the development of the custom fluidic device. This work was supported by start-up funding from the Foundation of Westlake University, National Natural Science Foundation of China grants 32050410298 and 32171093, 2020 BBRF Young Investigator Grant, and MRIC Funding 103536022023 to K.D.P., by an internal grant of the National Research Center Kurchatov Institute No. 1056 from 02.07.2020 to F.V.S., and by Lisa Yang, John Doerr, and HHMI, and by grants NIH 1R01MH123977, NIH R01DA029639, NIH R01MH122971, NIH R01NS113499, NIH RF1NS113287, NIH RF1DA049005, NSF 1848029, NIH 1R01DA045549, NIH 1R01MH114031, NSF Grant 1734870, NIH R43MH109332, and NIH R01GM104948 to E.S.B. C.C.T.C. was supported by the NSF GRFP Fellowship and Alfred P. Sloan Foundation scholarship.
Supporting Information Available
The Supporting Information is available free of charge at https://pubs.acs.org/doi/10.1021/acssensors.1c02201.
NMR and refinement statistics; geometry of the K+ binding site; physical properties of the tested KRaION1 mutants and homologs; search results obtained from protein BLAST of the Ec-Kbp sequence; binding affinity and dynamic range characterization; properties of indicators measured in HeLa cells; binding affinity (Kd) measurements; primer sequences; selectivity of KRaION1, KRaION1/D9N, and KRaION2 to K+; structure of Ec-Kbp·K+ and mutation sites; cell calibration curves; experimental workflow of the perfusion system setup (PDF)
Accession Codes
Sequences of the reported proteins are available at Genbank at the following accession codes: KRaION1, OK187805; mNG-Ec-Kbp-D9N (KRaION1/D9N), OK187806; KRaION2, OK187807; mNG-C-Kbp, OK187808; mNG-Pa-Kbp, OK187809; mNG-Hv-Kbp, OK187810; mNG-D-Kbp, OK187811. The solution structure of potassium bound Ec-Kbp has been deposited in the Protein Data Bank, accession code: 7PVC. Plasmids of interest are available from Addgene.
Author Contributions
C.C.T.C., K.D.P., and E.S.B. initiated the project. C.C.T.C., F.V.S., and K.D.P. designed the mNG-Ec-Kbp (KRaION1) indicator. C.C.T.C. and K.D.P. developed the indicators, performed mutagenesis and screening, and identified Ec-Kbp homologues. C.C.T.C. and M.Y. performed in vitro characterization and data analysis. C.L. and K.D.P. performed sensor characterization in HeLa cells. L.Y. and K.D.P. performed ion selectivity experiments. B.O.S. determined the Ec-Kbp NMR structure and provided guidance on mutagenesis and data analysis. C.C.T.C., B.O.S., K.D.P., and E.S.B. interpreted the data and wrote the manuscript with contributions of all authors. K.D.P. and E.S.B. oversaw all aspects of the project.
The authors declare no competing financial interest.
Notes
We acknowledge Henrietta Lacks and her family for their immense contributions to scientific research. The mammalian cell experiments in this study were conducted on HeLa cells. The HeLa cell line was established from the tumor cells of Henrietta Lacks without her knowledge or consent. Since 1951, Henrietta Lacks has made countless contributions to medicine and science. E.S.B. makes a donation, on behalf of the lab, to the Henrietta Lacks Foundation for each publication the Boyden lab makes that uses HeLa cells, as inspired by the Reck-Peterson lab’s example.
Notes
The TOC image was created with BioRender.com.
Supplementary Material
References
- Newman E. A.; Frambach D. A.; Odette L. L. Control of Extracellular Potassium Levels by Retinal Glial Cell K+ Siphoning. Science 1984, 225 (4667), 1174–1175. 10.1126/science.6474173. [DOI] [PMC free article] [PubMed] [Google Scholar]
- Gardner-Medwin A. R.; Nicholson C. Changes of Extracellular Potassium Activity Induced by Electric Current through Brain Tissue in the Rat. Journal of Physiology. 1983, 335, 375–392. 10.1113/jphysiol.1983.sp014540. [DOI] [PMC free article] [PubMed] [Google Scholar]
- Ficker E.; Heinemann U. Slow and Fast Transient Potassium Currents in Cultured Rat Hippocampal Cells. J. Physiol. 1992, 445, 431–455. 10.1113/jphysiol.1992.sp018932. [DOI] [PMC free article] [PubMed] [Google Scholar]
- Mitterdorfer J.; Bean B. P. Potassium Currents during the Action Potential of Hippocampal CA3 Neurons. J. Neurosci. 2002, 22 (23), 10106–10115. 10.1523/JNEUROSCI.22-23-10106.2002. [DOI] [PMC free article] [PubMed] [Google Scholar]
- Martina M.; Metz A. E.; Bean B. P. Voltage-Dependent Potassium Currents during Fast Spikes of Rat Cerebellar Purkinje Neurons: Inhibition by BDS-I Toxin. J. Neurophysiol. 2007, 97 (1), 563–571. 10.1152/jn.00269.2006. [DOI] [PubMed] [Google Scholar]
- Stansfeld C. E.; Marsh S. J.; Halliwell J. V.; Brown D. A. 4-Aminopyridine and Dendrotoxin Induce Repetitive Firing in Rat Visceral Sensory Neurones by Blocking a Slowly Inactivating Outward Current. Neurosci. Lett. 1986, 64 (3), 299–304. 10.1016/0304-3940(86)90345-9. [DOI] [PubMed] [Google Scholar]
- Ocorr K.; Reeves N. L.; Wessells R. J.; Fink M.; Chen H.-S. V.; Akasaka T.; Yasuda S.; Metzger J. M.; Giles W.; Posakony J. W.; Bodmer R. KCNQ Potassium Channel Mutations Cause Cardiac Arrhythmias in Drosophila That Mimic the Effects of Aging. Proc. Natl. Acad. Sci. U. S. A. 2007, 104 (10), 3943–3948. 10.1073/pnas.0609278104. [DOI] [PMC free article] [PubMed] [Google Scholar]
- Luo J.; Brunelli S. M.; Jensen D. E.; Yang A. Association between Serum Potassium and Outcomes in Patients with Reduced Kidney Function. Clin. J. Am. Soc. Nephrol. 2016, 11 (1), 90–100. 10.2215/CJN.01730215. [DOI] [PMC free article] [PubMed] [Google Scholar]
- Nie X.; Arrighi I.; Kaissling B.; Pfaff I.; Mann J.; Barhanin J.; Vallon V. Expression and Insights on Function of Potassium Channel TWIK-1 in Mouse Kidney. Pflugers Arch. 2005, 451 (3), 479–488. 10.1007/s00424-005-1480-9. [DOI] [PubMed] [Google Scholar]
- Eil R.; Vodnala S. K.; Clever D.; Klebanoff C. A.; Sukumar M.; Pan J. H.; Palmer D. C.; Gros A.; Yamamoto T. N.; Patel S. J.; Guittard G. C.; Yu Z.; Carbonaro V.; Okkenhaug K.; Schrump D. S.; Linehan W. M.; Roychoudhuri R.; Restifo N. P. Ionic Immune Suppression within the Tumour Microenvironment Limits T Cell Effector Function. Nature 2016, 537 (7621), 539–543. 10.1038/nature19364. [DOI] [PMC free article] [PubMed] [Google Scholar]
- Windmüller O.; Lindauer U.; Foddis M.; Einhäupl K. M.; Dirnagl U.; Heinemann U.; Dreier J. P. Ion Changes in Spreading Ischaemia Induce Rat Middle Cerebral Artery Constriction in the Absence of NO. Brain 2005, 128 (9), 2042–2051. 10.1093/brain/awh545. [DOI] [PubMed] [Google Scholar]
- Barcia G.; Fleming M. R.; Deligniere A.; Gazula V.-R.; Brown M. R.; Langouet M.; Chen H.; Kronengold J.; Abhyankar A.; Cilio R.; Nitschke P.; Kaminska A.; Boddaert N.; Casanova J.-L.; Desguerre I.; Munnich A.; Dulac O.; Kaczmarek L. K.; Colleaux L.; Nabbout R. De Novo Gain-of-Function KCNT1 Channel Mutations Cause Malignant Migrating Partial Seizures of Infancy. Nat. Genet. 2012, 44 (11), 1255–1259. 10.1038/ng.2441. [DOI] [PMC free article] [PubMed] [Google Scholar]
- Octeau J. C.; Faas G.; Mody I.; Khakh B. S. Making, Testing, and Using Potassium Ion Selective Microelectrodes in Tissue Slices of Adult Brain. J. Vis. Exp. 2018, 135, e57511. 10.3791/57511. [DOI] [PMC free article] [PubMed] [Google Scholar]
- Meeks J. P.; Mennerick S. Action Potential Initiation and Propagation in CA3 Pyramidal Axons. J. Neurophysiol. 2007, 97 (5), 3460–3472. 10.1152/jn.01288.2006. [DOI] [PubMed] [Google Scholar]
- Bossy-Wetzel E.; Talantova M. V.; Lee W. D.; Schölzke M. N.; Harrop A.; Mathews E.; Götz T.; Han J.; Ellisman M. H.; Perkins G. A.; Lipton S. A. Crosstalk between Nitric Oxide and Zinc Pathways to Neuronal Cell Death Involving Mitochondrial Dysfunction and p38-Activated K+ Channels. Neuron 2004, 41 (3), 351–365. 10.1016/S0896-6273(04)00015-7. [DOI] [PubMed] [Google Scholar]
- Chen T.-W.; Wardill T. J.; Sun Y.; Pulver S. R.; Renninger S. L.; Baohan A.; Schreiter E. R.; Kerr R. A.; Orger M. B.; Jayaraman V.; Looger L. L.; Svoboda K.; Kim D. S. Ultrasensitive Fluorescent Proteins for Imaging Neuronal Activity. Nature. 2013, 499, 295–300. 10.1038/nature12354. [DOI] [PMC free article] [PubMed] [Google Scholar]
- Ashraf K. U.; Josts I.; Mosbahi K.; Kelly S. M.; Byron O.; Smith B. O.; Walker D. The Potassium Binding Protein Kbp Is a Cytoplasmic Potassium Sensor. Structure. 2016, 24, 741–749. 10.1016/j.str.2016.03.017. [DOI] [PubMed] [Google Scholar]
- Subach O. M.; Sotskov V. P.; Plusnin V. V.; Gruzdeva A. M.; Barykina N. V.; Ivashkina O. I.; Anokhin K. V.; Nikolaeva A. Y.; Korzhenevskiy D. A.; Vlaskina A. V.; Lazarenko V. A.; Boyko K. M.; Rakitina T. V.; Varizhuk A. M.; Pozmogova G. E.; Podgorny O. V.; Piatkevich K. D.; Boyden E. S.; Subach F. V. Novel Genetically Encoded Bright Positive Calcium Indicator NCaMP7 Based on the mNeonGreen Fluorescent Protein. Int. J. Mol. Sci. 2020, 21 (5), 1644. 10.3390/ijms21051644. [DOI] [PMC free article] [PubMed] [Google Scholar]
- Bischof H.; Rehberg M.; Stryeck S.; Artinger K.; Eroglu E.; Waldeck-Weiermair M.; Gottschalk B.; Rost R.; Deak A. T.; Niedrist T.; Vujic N.; Lindermuth H.; Prassl R.; Pelzmann B.; Groschner K.; Kratky D.; Eller K.; Rosenkranz A. R.; Madl T.; Plesnila N.; Graier W. F.; Malli R. Novel Genetically Encoded Fluorescent Probes Enable Real-Time Detection of Potassium in Vitro and in Vivo. Nat. Commun. 2017, 8 (1), 1422. 10.1038/s41467-017-01615-z. [DOI] [PMC free article] [PubMed] [Google Scholar]
- Shen Y.; Wu S.-Y.; Rancic V.; Aggarwal A.; Qian Y.; Miyashita S.-I.; Ballanyi K.; Campbell R. E.; Dong M. Genetically Encoded Fluorescent Indicators for Imaging Intracellular Potassium Ion Concentration. Commun. Biol. 2019, 2, 18. 10.1038/s42003-018-0269-2. [DOI] [PMC free article] [PubMed] [Google Scholar]
- Somjen G. G. Extracellular Potassium in the Mammalian Central Nervous System. Annu. Rev. Physiol. 1979, 41, 159–177. 10.1146/annurev.ph.41.030179.001111. [DOI] [PubMed] [Google Scholar]
- Thier S. O. Potassium Physiology. Am. J. Med. 1986, 80 (4A), 3–7. 10.1016/0002-9343(86)90334-7. [DOI] [PubMed] [Google Scholar]
- Heinemann U.; Lux H. D. Ceiling of Stimulus Induced Rises in Extracellular Potassium Concentration in the Cerebral Cortex of Cat. Brain Res. 1977, 120 (2), 231–249. 10.1016/0006-8993(77)90903-9. [DOI] [PubMed] [Google Scholar]
- Futamachi K. J.; Mutani R.; Prince D. A. Potassium Activity in Rabbit Cortex. Brain Res. 1974, 75 (1), 5–25. 10.1016/0006-8993(74)90767-7. [DOI] [PubMed] [Google Scholar]
- Lothman E.; Lamanna J.; Cordingley G.; Rosenthal M.; Somjen G. Responses of Electrical Potential, Potassium Levels, and Oxidative Metabolic Activity of the Cerebral Neocortex of Cats. Brain Res. 1975, 88 (1), 15–36. 10.1016/0006-8993(75)90943-9. [DOI] [PubMed] [Google Scholar]
- Dufour S.; Dufour P.; Chever O.; Vallée R.; Amzica F. In Vivo Simultaneous Intra- and Extracellular Potassium Recordings Using a Micro-Optrode. J. Neurosci. Methods 2011, 194 (2), 206–217. 10.1016/j.jneumeth.2010.10.004. [DOI] [PubMed] [Google Scholar]
- Amzica F.; Massimini M.; Manfridi A. Spatial Buffering during Slow and Paroxysmal Sleep Oscillations in Cortical Networks of Glial Cells in Vivo. J. Neurosci. 2002, 22 (3), 1042–1053. 10.1523/JNEUROSCI.22-03-01042.2002. [DOI] [PMC free article] [PubMed] [Google Scholar]
- Rana P. S.; Gibbons B. A.; Vereninov A. A.; Yurinskaya V. E.; Clements R. J.; Model T. A.; Model M. A. Calibration and Characterization of Intracellular Asante Potassium Green Probes, APG-2 and APG-4. Anal. Biochem. 2019, 567, 8–13. 10.1016/j.ab.2018.11.024. [DOI] [PubMed] [Google Scholar]
- Qian Y.; Rancic V.; Wu J.; Ballanyi K.; Campbell R. E. A Bioluminescent Ca Indicator Based on a Topological Variant of GCaMP6s. Chembiochem 2019, 20 (4), 516–520. 10.1002/cbic.201800255. [DOI] [PubMed] [Google Scholar]
- Barykina N. V.; Subach O. M.; Doronin D. A.; Sotskov V. P.; Roshchina M. A.; Kunitsyna T. A.; Malyshev A. Y.; Smirnov I. V.; Azieva A. M.; Sokolov I. S.; Piatkevich K. D.; Burtsev M. S.; Varizhuk A. M.; Pozmogova G. E.; Anokhin K. V.; Subach F. V.; Enikolopov G. N. A New Design for a Green Calcium Indicator with a Smaller Size and a Reduced Number of Calcium-Binding Sites. Sci. Rep. 2016, 6, 34447. 10.1038/srep34447. [DOI] [PMC free article] [PubMed] [Google Scholar]
- Shaner N. C.; Lambert G. G.; Chammas A.; Ni Y.; Cranfill P. J.; Baird M. A.; Sell B. R.; Allen J. R.; Day R. N.; Israelsson M.; Davidson M. W.; Wang J. A Bright Monomeric Green Fluorescent Protein Derived from Branchiostoma Lanceolatum. Nat. Methods 2013, 10 (5), 407–409. 10.1038/nmeth.2413. [DOI] [PMC free article] [PubMed] [Google Scholar]
- Steiert F.; Petrov E. P.; Schultz P.; Schwille P.; Weidemann T. Photophysical Behavior of mNeonGreen, an Evolutionarily Distant Green Fluorescent Protein. Biophys. J. 2018, 114 (10), 2419–2431. 10.1016/j.bpj.2018.04.013. [DOI] [PMC free article] [PubMed] [Google Scholar]
- Amdisen A. Clinical and Serum-Level Monitoring in Lithium Therapy and Lithium Intoxication. Journal of Analytical Toxicology. 1978, 2, 193–202. 10.1093/jat/2.5.193. [DOI] [Google Scholar]
- Baselt R. C.Disposition of Toxic Drugs and Chemicals in Man: Centrally-Acting Drugs; Biomedical Publications: 1978; Vol 1. [Google Scholar]
- Chang K.-L.; Hung T.-C.; Hsieh B.-S.; Chen Y.-H.; Chen T.-F.; Cheng H.-L. Zinc at Pharmacologic Concentrations Affects Cytokine Expression and Induces Apoptosis of Human Peripheral Blood Mononuclear Cells. Nutrition 2006, 22 (5), 465–474. 10.1016/j.nut.2005.11.009. [DOI] [PubMed] [Google Scholar]
- Xu N.; Francis M.; Cioffi D. L.; Stevens T. Studies on the Resolution of Subcellular Free Calcium Concentrations: A Technological Advance. Focus on “Detection of Differentially Regulated Subsarcolemmal Calcium Signals Activated by Vasoactive Agonists in Rat Pulmonary Artery Smooth Muscle Cells.. Am. J. Physiol. Cell Physiol. 2014, 306 (7), C636–C638. 10.1152/ajpcell.00046.2014. [DOI] [PMC free article] [PubMed] [Google Scholar]
- Protasov E. S.; Borsakova D. V.; Alexandrovich Y. G.; Korotkov A. V.; Kosenko E. A.; Butylin A. A.; Ataullakhanov F. I.; Sinauridze E. I. Erythrocytes as Bioreactors to Decrease Excess Ammonium Concentration in Blood. Sci. Rep. 2019, 9 (1), 1455. 10.1038/s41598-018-37828-5. [DOI] [PMC free article] [PubMed] [Google Scholar]
- Bell C.Clinical Guide to Laboratory Tests, 3rd ed.; Tietz N. W., Ed.; Wiley, 2009; p 972. [Google Scholar]
- Yamagata N. The Concentration of Common Cesium and Rubidium in Human Body. J. Radiat. Res. 1962, 3, 9–30. 10.1269/jrr.3.9. [DOI] [PubMed] [Google Scholar]
- Lodish H. F.; Berk A.; Zipursky S.; Matsudaira P.; Baltimore D.; Darnell J. E.. Molecular Cell Biology; W. H. Freeman, 2000. [Google Scholar]
- Werbeck N. D.; Kirkpatrick J.; Reinstein J.; Hansen D. F. Using 15N-Ammonium to Characterise and Map Potassium Binding Sites in Proteins by NMR Spectroscopy. Chembiochem 2014, 15 (4), 543–548. 10.1002/cbic.201300700. [DOI] [PMC free article] [PubMed] [Google Scholar]
- Eichmann C.; Frey L.; Maslennikov I.; Riek R. Probing Ion Binding in the Selectivity Filter of the KcsA Potassium Channel. J. Am. Chem. Soc. 2019, 141 (18), 7391–7398. 10.1021/jacs.9b01092. [DOI] [PubMed] [Google Scholar]
- Harding M. M. Small Revisions to Predicted Distances around Metal Sites in Proteins. Acta Crystallogr. D Biol. Crystallogr. 2006, 62 (6), 678–682. 10.1107/S0907444906014594. [DOI] [PubMed] [Google Scholar]
- Linge J. P.; Williams M. A.; Spronk C. A. E. M.; Bonvin A. M. J. J.; Nilges M. Refinement of Protein Structures in Explicit Solvent. Proteins 2003, 50 (3), 496–506. 10.1002/prot.10299. [DOI] [PubMed] [Google Scholar]
- Mamatkulov S.; Schwierz N. Force Fields for Monovalent and Divalent Metal Cations in TIP3P Water Based on Thermodynamic and Kinetic Properties. J. Chem. Phys. 2018, 148 (7), 074504. 10.1063/1.5017694. [DOI] [PubMed] [Google Scholar]
- Harding M. M. Metal–ligand Geometry Relevant to Proteins and in Proteins: Sodium and Potassium. Acta Crystallogr. D Biol. Crystallogr. 2002, 58 (5), 872–874. 10.1107/S0907444902003712. [DOI] [PubMed] [Google Scholar]
- O’Malley D. M.; Burbach B. J.; Adams P. R. Fluorescent Calcium Indicators: Subcellular Behavior and Use in Confocal Imaging. Confocal Microscopy 1998, 122, 261–304. 10.1385/1-59259-722-X:261. [DOI] [PubMed] [Google Scholar]
- Piatkevich K. D.; Jung E. E.; Straub C.; Linghu C.; Park D.; Suk H.-J.; Hochbaum D. R.; Goodwin D.; Pnevmatikakis E.; Pak N.; Kawashima T.; Yang C.-T.; Rhoades J. L.; Shemesh O.; Asano S.; Yoon Y.-G.; Freifeld L.; Saulnier J. L.; Riegler C.; Engert F.; Hughes T.; Drobizhev M.; Szabo B.; Ahrens M. B.; Flavell S. W.; Sabatini B. L.; Boyden E. S. A Robotic Multidimensional Directed Evolution Approach Applied to Fluorescent Voltage Reporters. Nat. Chem. Biol. 2018, 14 (4), 352–360. 10.1038/s41589-018-0004-9. [DOI] [PMC free article] [PubMed] [Google Scholar]
- Babakhanova S.; Jung E. E.; Namikawa K.; Zhang H.; Wang Y.; Subach O. M.; Korzhenevskiy D. A.; Rakitina T. V.; Xiao X.; Wang W.; Shi J.; Drobizhev M.; Park D.; Eisenhard L.; Tang H.; Köster R. W.; Subach F. V.; Boyden E. S.; Piatkevich K. D. Rapid Directed Molecular Evolution of Fluorescent Proteins in Mammalian Cells. Protein Sci. 2022, 31 (3), 728–751. 10.1002/pro.4261. [DOI] [PMC free article] [PubMed] [Google Scholar]
- Subach O. M.; Vlaskina A. V.; Agapova Y. K.; Dorovatovskii P. V.; Nikolaeva A. Y.; Ivashkina O. I.; Popov V. O.; Piatkevich K. D.; Khrenova M. G.; Smirnova T. A.; Boyko K. M.; Subach F. V. LSSmScarlet, dCyRFP2s, dCyOFP2s and CRISPRed2s, Genetically Encoded Red Fluorescent Proteins with a Large Stokes Shift. Int. J. Mol. Sci. 2021, 22 (23), 12887. 10.3390/ijms222312887. [DOI] [PMC free article] [PubMed] [Google Scholar]
- Piatkevich K. D.; Hulit J.; Subach O. M.; Wu B.; Abdulla A.; Segall J. E.; Verkhusha V. V. Monomeric Red Fluorescent Proteins with a Large Stokes Shift. Proc. Natl. Acad. Sci. U. S. A. 2010, 107 (12), 5369–5374. 10.1073/pnas.0914365107. [DOI] [PMC free article] [PubMed] [Google Scholar]
- Vranken W. F.; Boucher W.; Stevens T. J.; Fogh R. H.; Pajon A.; Llinas M.; Ulrich E. L.; Markley J. L.; Ionides J.; Laue E. D. The CCPN Data Model for NMR Spectroscopy: Development of a Software Pipeline. Proteins 2005, 59 (4), 687–696. 10.1002/prot.20449. [DOI] [PubMed] [Google Scholar]
Associated Data
This section collects any data citations, data availability statements, or supplementary materials included in this article.