Abstract
The MRGPRX family of receptors (MRGPRX1-4) is a family of Mas-related G protein coupled receptors that have evolved relatively recently1. Of these, MRGPRX2 and MRGPRX4 are key physiological and pathological mediators of itch and related mast-cell mediated hypersensitivity reactions2–5. MRGPRX2 couples to both Gi and Gq in mast cells6. Here we describe agonist-stabilized structures of MRGPRX2 coupled to Gi1 and Gq in ternary complex with the endogenous peptide cortistatin-14 and with a synthetic agonist probe, respectively, and the development of potent antagonist probes for MRGPRX2. We also describe a specific MRGPRX4 agonist and the structure of this agonist in a complex with MRGPRX4 and Gq. Together, these findings should accelerate the structure-guided discovery of therapeutics for pain, itch and mast-cell mediated hypersensitivity.
The sensation of itch (pruritis) can be triggered by many environmental insults including insect bites and parasites, skin diseases such as eczema, liver and kidney diseases, and hypersensitivity reactions to commonly prescribed medications7. Itch has both neuronal7 and non-neuronal components with histamine release from mast cells being prominent8. Several transmitters have been implicated in sensing and mediating the itch response including histamine, interleukin, and various peptides. Molecular targets involved in itch include G protein coupled receptors (GPCRs), cytokine receptors, and ion channels7. Recently, Mas-related G protein coupled receptors (MRGPRs) have been identified as pruritogenic receptors4,9.
Structures of MRGPRX2-G protein complexes
MRGPRs are divided into 9 major clades (viz. MRGPRA-H and MRGPRX) and of these, the MRGPRX group of receptors was identified as being enriched in human sensory neurons10. Comprising four members—MRGPRX1, X2, X3 and X4—MRGPRX4 mediates cholestatic itch4 while MRGPRX2 regulates mast cell degranulation and itch-related hypersensitivity reactions2,11. We identified MRGPRX2 and MRGPRX4 as targets for commonly prescribed medications that induce itch and mast-cell mediated hypersensitivity as side-effects including the anti-diabetic drug nateglinide12, which acts on MRGPRX4, and several morphinan alkaloids including morphine, codeine, and dextromethorphan, which act on MRGPRX213. Using structure-based drug discovery, we also identified a selective MRGPRX2 agonist that can induce degranulation in mast cells13.
Despite controversy regarding the canonical signaling pathways for MRGPRX214, we found MRGPRX2 effectively coupled to nearly all G protein families (Extended Data Fig. 1) with robust coupling at both Gq and Gi-family α subunits15. Accordingly, we determined the structures of MRGPRX2 complexed with both Gq and Gi1 using the MRGPRX2-selective small molecule agonist (R)-ZINC-3573 13 and the peptide cortistatin-14 at global resolutions of 2.9 Å, 2.6 Å, 2.45 Å and 2.54 Å (Fig. 1a–d, Extended Data Fig. 2, 3), respectively, via single particle cryogenic electron microscopy (cryo-EM).
Fig. 1 |. CryoEM structures of MRGPRX2 complexes.
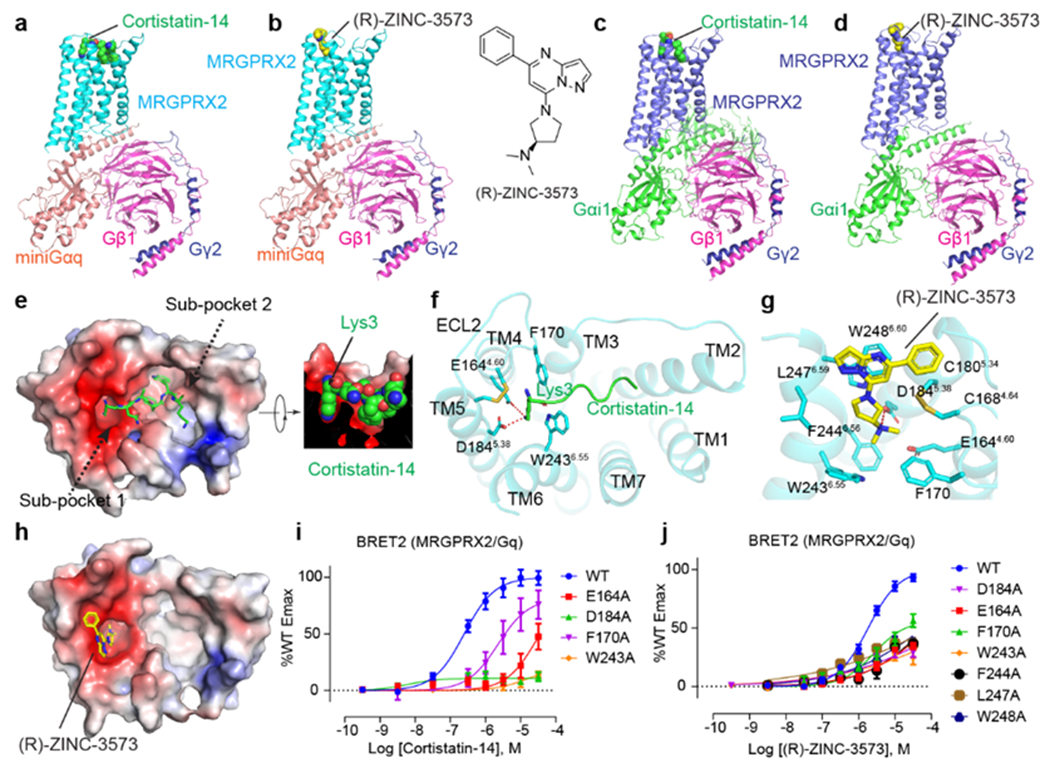
a-d, Cartoon representations of MRGPRX2-Gq-cortistatin-14 complex (a), MRGPRX2-Gq-(R)-ZINC-3573 complex (b), MRGPRX2-Gi1-cortistatin-14 complex (c) and the MRGPRX2-Gi1-(R)-ZINC-3573 complex (d). e, Electrostatic surface representation of the MRGPRX2 extracellular pocket calculated using the APBS plugin in PyMOL with cortistatin-14 shown as green sticks. Red, negative (−5 kT/e); blue, positive (+5 kT/e). The cross-section image shows a nice fit of Lys3 of cortistatin-14 to sub-pocket 1. f, Binding pocket of cortistatin-14. Key residues of MRGPRX2 interacting with the Lys3 of corstitatin-14 were shown as sticks. Hydrogen bonds are shown as red dashed lines. g, Key residues involved in (R)-ZINC-3573 binding in MRGPRX2. Charge interaction is shown as red dashed lines. h, Electrostatic surface representation of the MRGPRX2 extracellular pocket with (R)-ZINC-3573 shown as yellow sticks. Red, negative (−5 kT/e); blue, positive (+5 kT/e). i, Alanine substitution of MRGPRX2 residues interacting with the Lys3 of cortistatin-14 significantly reduced cortistatin-14 stimulated Gq activation. Data represent mean ± SEM of n = 3 biological replicates. j, BRET2 validation of the (R)-ZINC-3573 binding pocket. Data represent mean ± SEM of n = 3 biological replicates.
The high-resolution maps of MRGPRX2 enabled unambiguous building of its seven transmembrane domains (7-TM). Both cortistatin-14 and (R)-ZINC-3573 adopt similar conformations in the Gi1- or Gq-coupled MRGPRX2 structures (Extended Data Fig. 4a–b, d). The cryoEM maps revealed better ligand densities in the Gq-coupled MRGPRX2 complexes (Extended Data Fig. 2, 3); thus, our structural analysis of ligand poses is mainly focused on Gq-coupled MRGPRX2 complex structures unless otherwise specified. As we recently discussed16, MRGPRX2 lacks, or has modified, many of the canonical trigger motifs seen in other Family A GPCRs (Extended Data Fig. 5a). These include: (1) the absence of the ‘P-I-F’ (P5.50, I3.40, F6.44) motif17; (2) a semi-conserved DRY motif in TM3 which is ERC in MRGPR-family receptors; (3) lack of a key TM3 residue for conserved sodium binding; (4) and absence of the so-called ‘toggle switch’ tryptophan (W6.48) which is replaced by a glycine (G6.48)17. Consequently, activated MRGPRX2 has several distinctive features in some of these key motifs. Specifically, residues of TM5 in MRGPRX2 shift downwards by two residues with L1945.48, which is in the equivalent position of P5.50 in other GPCRs, engages with the other two P-I-F motif residues L1173.40 and F2326.44 (Extended Data Fig. 6a). Additionally, the conserved toggle switch W6.48 is replaced with G6.48 in MRGPRX2 and TM6 of MRGPRX2 is shifted towards TM3 at the extracellular side, which may hinder ligand binding to the typical Family A orthosteric pocket (Extended Data Fig. 6b, c). Accordingly, both corstitatin-14 and (R)-ZINC-3573 bind to MRGPRX2 at a position that is distant from the usually described Family A agonist binding site and closer to the extracellular vestibule (Extended Data Fig. 6c). Finally, the conserved disulfide bond between TM3 and extracellular loop 2 (ECL2) found in Family A GPCRs is absent in MRGPRX2. Instead, an inter-helix disulfide bond occurs between C1684.64 and C1805.34 that is predicted to be found in all the human MRGPR family receptors (Fig. 1f–g, Extended Data Fig. 5a, b). Mutagenesis studies suggest this observed TM4-TM5 disulfide bond is essential for the signaling integrity of MRGPRX2 (Extended Data Fig. 5c, d).
Without the restriction introduced by the Class A canonical TM3-ECL2 disulfide-bond, the ECL2 of MRGPRX2 is flipped to the top of TM4 and TM5, resulting in an uncharacteristically wide-open extracellular ligand binding surface (Fig. 1e, f). Calculation of an electrostatic potential surface revealed that the MRGPRX2 pocket is highly negatively charged on one side (sub-pocket 1 formed by TM3-6 and ECL2) and relatively hydrophobic on the other (sub-pocket 2 formed by TM1-3 and TM6-7) (Fig. 1e, h). Cortistatin-14 binds to a shallow pocket in MRGPRX2 near the extracellular loops (Fig. 1e–f, Extended Data Fig. 6c) which reduces its local resolution, although we were able to model several key cortistatin-14 residues based on the cryo-EM map (Extended Data Fig. 3d). The basic residue Lys3 of cortistatin-14 binds into the negatively charged sub-pocket 1 and forms strong charge interactions with D1845.38 and E1644.60 (Fig. 1e, f). The remaining resolved residues of cortistatin-14 extended over W2436.55 and F170ECL2 of MRGPRX2 and bound to sub-pocket 2 mainly through hydrophobic interactions (Fig. 1e, f). This charge-hydrophobic binding mode of cortistatin-14 is consistent with prior observations showing that MRGPRX2 binds multiple peptides enriched in positively charged and aromatic residues18. A W243A6.55 mutation abolished the activity of cortistatin-14 and the F170ECL2A mutation reduced the potency of cortistatin-14 (Fig. 1i, Supplementary Table 1), indicating these two bridging residues are important in maintaining a proper pocket shape for ligand engagement and receptor activation. Indeed, the diameter of sub-pocket 1 is so small that it only allows one side chain of a residue to fit (Fig. 1e). Since the activation of MRGPRX2 appears triggered by agonist binding to sub-pocket 1 (Fig. 1h), many basic peptides could potentially activate MRGPRX2 if a Lys or Arg side chain is fit into the acidic sub-pocket 1, almost irrespective of their main-chain conformation. This may explain the puzzling observation that MRGPRX2 is promiscuously activated by many basic peptides.
Unlike cortistatin-14, the small molecule agonist (R)-ZINC-3573 bound only to the negatively charged sub-pocket 1 (Fig. 1h). The pyrazolo[1,5-a]pyrimidine moiety of (R)-ZINC-3573 lies parallel with W2486.60 through a π–π interaction, while its 5-phenyl moiety extends towards ECL2 and stacks with the C1684.64—C1805.34 disulfide (Fig. 1g). The N-dimethyl moiety of (R)-ZINC-3573 is directly inserted into a cavity formed by F170ECL2, W2436.55, F2446.56, D1845.38 and E1644.60 where it ion-pairs with D1845.38 and E1644.60 (Fig. 1g). Alanine substitutions of D1845.38 and E1644.60 impaired the efficacy of (R)-ZINC-3573 (Fig. 1j), and greatly reduced the potencies of peptide agonists (Fig. 1i, Extended Data Fig. 5e–g). As many positively charged peptides and cationic small molecules activate MRGPRX218, ionic interactions involving these two acidic residues may be crucial for agonist recognition and activation of MRGPRX2. Consistent with the pose observed in this structure, most alanine mutations in the (R)-ZINC-3573 pocket greatly reduced the efficacy of (R)-ZINC-3573 (Fig. 1j, Supplementary Table 1).
On the intracellular side, MRGPRX2 displayed a similar TM6 disposition in Gi and Gq coupled structures (Extended Data Fig. 4c, e). The cytoplasmic distance between TM3 and TM6 of both structures are approximately 15 Å, consistent with other active-state and G-protein coupled class A GPCR structures19–21 and distinct from inactive-state, G protein uncoupled state structures17,22. Both Gi1 and Gq make extensive hydrophobic and electrostatic interactions with the core through the α5 helix (Fig. 2a). However, they adopt different conformations upon coupling to MRGPRX2 (Fig 2a–e, Extended Data Fig. 4c–g). The α5 helix C-terminus of Gq engagesthe intracellular cavity of MRGPRX2 about 2 Å closer to TM6 compared to what is observed with Gi1 (Fig. 2a), probably owing to an interaction of the bulky Y243H5.23 of Gq with the TM2-TM3 interface of MRGPRX2.
Fig. 2 |. G protein coupling of MRGPRX2.
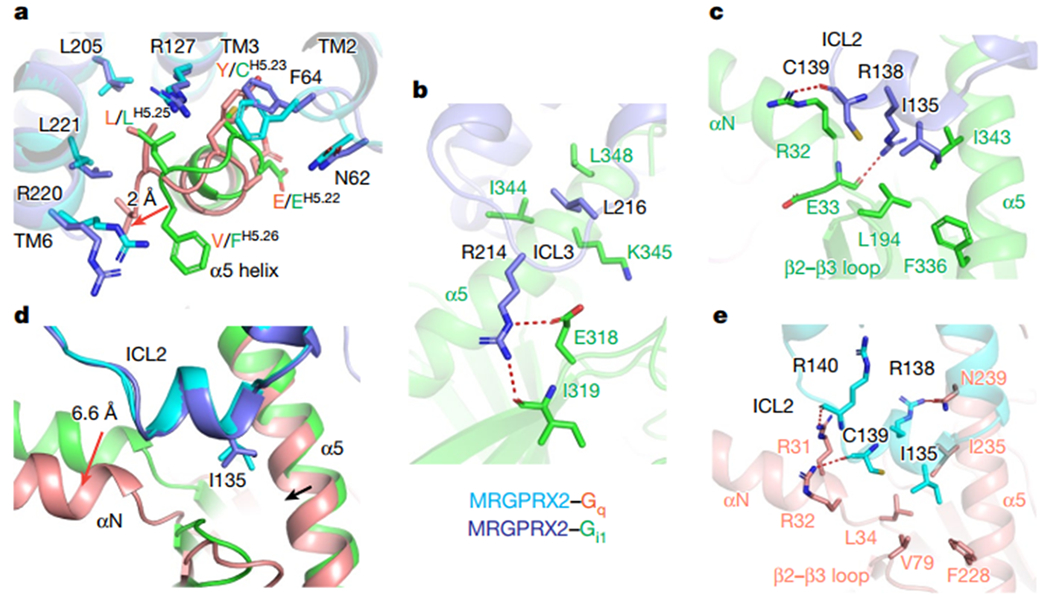
a, The α5 helix of Gq engages the cytoplasmic core of MRGPRX2 in a way distinct from Gi1. The relative displacement of Gq with respect to Gi1 is indicated by arrow. The receptor and Gq protein of MRGPRX2-Gq complex are colored by cyan and red, respectively. The receptor and Gi protein of MRGPRX2-Gi complex are colored by blue and green, respectively. b-c, The detailed interactions of ICL3 (b) and ICL2 of MRGPRX2 with Gi1(c). The hydrogen bonds are highlighted as red dashed lines. d, Different engagement modes of the αN helix of Gq and Gi upon coupling to MRGPRX2. The relative displacements of Gq with respect to Gi1 are indicated by red arrows. e, The detailed interaction of ICL2 of MRGPRX2 with Gq. Hydrogen bonds are highlighted as red dashed lines.
Outside the receptor core, is the clearly resolved intracellular loop 3 (ICL3) which formed extensive interactions with Gi1 (Fig. 2b, Extended Data Fig. 4g). Specifically, R214ICL3 extends downwards and forms hydrogen bonds with the side chain of E318 and the carbonyl group of I319 of Gi1. In addition, L216ICL3 engages the Gi1 α5 helix residues I344 and L348 through hydrophobic interactions (Fig. 2b). Mutations of R214ICL3 and L216ICL3 impaired the efficacy of agonist stimulated Gi1 activation (Extended Data Fig. 4h, i, Supplementary Table 2), suggesting ICL3 of MRGPRX2 plays a role in Gi1 coupling. By contrast, ICL3 was not resolved in Gq-coupled structures (Extended Data Fig. 4f).
Extensive interactions of the ICL2 with the αN helix of Gi1 or Gq were also observed in both MRGPRX2 structures (Fig. 2c–e). In the Gi-coupled MRGPRX2, R138ICL2 points downwards to αN helix of Gi and hydrogen-bonds with the backbone carbonyl of E33. The carbonyl group of C139ICL2 introduces an extra hydrogen bond with R32 of Gi1 (Fig.2c). In the Gq-coupled structure, the αN helix of Gq shifts 6.6 Å outwards compared to that of Gi and interacts with the ICL2 through a distinct hydrogen bond network (Fig. 2d–e). In both Gq and Gi1-coupled structures, I135ICL2 is buried in a hydrophobic groove mainly formed by the αN-β1 junction, β2-β3 loop and the α5 helix of G protein (Fig. 2c, e), and plays an important role in G protein activation (Extended Data Fig. 4j–m, Supplementary Table 2).
Discovery of MRGPRX2 antagonists
The development of a selective MRGPRX2 antagonist has substantial therapeutic potential and we were able to confirm the activity of Compound 2 (ZINC16991592, ‘1592) from a prior publication23 at MRGPRX2 finding that ‘1592 had a Ki value of 189 nM (Fig. 3a, Supplementary Table 3). Searching the ZINC database (http://zinc15.docking.org) and two rounds of analog modeling in the ultra-large make-on-demand libraries (Supplementary Data 1, Fig. 3a, Extended Data Fig. 7a, b, Supplementary Table 4, Supplementary Table 5), we ultimately obtained optimized compounds C9-6 and C9, with Ki values of 58 nM and 43 nM, respectively (Fig. 3b, Supplementary Table 3). We found C9-6 and C9 are inverse agonists for MRGPRX2 (Fig. 3c). A recent study suggested that substance P induced inflammation and pain is at least partially mediated by MRGPRX2 rather than its canonical receptor neurokinin-1 receptor (NK1R)3. We demonstrated both C9-6 and C9 could inhibit MRGPRX2 activation stimulated by various endogenous peptides (Extended Data Fig. 7c), including substance P (Fig. 3d). Off-target profiling revealed no significant activity at a number of GPCRs, ion channels and transporters when screened at 10 μM (Supplementary Excel File 1). As well, C9-6 and C9 display no antagonist activity towards NK1R (Fig. 3e) or MRGPRX4 (Fig. 3f, Supplementary Table 3), revealing them as potent and selective MRGPRX2 inverse agonists. Compound C9 and the inactive control C7 were further tested in mast cell degranulation assay and C9 inhibited (R)-ZINC-3573-stimulated LAD2 human mast cell degranulation in a concentration-dependent manner (Fig. 3g).
Fig. 3 |. Discovery of MRGPRX2 selective inverse agonists.
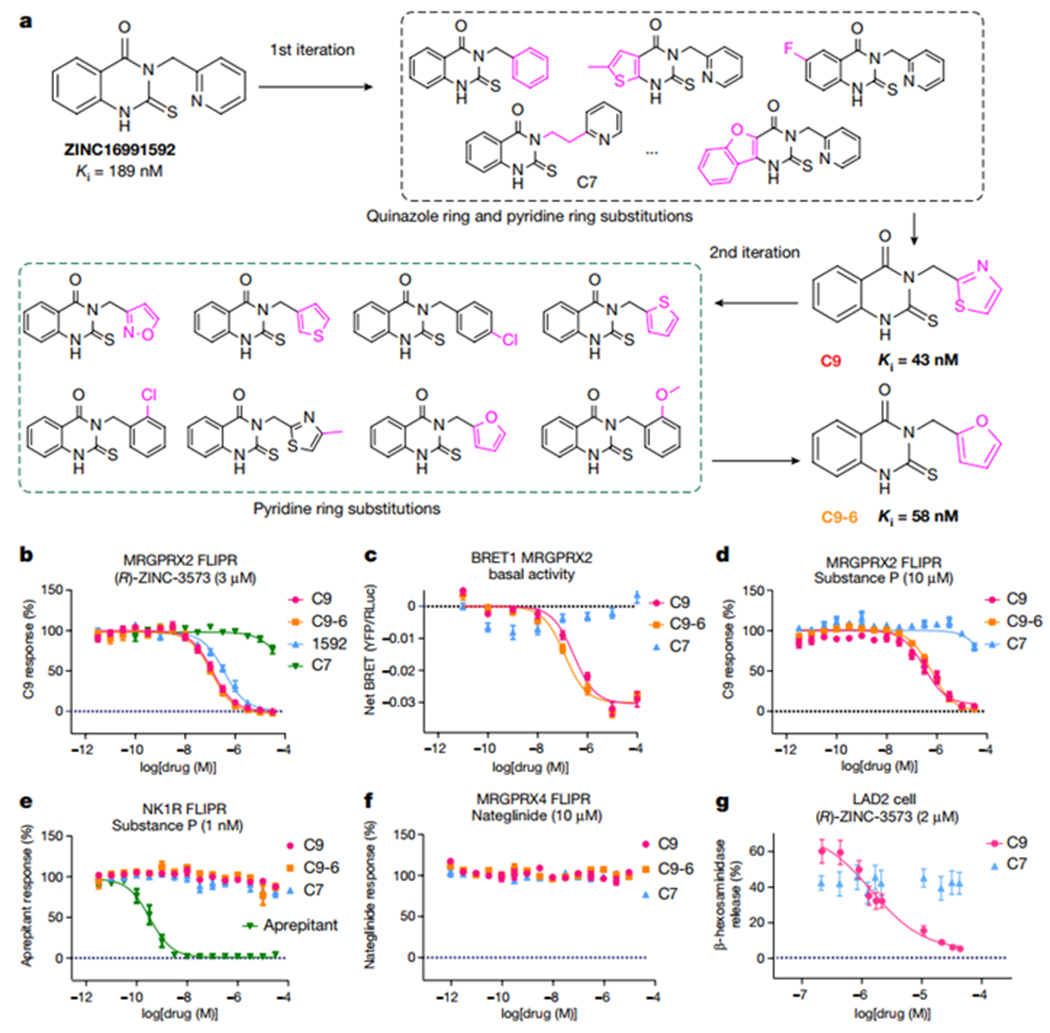
a, Overview of the analog optimization toward compound C9 and C9-6. b, C9 and C9-6 show improved antagonist activity for MRGPRX2 when compared to the parent compound ‘1592. C7 is shown as an inactive control. EC80 (R)-ZINC-3573 concentration (3 μM) was added in the antagonist mode FLIPR Ca2+ assay. Data represent mean ± SEM of n = 3 biological replicates. c, Compound C9 and C9-6 inhibit the basal recruitment of Gq by MRGPRX2 and display inverse agonist activities. Data represent mean ± SEM of n = 3 biological replicates. d, C9 and C9-6 inhibit substance P (10 μM) stimulated MRGPRX2 activation. Data represent mean ± SEM of n = 3 biological replicates. e-f, C9 and C9-6 display no antagonist activity towards NK1R (e) and MRGPRX4 (f) in FLIPR assay. Agonist concentrations in the antagonist assay were shown in the graph title. C7 is used as a negative control. Data represent mean ± SEM of n = 3 biological replicates. g, Compound C9 inhibit MRGPRX2 mediated LAD2 human mast activation. Data represent mean ± SEM. Samples were run in quadruplicate with n=2 biological replicates.
Discovery of a potent MRGPRX4 agonist
While the two acidic residues critical for the cationic agonist recognition in MRGPRX2 are conserved in the highly similar MRGPRX family receptors (Supplementary Fig. 1), the other three MRGPRX receptors are not reported to respond to cationic agonists. In contrast, MRGPRX4 binds to negatively charged bile acids4,5. The differential sensitivities of charged agonists promote us to solve the MRGPRX4 structure. Unfortunately, there were no sufficiently potent agonists available to stabilize MRGPRX4.
We previously identified the antidiabetic drug nateglinide, which modulates Kir6.2/SUR1 potassium channels, as a low micromolar agonist for MRGPRX412 and used it to demonstrate MRGPRX4 is a Gq-coupling receptor. Upon reviewing the initial medicinal chemistry studies of nateglinide24, a nateglinide analogue (referred as X4-1) that was reported to be inactive at the potassium channel was synthesized (Supplementary Data 2; Fig. 4a); X4-1 did not substantially alter the efficacy or potency when compared to nateglinide (Fig. 4b, Supplementary Table 6). X4-1 analogues with reverse stereochemistry (X4-2) showed no agonist activity at MRGPRX4, while further modifications by the addition of hydrophobic ethyl substituents to the cycloheptyl group of X4-1, namely X4-3, slightly increased MRGPRX4 activity (Fig. 4b, Supplementary Table 6). We then searched the ZINC database (zinc15.docking.org)25, prioritizing analogues with larger, bulkier and more hydrophobic substituents than X4-1. Following extensive analoging, compound MS47134 was identified as a potent MRGPRX4 agonist (EC50 = 150 nM) (Fig. 4b, Supplementary Table 6) with 47-fold improved selectivity for MRGPRX4 over the Kir6.2/SUR1 potassium channel (Extended Data Fig. 8a–i). Off-target profiling of MS47134 at 320 GPCRs showed activity only at MRGPRX4 and MRGPRX1 with no appreciable agonist or antagonist activity at the other 318 tested GPCRs (Extended Data Fig. 8j). As the activity against MRGPRX1 was not replicated in subsequent concentration-response assay (Supplementary Fig. 2), MS47134 represents a selective MRGPRX4 agonist.
Fig. 4 |. Agonist discovery and the cryoEM structure of MRGPRX4.
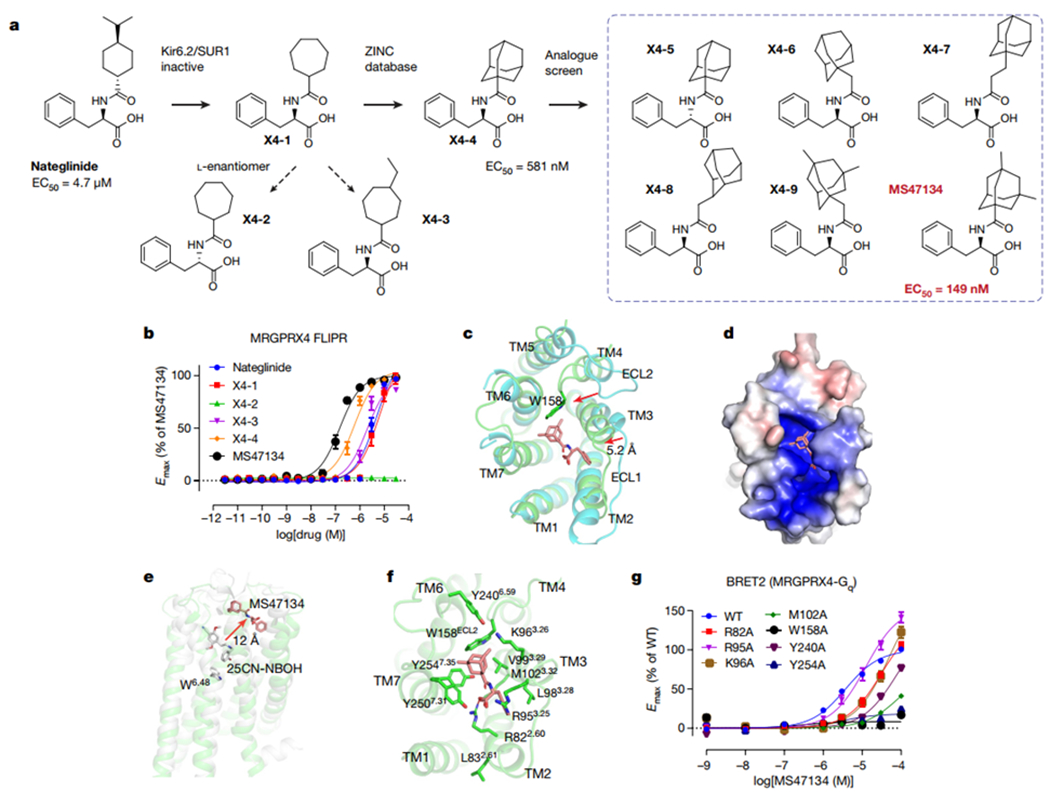
a, Overview of the compound optimization that leads to the discovery of MS47134. b, MS47134 displayed a significantly improved potency for MRGPRX4 in FLIPR Ca2+ assay compared with nateglinide. Data represent mean ± SEM of n = 3 biological replicates. c, Structural comparation of MRGPRX4 with MRGPRX2. Displacements of the extracellular part of MRGPRX4 related to MRGPRX2 are highlighted by red arrows. MRGPRX4 and MRGPRX2 are shown as green and cyan, respectively. MS47134 is shown as salmon sticks. d, Electrostatic surface representation of the MRGPRX4 extracellular pocket calculated using the APBS plugin in PyMOL. Red, negative (−5 kT/e); blue, positive (+5 kT/e). e, MS47134 binds to MRGPRX4 at the very extracellular side that is far away from the canonical toggle switch W6.48 in 5-HT2AR. MS47134, and 5-HT2AR agonist 25CN-NBOH are shown as sticks. f, Molecular interactions in the MS47134 pocket with surrounding residues shown as sticks. g, Alanine substitution on key residues in MS47134 pocket impaired MS47134 mediated Gq activation. Data represent mean ± SEM of n = 3 biological replicates.
Structure of MRGPRX4-Gq complex
We then used MS47134 to obtain an MRGPRX4-MS47134-Gq structure at a resolution of 2.6 Å (Extended Data Fig. 2). The overall structure of MRGPRX4 resembles MRGPRX2 at the intracellular side (Extended Data Fig. 9a, d). However, the extracellular tip of TM3 in MRGPRX4 was displaced 5.2 Å inward compared with MRGPRX2, resulting in a compact binding pocket for MS47134 (Fig 4c). Additionally, the ECL2 of MRGPRX4 shifts into the orthosteric pocket with W158ECL2 inserted right between TM3 and TM6 (Fig. 4c), making D1775.38 and E1574.60, the two equivalent acidic residues that are critical for cationic agonist recognition in MRGPRX2, solvent-inaccessible (Extended Data Fig. 9e, f); this could explain MRGPRX4’s apparent insensitivity to cationic agonists. In contrast, the MRGPRX4 binding pocket has an overall positive electrostatic potential surface (Fig. 4d), likely facilitating the binding of its endogenous agonists—negatively charged bile acids4. Because the agonist binds very close to the extracellular surface, the EM density for the phenyl group of MS47134 was not well-resolved in the complex map. We were then able to do a local refinement for the receptor-only region during revision, which significantly improves the map quality with a clear MS47134 density for unambiguous modeling. In this improved model, MS47134 binds to MRGPRX4 distantly from the canonical orthosteric binding site seen for biogenic amine receptors (Fig. 4e, Extended Data Fig. 6c) with its 3,5-dimethyl-adamantyl group anchored by K963.26, V993.29, W158ECL2, Y2406.59, Y2507.31 and Y2547.35 (Fig. 4f). The carboxyl group of MS47134 mainly forms charge interactions with R822.60 while its phenyl group interacts with L983.28, R953.25, M1023.32 and R822.60 through non-polar interactions (Fig. 4f). Mutagenesis studies support the pose of MS47134 in the binding pocket as most of the mutations surrounding MS47134 greatly affected its potency (Fig. 4g, Supplementary Table 7). Of note is Leu832.61, which is annotated as the reference sequence, is highly polymorphic and replaced by Ser832.61 in many individuals. An Leu83Ser mutation greatly attenuated the potency of both MS47134 and nateglinide (Supplementary Fig. 3), suggesting that side-effects of MRGPRX4 mediated itch may be less common in individuals with the Leu83Ser mutation.
The interactions between MRGPRX4 and Gq are similar to the MRGPRX2-Gq structure (Extended Data Fig. 9a–d); the only major difference being Y243H5.23 of Gq adopts different side-chain conformations to interact with Y130ICL2 upon coupling to MRGPRX4, probably resulting from the strong interaction between V612.39 of MRGPRX4 and Y243H5.23 of Gq (Extended Data Fig. 9g). A Y130ICL2A mutation reduced the agonist potency of MS47134 while the Y137ICL2A in MRGPRX2 has little effect (Extended Data Fig. 9h, i), suggesting the interaction between Y130ICL2 and Gq α5 helix residue Y243H5.23 is more important for Gq activation in MRGPRX4.
Discussion
The cryoEM structures of MRGPRX2 and MRGPRX4 illuminate unique aspects of the signalling of the unusual MRGPRX subfamily of GPCRs, and template the discovery and mechanistic understanding of selective chemical tools with which their function may be probed and new therapeutics designed. From a signalling perspective, the MRGPRXs lack many of the canonical motifs associated with signalling and ligand recognition in family A GPCRs. Intriguingly, the structures reveal that MRGPRX2 and MRGPRX4 agonists bind close to the extracellular solvent with over 10 Å “higher” than the orthosteric sites of most Family A GPCRs (Extended Data Fig. 6c). This in turn reflects the replacement of the conserved “toggle” residue W6.48 by G6.48 in both receptors, shifting TM6 inward toward TM3 and precluding agonist binding at the canonical site. As MRGPRX2 and MRGPRX4 agonists are located far away from G6.48, this residue G6.48 no longer acts as a “toggle” switch to sense the ligand and initiate conformational changes required for receptor activation. This suggests a unique ligand transduction mechanism in MRGPRX family receptors, which might require the formation of MRGPR-specific TM4-TM5 disulfide bond.
MRGPRX2 and MRGPRX4 have been implicated in mediating itch4,26 neurogenic inflammation3, atopic dermatitis27, ulcerative colitis28, preference for menthol cigarettes29, pain30 and several mast-cell mediated responses31. The relatively potent agonists and antagonists described here provide chemical probes to explore the biology of these receptors and structures will accelerate the search for specific medications targeting MRGPRs.
Methods
Generation of MRGPRX2, MRGPRX4, Gi1 heterotrimer and Gq heterotrimer construct
Genes for human MRGPRX2 (UniProtKB-Q96LB1) and human MRGPRX4 (UniProtKB-Q96LA9) were individually cloned into a modified pFastBac1 vector which contains a hemagglutinin (HA) signal peptide followed by FLAG-tag, His10-tag, and a TEV protease site at the N terminus. To facilitate protein expression and subsequent purification, thermostabilized apocytochrome b562RIL (BRIL) and HRV3C protease site were introduced at the N-terminal of receptor. For Gq protein, we used the same mini-GαqiN heterotrimer construct as what was used for 5HT2A-Gq complex32. For Gi1 protein, a dominant-negative human Gai1 and Gβ1γ2 subunits were cloned into pFastbac1 and pFastDual vector individually as previously reported33.
Receptor-G protein complex expression
The Bac-to-Bac Baculovirus Expression System (Invitrogen) was used to generate the recombinant baculovirus for protein expression. Prior to infection, viral titers were determined by flow-cytometric analysis of cells stained with gp64-PE antibody (Expression Systems). For the MRGPRX2-Gi1 complex, MRGPRX2, DN-Gi1 and Gβ1γ2 were co-expressed by infecting Tni cells at a density of 2 million cells per ml with P1 baculovirus at multiplicity of infection (MOI) ratio of 2.5:1:1. Cell was harvested by centrifugation 48 h post infection and stored at −80°C for future use. For the MRGPRX2-Gq and MRGPRX4-Gq complex, both MRGPRX2 and MRGPRX4 were co-expressed with mini-GαqiN heterotrimer by infecting Tni cells at a density of 2 million cells per ml with P1 baculovirus at multiplicity of infection (MOI) ratio of 3:1.5, respectively. Cells were harvested by centrifugation 48 h post infection and stored at −80°C for future use.
scFv16 expression and purification
ScFv16 gene was cloned into a modified pFastBac1 vector, expressed and purified as previously reported34 . Briefly, supernatant containing secreted scFv16 from baculovirus-infected Sf9 insect cells was collected by centrifugation at 96 h post-infection. The pH of medium was adjusted to pH 7.8 by adding Tris powder. Chelating agents were quenched by addition of 1 mM nickel chloride and 5 mM calcium chloride and stirring at room temperature for 1 hour. After another centrifugation, the supernatant was incubated with 1 ml His60 Ni Superflow Resin (Takara) overnight at 4°C. The resin was collected next day and washed with 20 column volumes 20 mM HEPES pH 7.5, 500 mM NaCl, 10 mM imidazole. The protein was eluted with 20 mM HEPES pH 7.5, 100 mM NaCl, 250 mM imidazole and further purified by size exclusion chromatography using a Superdex 200 16/60 column (GE healthcare). Peak fraction was collected and concentrated to 2 mg ml−1 for future use.
Receptor-G protein complex purification.
The cell pellet of MRGPRX2-Gq complex was thawed on ice and incubated with a buffer containing 20 mM HEPES pH 7.5, 50 mM NaCl, 1 mM MgCl2, 2.5 units of Apyrase (NEB) and proteinase inhibitor at room temperature. After 1.5 h, the cell suspension was dounce homogenized. Membrane was collected by centrifugation at 25,000 rpm for 30 min using a Ti45 rotor (Beckman) and solubilized using 40 mM HEPES pH 7.5, 100 mM NaCl, 5% (w/v) glycerol, 0.6% (w/v) LMNG, 0.06% (w/v) CHS for 5 h at 4°C with 500 μg scFv16. The solubilized proteins in the supernatants were isolated by ultra-centrifugation at 32,000 rpm for 30 min using a Ti70 rotor, and then incubate overnight at 4°C with TALON IMAC resin (Clontech) and 20 mM imidazole. The resin was collected next day and washed with 25 column volumes buffer containing 20 mM HEPES pH 7.5, 100 mM NaCl, 30 mM imidazole, 0.01% (w/v) LMNG, 0.001% (w/v) CHS and 5% glycerol. The protein was then eluted using the same buffer supplemented with 250 mM imidazole. Eluted protein was concentrated and subjected to size-exclusion chromatography on a Superdex 200 Increase 10/300 column (GE Healthcare) that was pre-equilibrated with 20 mM HEPES pH 7.5, 100 mM NaCl, 100 μM TCEP, 0.00075% (w/v) MNG, 0.00025 (w/v) GDN and 0.00075% (w/v) CHS. Peak fractions were collected and incubated with 15 μl of His-tagged PreScission protease (GeneScript) and 2 μl PNGase F (NEB) at 4°C overnight to remove the N-terminal BRIL and potential glycosylation. The protein was concentrated and further purified next day by size-exclusion chromatography using a same buffer. Peak fractions were collected and concentrated to 3-5 mg ml−1. 200 μM (R)-ZINC-3573 or 100 μM Cortistantin-14 was added to the concentrated complex sample and incubate at cold room for 2 h prior to grid-making. The same protocol was also used for the purification of MRGPRX2-Gi1 complex, except that the N-terminal Bril was not removed by adding PreScission protease. The MRGPRX4-Gq complex was purified using a same protocol as MRGPRX2-Gi1 complex except 20 μM MS47134 was added throughout the purification to stabilize the complex. The protein was then concentrated to 5 mg ml−1 and incubate with 200 μM MS47134 for 2 h prior to grid-making.
CryoEM data collection and 3D reconstitution
The samples (3.2 μl) were applied to glow discharged Quantifoil R1.2/1.3 Au300 holey carbon grids (Ted Pella) individually and were flash frozen in a liquid ethane/propane (40/60) mixture using a Vitrobot mark IV (FEI) set at 4°C and 100% humidity with a blot time range from 2.5 to 5 s. Images were collected using a 200keV Talos Artica with a Gatan K3 direct electron detector at a physical pixel size of 0.91 Å. Micrograph recorded movies were automatically collected using SerialEM using a multishot array35. Data were collected at an exposure dose rate of ~15 electrons/pixel/second as recorded from counting mode. Images were recorded for ~2.7 seconds in 60 subframes to give a total exposure dose of ~50 electron per Å2. All subsequent three-dimensional classification and refinement steps were performed within cryoSPARC36,37. Following manual inspection and curation of the micrographs after patch-based motion correction and contrast transfer function (CTF) estimation, particles from each dataset were selected using Blob particle picker and initial 2D classification yielded templates for subsequent template picking. A subset of the selected particles was used as a training set for Topaz and the particles were repicked from the micrographs using Topaz38 and subjected to 2D and/or 3D classification. The picked particle coordinates from the three sets were merged yielding a subset of unique particle that survived 2D classification (i.e. duplicates were removed with a radius of 100 pixels). Multiple rounds of multi-reference refinement resolved final stack of particles that produced a map with a resolution reported in Extended Data Table 1 (by FSC using the 0.143 Å cut-off criterion)39 after Global CTF refinement and post-processing including soft masking, B-factor sharpening in cryoSPARC and filtering by local resolution40 to generate the post-processed sharpened map. Alternative post sharpening was performed on the two half-maps using deepEMhancer41. For MRGPRX4, a local refinement for the receptor only region was performed to improve the map quality for the ligand binding pocket to assist modeling. Angular orientation distribution was plotted using either cryoSPARC or cisTEM42. For more details see Extended Data Fig. 2, 3 and Extended Data Table 1.
Model building and refinement.
Maps from deepEMhancer were used for map building, refinement and subsequent structural interpretation. The dominant-negative Gi1 trimer model was adapted from the cryoEM structure of CB2-Gi complex (PDB 6PT0)43. Gq trimer and scFv16 model was taken from 5-HT2AR-Gq complex (PDB 6WHA)32. The G proteins and scFv16 were docked into the cryoEM map using Chimera44. The receptor model of MRGPRX2 and MRGPRX4 were manually build in Coot45, followed by several rounds of real-space refinement using Phenix46. For cortistatin-14 of MRGPRX2-Gq complex, residues 3-8 were modelled according to the map density. For the cortistatin-14 of MRGPRX2-Gi1 complex, residues 2-6 were modelled. The binding pose of MS47134 is validated by GemSpot47. The model statistics was validated using Molprobity48. Structural figures were prepared by Chimera or Pymol (https://pymol.org/2/).
FLIPR Ca2+ assay
FLIPR Ca2+ assay is used for all the drug screening for MRGPRX2, MRGPRX4 and NK1R. Tetracycline inducible MRGPRX2 or MRGPRX4 stable cells [Flp-In™ T-REx™-293 cell which is derived from HEK 293 cells (ATCC, CRL 1573)] were maintained in DMEM containing 10% (v/v) FBS, 100 units ml−1 penicillin G, 100 μg ml−1 streptomycin, 100 μg ml−1 hygromycin B, and 15 μg ml−1 blasticidin 16. NK1 stably expressing cell were maintained in DMEM containing 10% (v/v) FBS, 100 units ml−1 penicillin G and 100 μg ml−1 streptomycin. On the day of assay, cells were plated into Poly-L-Lysine (PLL) coated 384-well black clear bottom cell culture plates with DMEM buffer, which is composed of 1% (v/v) dialyzed FBS,100 units ml−1 penicillin G, 100 μg ml−1 streptomycin with 1 μg ml−1 tetracycline at density of 20,000 cells in 40 μl per well for overnight. For NK1 stable cells, the same media used for MRGPRX2 or MRGPRX4 cells except the tetracycline were used. Medium was removed and cells were incubated with 20 μl of calcium dye (FLIPR Calcium 4 Assay Kit; Molecular Devices) diluted in assay buffer (1× HBSS, 2.5 mM probenecid, and 20 mM HEPES, pH 7.4) for 1 hour at 37°C and 20 min at room temperature in the dark. To measure agonist activity of receptors, drug plates were prepared with increasing concentrations of test compound at 3 times the desired final concentration using drug buffer (1 x HBSS, 20 mM HEPES, 0.1% (w/v) BSA, pH 7.4). Once loaded in FLIPR (Molecular Devices), basal fluorescence was measured for 10 s, then 10 μl of test compounds were added followed by continued fluorescence measurement for an additional 120 s. When measuring antagonist activity of receptors, drug plates were prepared with increasing concentrations of test compound at 4 times the desired final concentration, added as above for their potential effects on basal levels for 120 s first, followed by a 15 min incubation before addition of 10 μl of 4x of reference agonist at final concentration corresponding to the EC80, which was indicated in the title of each graph. Data were normalized to % reference compound stimulation and analyzed using nonlinear regression “log(agonist) vs. response” in GraphPad Prism 9.0.
Bioluminescence resonance energy transfer assay 2 (BRET2)
Agonist stimulated G protein activation of both MRGPRX2 and MRGPRX4 mutants are performed by BRET2 assay using transient transfection. HEK293T cells were plating either in six-well dishes containing 350-400 k cells per well, or 10-cm dishes at approximately 2 million per dish 20-24 h prior to transfection. The cells were then transfected with a 2:1:2:2 ratio of the receptor:GαrLuc8:Gβ:GγGFP DNA. Transit 2020 (Mirus biosciences) was used to complex the DNA at a ratio of 3 μL Transit/μg DNA, in OptiMEM (GIBCO) at a concentration of 10 ng DNA per μL OptiMEM. After 24 h, the cells were plated in poly-L-lysine coated 96-well white clear bottom cell culture plates in plating media (DMEM + 1% dialyzed FBS) at a density of 40-50,000 cells in 200 μl per well and incubated overnight. The next day, the media was carefully aspirated and cells were washed once with 60 μl of drug buffer (1 x HBSS, 20 mM HEPES, 0.1% (w/v) BSA, pH 7.4), then 60 μl drug buffer containing coelenterazine 400a (nanolight technology) at 5 μM final concentration was added to each well and incubate for 5 min. Cells were then treated with 30 μl of 3x designated drug for an additional 5 minutes. After drug incubation, plates were read in an LB940 Mithras plate reader (Berthold Technologies) with a 395 nm (RLuc8-coelenterazine 400a) and 510 nm (GFP2) emission filters, at 1 s integration times. Each plate was read four times, and measurements from the fourth read were used in all analyses. BRET ratio was computed as the ratio of the GFP2 emission to rLuc8 emission. Data were normalized to % WT stimulation with indicated reference agonist and analyzed using nonlinear regression “log(agonist) vs. response” in GraphPad Prism 9.0. Log(agonist) vs normalized response –variable slope was used for (R)-ZINC-3573 pocket mutations (D184A, E164A, W243A, F244A, L247A, and W248A).
Bioluminescence resonance energy transfer assay 1 (BRET1)
To test the inverse agonist activities of MRGPRX2 compounds, BRET1 recruitment assay was performed. Human MRGPRX2 containing C-terminal Renilla luciferase (RLuc8), and Venus-tagged miniGq were co-transfected at a ratio of 1:5 using HEK293T cells. After 20-24 hours, transfected cells were plated into poly-L-lysine coated 96-well clear bottom white plate in plating media (DMEM + 1% (v/v) dialyzed FBS). The next day, media was decanted and cells were washed once with 60 μl drug buffer (1 x HBSS, 20 mM HEPES, 0.1% (w/v) BSA, pH 7.4), then 60 μl drug buffer containing 5 μM coelenterazine h (Promega) was added to each well and incubate for 5 min. Cells were then treated with 30 μl of 3x designated drug for an additional 5 minutes. After drug incubation, plates were read in an LB940 Mithras plate reader (Berthold Technologies) for both luminescence at 485 nm and fluorescent eYFP emission at 530 nm for 1 s per well. The ratio of eYFP/RLuc was calculated per well and the net BRET ratio was calculated and fitted using “log(inhibitor) vs. response” in GraphPad Prism 9.0 to represent the inhibitory effect of MRGPRX2 compound.
Inhibition screen
Binding assays were performed by the NIMH Psychoactive Drug Screening program as described49. Detailed binding assay protocols are available at: https://pdspdb.unc.edu/pdspWeb/content/UNC-CH%20Protocol%20Book.pdf.
Human Mast Cell activation (Beta-hexosaminidase release) Assay
Mast cell activation was assessed by measuring extracellular release of Beta-hexosaminidase, a major component of mast cell granules. To assay human mast cell Beta-hexosaminidase release, LAD2 human mast cells were seeded at a concentration of 2*105 cells per well in 96-well plates in Tyrode’s buffer (100 μl). 15 minutes prior to activation, varying concentrations of either C7 or C9 were added to the wells to reach a total volume of 190 μl. For activation, (R)-ZINC-3573 (10 μl, 2 μM) was added to each well for 30 minutes at 37°C. Separate wells received either buffer (buffer control), 0.1% Triton X-100 (total beta-hexosaminidase control), or (R)-ZINC-3573 alone (positive control) for the same amount of time. 30 μl of the supernatant were then removed from each well and added to 10 μl of NAG substrate solution (p-nitrophenyl-N-acetyl-β-D-glucosaminide) and allowed to incubate for 1 hour at 37C. Carbonate buffer (100 μl) was then added to each well and the absorbance of each well was immediately measured at 405 nm using a plate reader. Percent degranulation (%) was calculated as follows: ((Treatment release – buffer release) / (total release – buffer release)) * 100. Samples were run in quadruplicate and each compound was assayed in at least two independent experiments. Data were analyzed using GraphPad Prism 9.0.
GPCRome Screening
Screening of compounds against the PRESTO-Tango GPCRome was accomplished using previously described methods with several modifications 50. First, HTLA cells were plated in white 384-well clear bottom plates (Greiner) in DMEM (Sigma) with 1% (v/v) dialyzed FBS and 10 U per mL penicillin-streptomycin (Gibco). After 24 h, the cells were transfected using PEI (Sigma) with an in-plate adapted method51. Briefly, 17 ng per well PRESTO-Tango GPCR DNAs were resuspended in OptiMEM (Gibco) and hybridized with PEI prior to dilution and distribution into 384-well plates and subsequent addition to cells. After overnight incubation, MS47134 at 5 X final concentration (3 μM) diluted in DMEM with 1% (v/v) dialyzed FBS were added to cells without replacement of the medium for 18-20 h. On the day of assay, medium and drug solution were dumped and loaded with 20 ul per well of Bright-Glo reagent (Promega). Plates were incubated for 20 min in the dark and the luminescence was counted for cells using SpectraMax Luminescence reader. Dopamine receptor D2 serves as an assay control with 0.1 mM Quinpirole. Data were analyzed using GraphPad Prism 9.0. For MRGPRX1 for which activity was increased to more than 3-fold of basal levels of relative luminescence units, assays were repeated as a full dose–response assay. Activity for MRGPRX1 could not be confirmed, and we dismiss the activity seen in the single-point assay.
Surface expression
Cell surface expression of MRGPRX2 and its mutants (or MRGPRX4 and its mutants) were measured using ELISA chemiluminescence. Briefly, 48-hour post-transfected cells plated in 384 white well plates were fixed with 20 μl per well 4% (v/v) paraformaldehyde for 10 minutes at room temperature. The cells were then washed with 40 μl/well of phosphate buffered saline (PBS) twice then incubated with 20 μl per well 5% (v/v) BSA (bovine serum albumin) in PBS for 1 hour. Cells are incubated with an anti-FLAG–horseradish peroxidase–conjugated antibody (Sigma-Aldrich, A8592) diluted 1/10,000 in 5% (v/v) BSA in PBS for 1 hr at room temperature. After washing five times with 80 μl per well of PBS, 20 μl/well Super Signal Enzyme-Linked Immunosorbent Assay Pico Substrate (Thermo Fisher, #37070) was added to well for the development of signal and the luminescence was counted using a PHERAstar FSX (BMG Labtech). The luminescence signal was analyzed in GraphPad Prism 9.0. and data are normalized to the signal of WT MRGPRX2 (or WT MRGPRX4). Cell surface expression data of MRGPRX2 and MRGPRX4 mutants are shown in Supplementary Fig. 4. Up to a 50% reduction in protein expression for some mutants were observed. To determine how differences in receptor expression will affect the signalling, we transfected the cells with different amount of WT MRGPRX2 pcDNA plasmid (50, 100, 200 and 400 ng). The resulting BRET2 curves of these transfections are nearly identical, with only modest changes of EC50 and Emax values observed (Supplementary Fig. 5), thereby demonstrating that the BRET2 assay is relatively insensitive to protein expression.
Structure activity relationship analysis for ZINC16991592 and X4-1
Preliminary structure activity relationship (SAR) on the antagonist, ZINC16991592 demonstrate that better antagonists can be developed against MRGPRX2 with higher selectivity. We sought to improve the affinity of ZINC16991592 in different scaffold classes. To do so, we used ZINC16991592 as template to search the 28 billion make-on-demand library of the Enamine REAL database employing SmallWorld similarity (https://sw.docking.org/, NextMove Software, Cambridge UK) and arthor substructure (http://arthor.docking.org) search engines. Of the 200,000 analogues resulting from the database search, these were filtered based in Molecular weight < 320 Da and ECFP4-based Tanimoto coefficient (Tc ≥ 0.35) against ZINC16991592. The resulting molecules were manually inspected for favorable changes in the compound with respect to ZINC16991592. During selection of molecules, we explored substitutions both on the pyridine ring as well as the quinazole ring. Substitutions in the pyridine ring involved moving around Nitrogen in the pyridine ring, addition of halogens at ortho, meta or para positions, replacing the pyridine ring with benzene, isoxazole, 1-methylimidazole, thiazole, tetralone, thiophene and furan. Substitutions on the quinazole ring included replacement of 2-sulfanylidene-1,3-dihydroquinazolin-4-one with 1,3 dihydroquinazoline-2,4-dione or making the quinazole ring bigger with addition of another ring. Substitution of the pyridine ring with thiazole (C9) and furan (C9-6) resulted in the most potent and selective antagonist against MRGPRX2. The analogs with substitutions in the quinazole ring showed minimal antagonist activity against MRGPRX2, suggesting a tight SAR around this ring. All the compounds in MRGPRX2 SAR study are purchased from Enamine (Supplementary Data 1). To identify commercially available X4-1 analogs, we used substructure searches on the 2-acetylaminopropanoic acid core in ZINC15. Each substituent vector was systematically held constant or varied in multiple substructure searches to identify analogs, which were then clustered using ECFP4 fingerprints in RDKit. Diverse pharmacophoric feature representatives for each vector were identified for prioritization, using a design of experiment to ensure coverage of combinations. All the compound structures were prepared using ChemDraw 20.0.
Electrophysiology
HEK293 cells were cultured in DMEM with 4.5 g L−1 glucose, L-glutamine, and sodium pyruvate (Mediatech) containing 10% (v/v) FBS (Axenia BioLogix) and 1% (v/v) penicillin-streptomycin, at 37 °C and with 5% CO2. Cells were lifted with trypsin-EDTA (Life Technologies) and passaged to 6-well plates (Warner Instruments) 3-4 d before recording. Transient transfection was performed with Lipofectamine 2000 (Thermo Fisher Scientific) 2 days before recording. The plasmids of human Kir6.2 and SUR1 were the gift from Dr. Show-Ling Shyng (Oregon Health and Science University), and we fused mCherry fluorescent protein to the C-terminus of Kir6.2. The vector ratio for co-transfection of Kir6.2 to SUR1 was 1:10. Before recording, cells were lifted with trypsin-EDTA, kept in modified Tyrode’s saline (140 mM NaCl, 5 mM KCl, 10 mM HEPES, 2 mM CaCl2, 1 mM MgCl2, 10 mM glucose, pH 7.2 ~ 7.3 with HCl), and were used within 8 hours. For recording, an aliquot of cells was transferred to a recording chamber on a Nikon-TE2000 Inverted Scope (Nikon Instruments), and transfection was confirmed with fluorescent microscopy. The pipette solution contained: 145 mM KCl, 1 mM MgCl2, 5 mM EGTA, 2 mM CaCl2, 20 mM HEPES, 0.3 mM K2-ATP and 0.3 mM K2-ADP. Patch borosilicate pipettes (Sutter Instrument) were pulled from a Sutter P-97 puller with resistances of 2–3 MΩ. Data were acquired using a Axopatch 200B amplifier controlled by Clampex 10.2 via Digidata 1550A (Axon Instruments), sampled at 10 kHz, filtered at 2 kHz. Membrane capacitance was around 15 pF. Rs was around 5 MΩ. The membrane potential was held at −80 mV and a ramp to +80 mV (1 mV/ms) was applied every second. Bath was switched to 150 mM KCl, 10 mM HEPES, 2 mM CaCl2, and the chemical to be tested was dissolved in it and puffed with VC3-8xP pressurized perfusion system (ALA Science). For each solution, final pH was adjusted to 7.2 ~ 7.3 with KOH, NaOH or HCl, depending on original pH and the major ion. The osmolality of each solution was 290–310 mOsm/kg. All recordings were performed at room temperature (22 –24°C). All chemicals without notes were purchased from Sigma-Aldrich.
Extended Data
Extended Data Fig. 1 |. MRGPRX2 transducerome screening using TRUPATH.
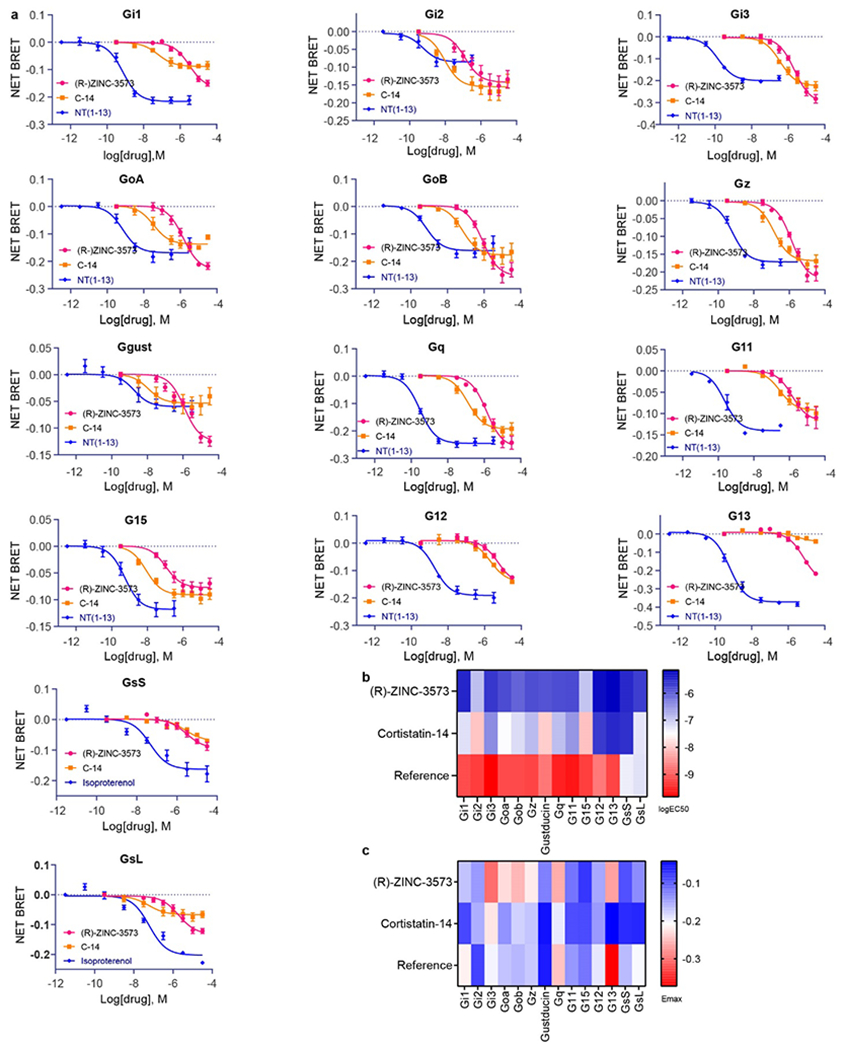
a, MRGPRX2 effectively couples to 14 distinct G proteins upon stimulation of agonists (R)-ZINC-3573 and cortistatin-14 (C-14) in HEK293T cells. Net BRET values of MRGPRX2 together with positive controls of either neurotensin-1 receptor (NTSR1, agonist NT1-13) or β2AR (agonist isoproterenol) are shown in each panel. Data represent mean ± SEM of n = 3 biological replicates. b, Heatmap of the relative potency (logEC50) of (R)-ZINC-3573 and cortistatin-14 for 14 distinct G proteins. c, Heatmap of the relative efficacy (Emax) of (R)-ZINC-3573 and cortistatin-14 for 14 distinct G proteins.
Extended Data Fig. 2 |. CryoEM images and data-processing of MRGPRX2-Gq-(R)-ZINC-3573, MRGPRX2-Gi-(R)-ZINC-3573 and MRGPRX4-Gq-MS47134 complex.
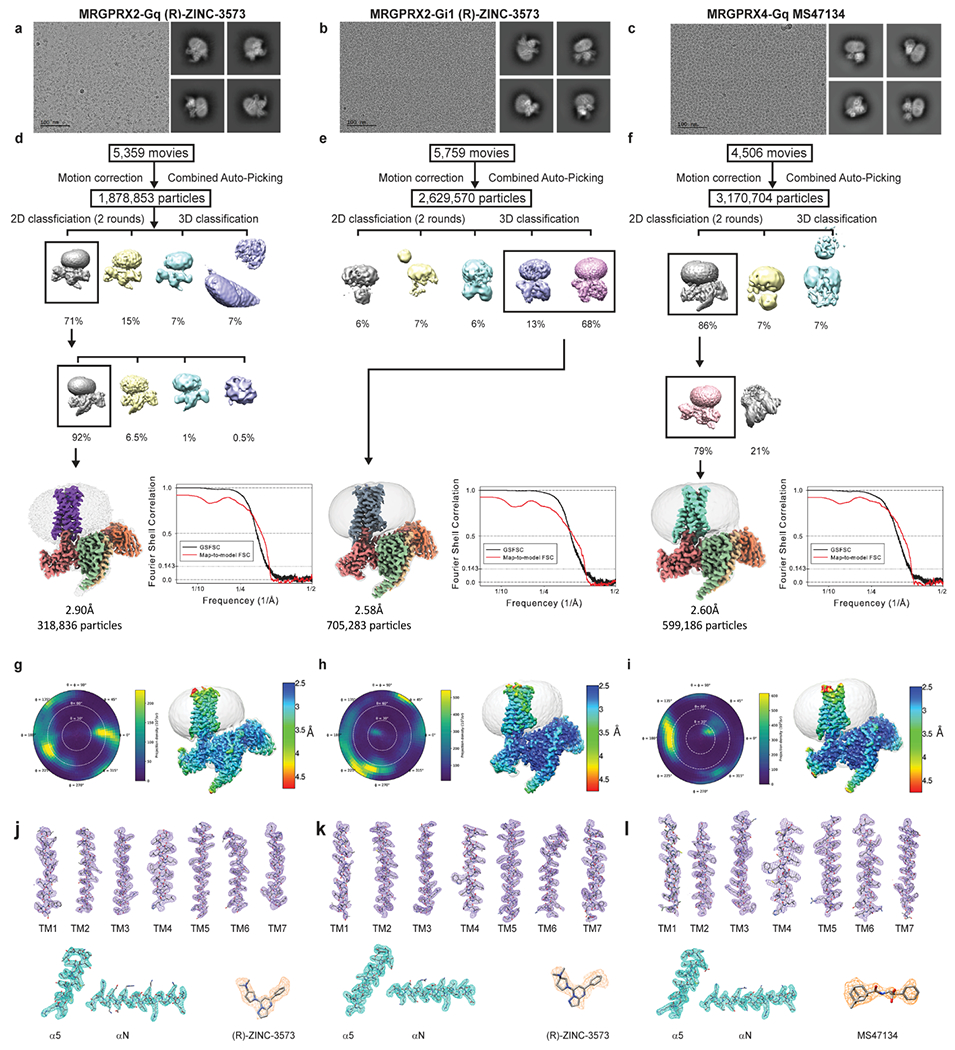
a-c, Representative motion corrected cryo-EM micrographs (scale bar, 100 nm) of respective ligand bound GPCR heterotrimeric complex particles imaged at a nominal 45k x magnification and representative two-dimensional class averages. The experiment was repeated three times with similar result. The exact number of movies and particles used for each complex are shown in the flow chart. d-f, Flow chart of cryo-EM data processing, GSFSC plot of auto-masked final map (black) and map-to-model real-space cross correlation (red) as calculated form phenix.mtriage. g-i, Respective polar plots of particle angular distributions and local resolution estimations heat maps. j-l, Local cryo-EM density maps of TM1-7, respective ligands, and α5 and αN helix of respective G-protein.
Extended Data Fig. 3 |. CryoEM images and data-processing of MRGPRX2-Gq-Cortistatin-14 and MRGPRX2-Gi1-Cortistatin-14 complex.
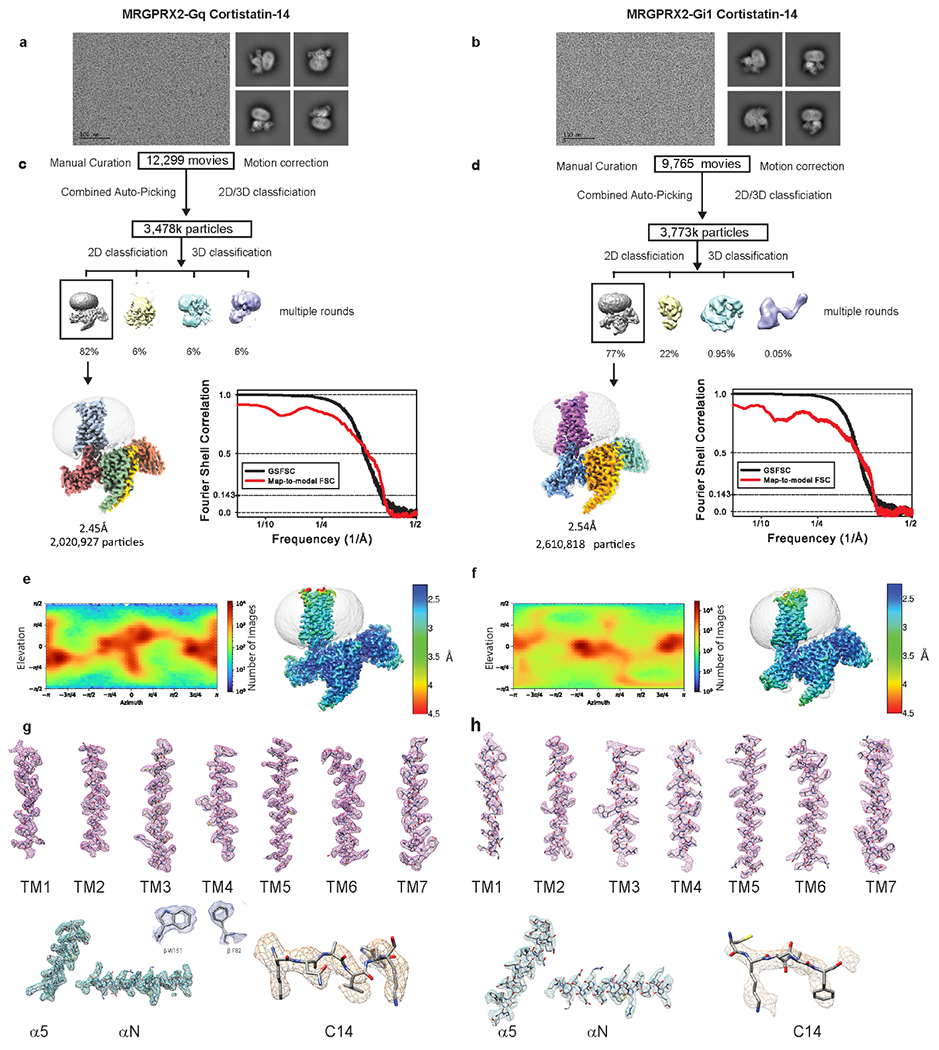
a-b, Representative motion corrected cryo-EM micrograph (scale bar, 100 nm) of MRGPRX2 G-protein cortistatin-14 (C14) particles imaged at a nominal 45k x magnification and representative two-dimensional class averages. The experiment was repeated three times with similar result. The exact number of movies and particles used for each complex are shown in the flow chart. c-d, Flow chart of cryo-EM data processing. GSFSC plot of auto-masked final map (black) and map-to-model real-space cross correlation (red) as calculated form phenix.mtriage. e-f, Viewing direction distribution and local resolution estimation heat maps. g-h, Local cryo-EM density maps of TM1-7, Cortistatin-14 ligand, α5 and α N helix of respective G-protein. Also shown inset are residues W151 and F82 of the b-subunit (blue).
Extended Data Fig. 4 |. Structural comparison of Gq- and Gi-coupled MRGPRX2 complex.
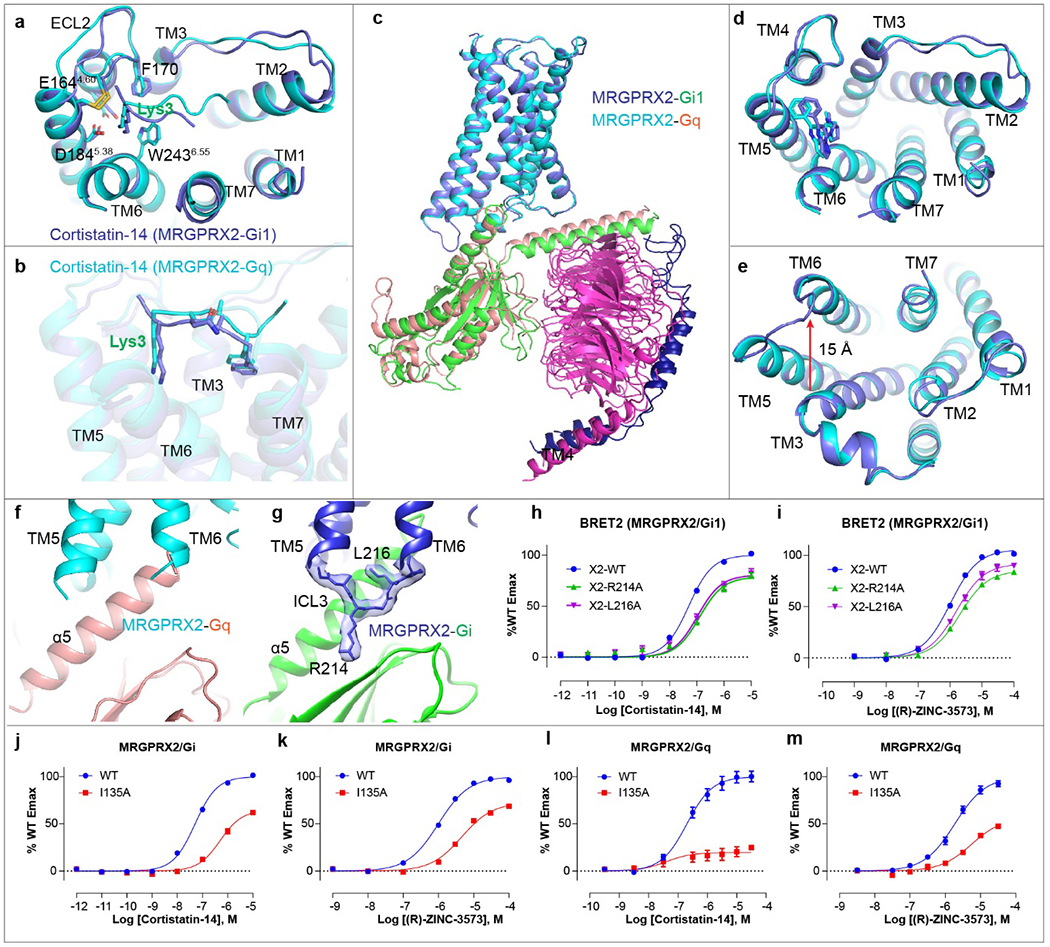
a-b, Structural comparison of the MRGPRX2-Gi1-cortistatin-14 complex (blue) with MRGPRX2-Gq-cortistatin-14 complex (cyan). Top view for the key interactions in sub-pocket 1 (a). Side view to show the overall conformational of cortistatin-14 (b). c-e, structural comparison of MRGPRX2-Gi1-(R)-ZINC-3573 complex with MRGPRX2-Gq-(R)-ZINC-3573 complex. Gi1 and Gq are shown in green and salmon, respectively. Gi1 coupled MRGPRX2 and Gq coupled MRGPRX2 are shown in blue and cyan, respectively. Side view of the whole complex (c), top view (d) and bottom view (e) of MRGPRX2. f, ICL3 of Gq is not clearly resolved in the Gq-coupled MRGPRX2 complex. g, Close up view of the ICL3 in the Gi1-coupled MRGPRX2 structure with surrounding EM map at a threshold of 0.14. h-i, MRGPRX2 ICL3 mutations R214ICL3A and L216ICL3A impairs cortistatin-14 (h) and (R)-ZINC-3573 (i) stimulated Gi1 activation. Data represent mean ± SEM of n = 3 biological replicates. j-k, BRET2 Gi assays reveal that I135ICL2A mutation of MRGPRX2 attenuate cortistatin-14 (j) and (R)-ZINC-3573 (k) stimulated Gi1 activation. Data represent mean ± SEM of n = 3 biological replicates. l-m, BRET2 Gq assays reveal that I135ICL2A mutation of MRGPRX2 greatly reduced cortistatin-14 (l) and (R)-ZINC-3573 (m) stimulated Gq activation. Data represent mean ± SEM of n = 3 biological replicates.
Extended Data Fig. 5 |. Non-conserved motifs in Mas-related GPCRs and the critical role of acidic residues E1644.60 and D1845.38 in MRGPRX2 activation.
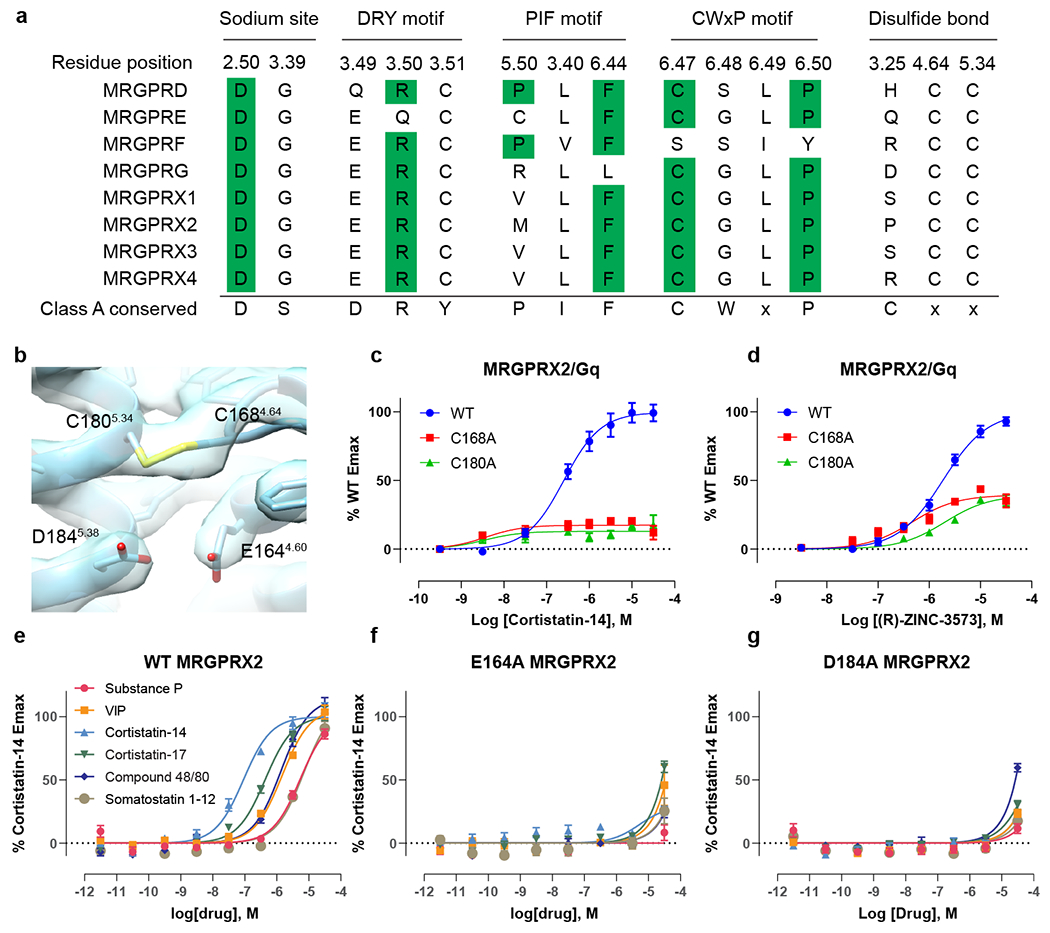
a, Sequence alignment of the key residues in sodium site, DRY motif, PIF motif and CWxP motif, as well as residues involved in disulfide bond formation in Mas-related GPCRs. Class A conserved residues are highlighted in green. b, cryoEM map of the TM4-TM5 disulfide bond in MRGPRX2-Gq-(R)-ZINC-3573 complex. c-d, Break of the TM4-TM5 disulfide bond by C1684.64A and C1805.34A mutations abolishes the cortistatin-14 stimulated Gq activation (c) and reduced the Emax of (R)-ZINC-3573 stimulated Gq activation by 60% (d). Data represent mean ± SEM of n = 3 biological replicates. e-g, Compared with WT (e), E1644.60A (f) and D1845.38A (g) totally abolish the peptide stimulated Gq activation of MRGPRX2. Data represent mean ± SEM of n = 3 biological replicates.
Extended Data Fig. 6 |. Unique structural features of MRGPRX2 and MRGPR4.
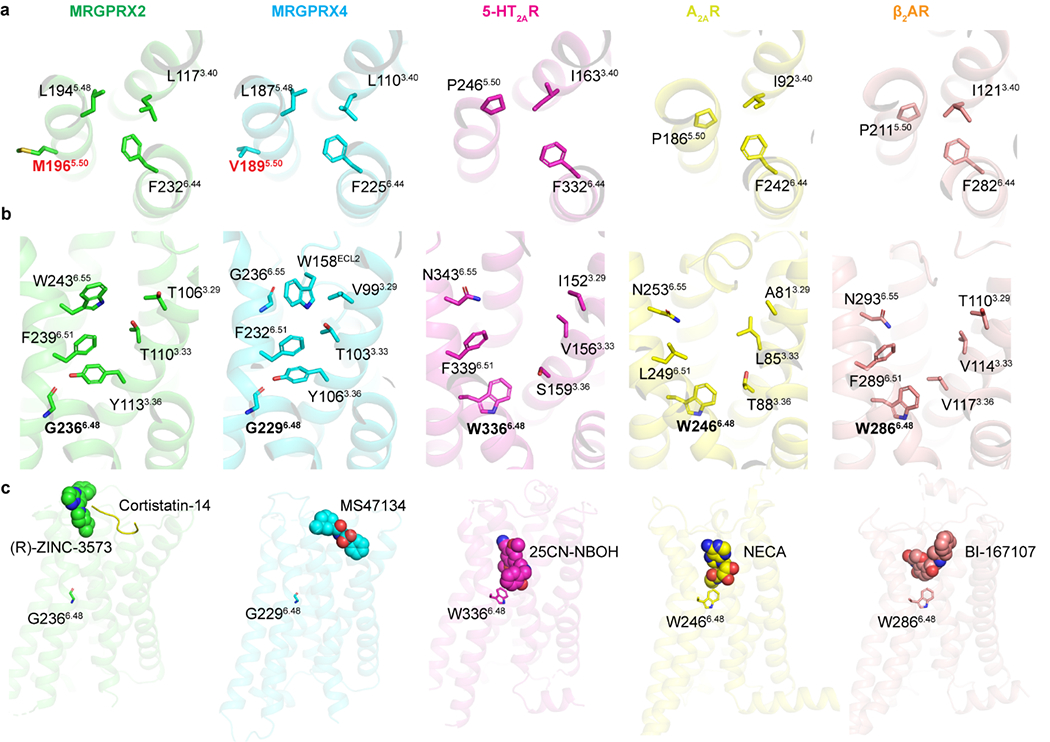
a, MRGPRX2 and MRGPRX4 have a unique structural arrangement at the PIF motif compared to the G protein coupled active structures of 5-HT2AR (PDB ID 6WHA), A2AR (PDB ID 5G53) and β2AR (PDB ID 3SN6). Residue 5.50 shifts away from the TM3-TM6 interface and does not engage L3.40 and F6.44 in MRGPRX2 and MRGPRX4. b, With G6.48, TM6 of both MRGPRX2 and MRGPRX4 packs closer to TM3 compared to the G protein coupled active structures of 5-HT2AR (PDB ID 6WHA), A2AR (PDB ID 5G53) and β2AR (PDB ID 3SN6), leading to an occluded canonical agonist binding pocket. c, (R)-ZINC-3573, cortistatin-14 and MS47134 bind to MRGPRX2 and MRGPRX4 at a position that is far away from residue 6.48, respectively. Cortistatin-14 is shown as cartoon. Small molecule compounds of receptors are shown as spheres.
Extended Data Fig. 7 |. Analog screening and functional characterization of MRGPRX2 antagonists.
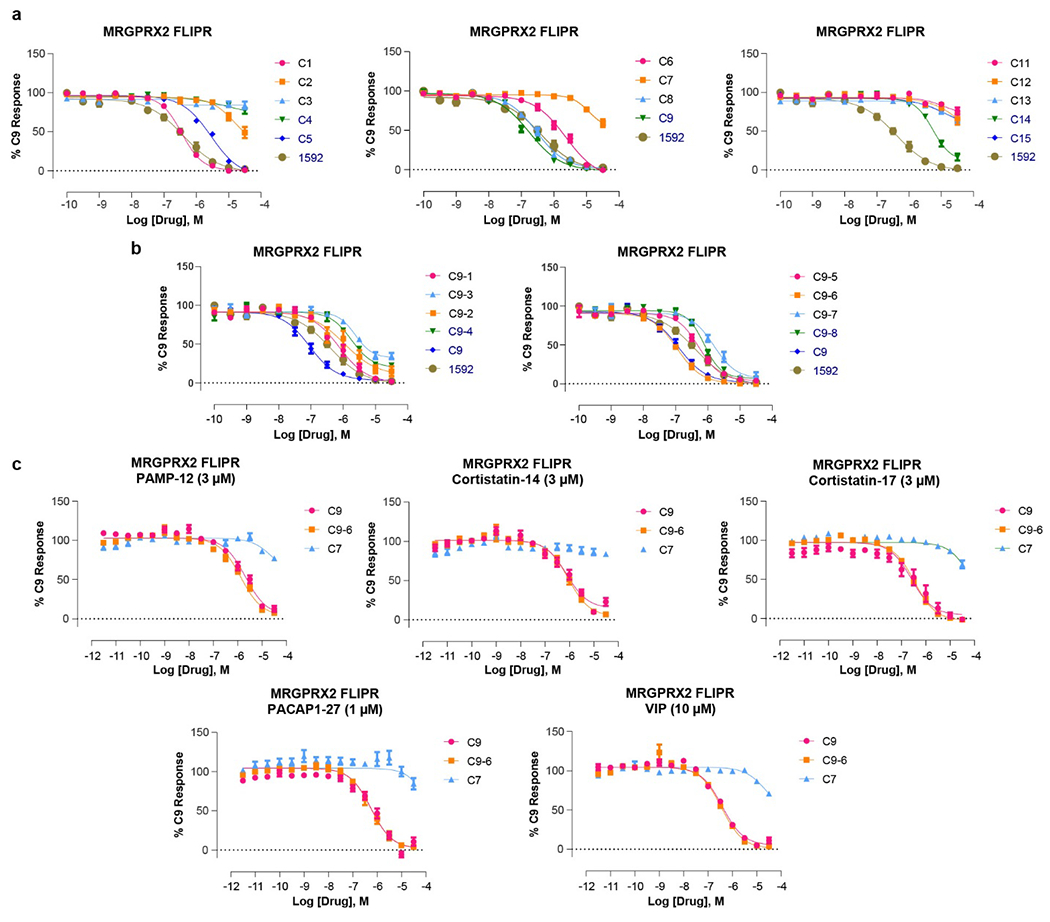
a-b, Dose response curves of initial 14 analogs of ‘1592 (a) and 8 analogs of C9 (b) in the presence of EC80 concentration of (R)-ZINC-3573 using MRGPRX2 FLIPR Ca2+ assay. Data represent mean ± SEM of n = 3 biological replicates. c, Dose-response curves of two potent MRGPRX2 antagonists C9 and C9-6 and an inactive compound C7 in the presence of EC80 of each MRGPRX2 peptides using MRGPRX2 FLIPR Ca2+ assay. Data represent mean ± SEM of n = 3 biological replicates.
Extended Data Fig. 8 |. Functional characterization of optimized MRGPRX4 agonists.
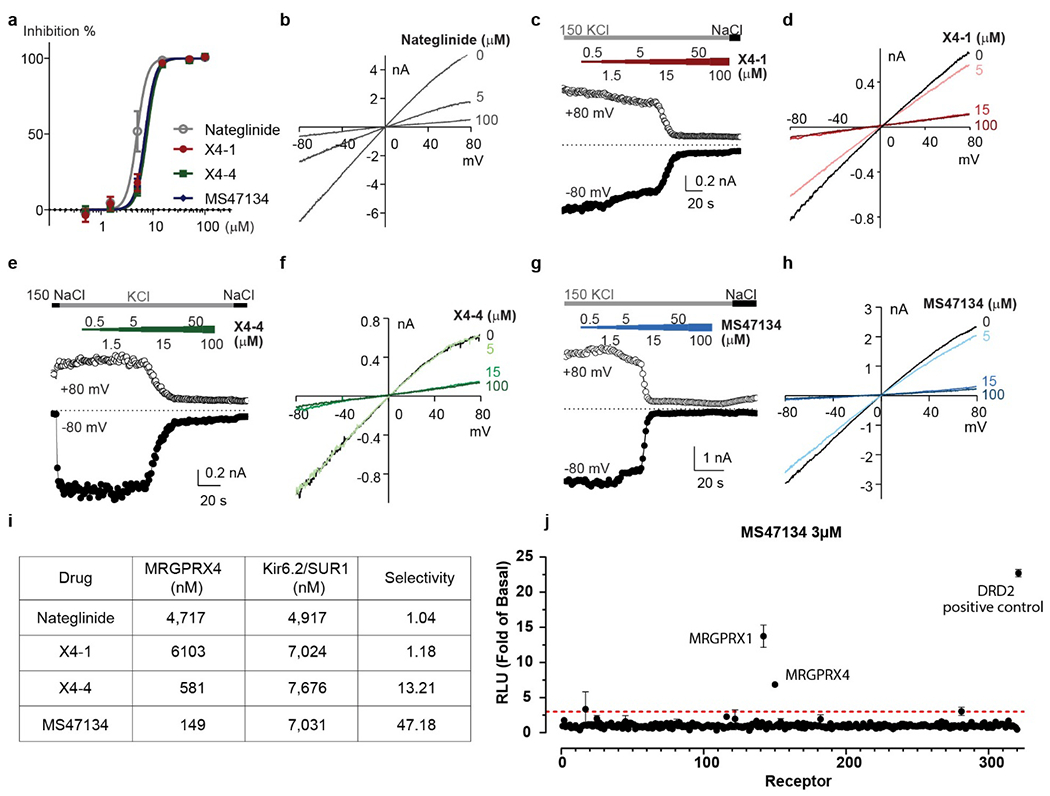
a, Dose-response curves of Kir6.2/SUR1 current inhibition by indicated chemicals. Data represent mean ± SEM from n=4 biological replicates. b, d, f, h. Current-voltage relationships of whole-cell traces recorded in 150 mM KCl with the supplements of indicated chemicals of the labeled concentrations. c, e, g, Time courses showing the whole-cell-current responses to the indicated chemicals of the labeled concentrations. i, MRGPRX4 agonists X4-4 and MS47134 have a higher selectivity over Kir6.2/SUR1 channel compared to nateglinide. j, Screening of MS47134 across the GPCRome (at 320 receptors) using the PRESTO-Tango platform with 3 μM MS47134. Red dashed line indicated threefold of basal levels. Data represent mean ± SEM of fold over basal for each receptor (n=4 technical replicates).
Extended Data Fig. 9 |. Structural comparison of Gq-coupled MRGPRX2 and MRGPRX4.
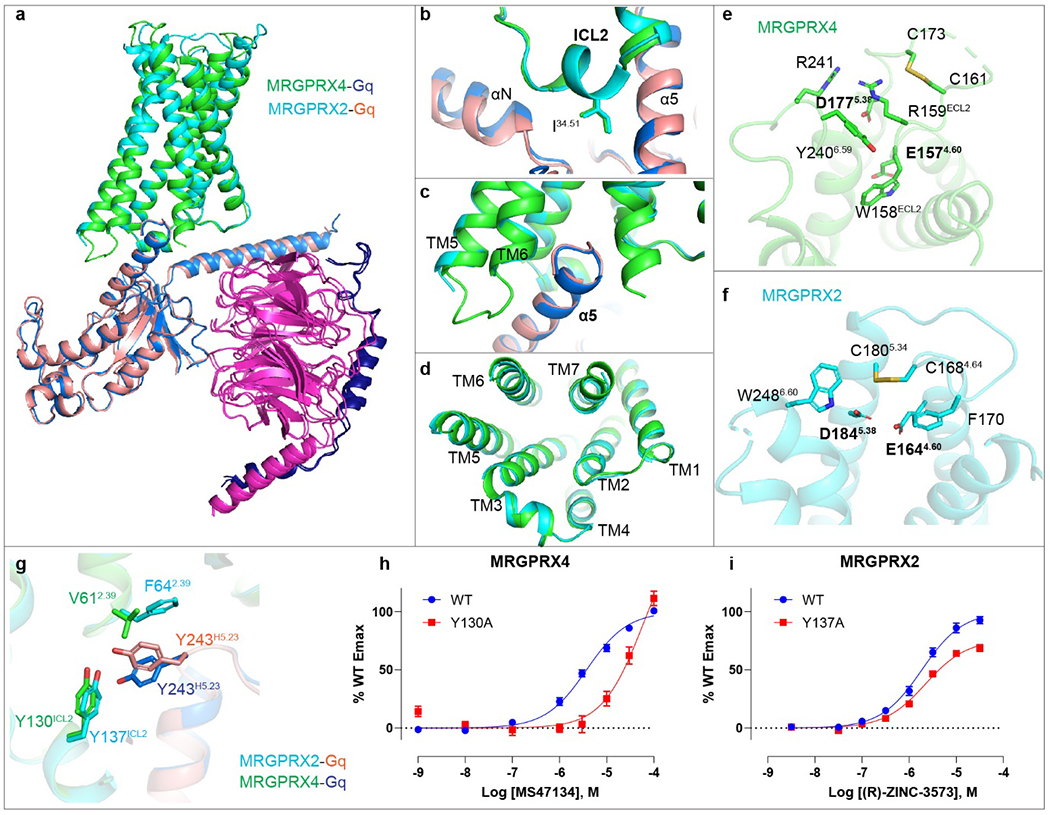
a-d, Structural comparison of the MRGPRX4-Gq-MS47134 complex with the MRGPRX2-Gq-(R)-ZINC-3573. The receptor and Gq protein of MRGPRX4-Gq complex are colored by green and blue, respectively. The receptor and Gq protein of MRGPRX2-Gq complex are colored by cyan and salmon, respectively. Side view (a), close up view of αN-ICL2 interaction region (b), α5 helix region (c), and the cytoplasmic side of receptors (d). e, The acidic residues E1574.60 and D1775.38 of MRGPRX4 are shielded by the inserted ECL2. Side chain of D177 is not resolved but modeled here for a better visual interpretation. f, Residues E1644.60 and D1845.38 of MRGPRX2 extend to the cationic agonists accessible pocket. g, Due to the variance in residue 2.39, Y243H5.23 of Gq adopts different side-chain conformations to interact with Y130ICL2 of MRGPRX4 and Y137ICL2 of MRGPRX2. h-i, BRET2 Gq assays for Y130ICL2A of MRGPRX4 (h) and Y137ICL2A of MRGPRX2 (i). Data represent mean ± SEM of n = 3 biological replicates.
Extended Data Table 1 |.
Cryo-EM data collection, refinement and validation statistics
| MRGPRX2-Gq Cortistatin-14 (EMD-24896) (PDB 7S8L) | MRGPRX2-Gi Cortistatin-14 (EMD-24897) (PDB 7S8M) | MRGPRX2-Gq (R)-Zinc-3573 (EMD-24898) (PDB 7S8N) | MRGPRX2-Gi (R)-Zinc-3573 (EMD-24899) (PDB 7S80) | MRGPRX4-Gq MS47134 (EMD-24900) (PDB 7S8P) | |
|---|---|---|---|---|---|
| Data collection and processing | |||||
| Magnification | 45,000 | 45,000 | 45,000 | 45,000 | 45,000 |
| Voltage (kV) | 200 | 200 | 200 | 200 | 200 |
| Electron exposure (e−/Å2) | 50.7 & 47.9 | 42.2 & 46.1 | 50.6 | 48.8 | 48.8 |
| Number of movies used | 12,299 | 9,765 | 5,359 | 5,759 | 4,506 |
| Defocus mean (SD) μm1 | 1.2 (0.5) | 1.3 (1.1) | 1.9 (0.5) | 1.5 (0.8) | 1.4 (0.4) |
| Pixel size (Å) | 0.91 | 0.91 | 0.91 | 0.91 | 0.91 |
| Symmetry imposed | C1 | C1 | C1 | C1 | C1 |
| Initial particle images (no.) | 3,478,202 | 3,733,419 | 1,878,853 | 2,629,570 | 3,170,704 |
| Final particle images (no.) | 2,029,927 | 2,610,818 | 318,836 | 705,283 | 599,186 |
| Map resolution (Å)2 | 2.45 | 2.54 | 2.90 | 2.58 | 2.60 |
| FSC threshold 0.143 | 0.143 | 0.143 | 0.143 | 0.143 | 0.143 |
| Map resolution range (Å) | 2.11-5.22 | 2.18-4.91 | 2.55-5.32 | 2.27-4.85 | 2.25-6.05 |
| Refinement | |||||
| Initial model used (PDB code) | 6WHA | 6PT0 | 6WHA | 6PT0 | 6WHA |
| Model resolution (Å) | 2.74 | 2.83 | 3.13 | 2.86 | 2.87 |
| FSC threshold | 0.5 | 0.5 | 0.5 | 0.5 | 0.5 |
| Map sharpening B factor (Å2) | −89.8 | −107.1 | −106.5 | −94 | −88.6 |
| Model composition | |||||
| Non-hydrogen atoms | 8177 | 8346 | 8154 | 8331 | 8093 |
| Protein residues | 1096 | 1102 | 1090 | 1101 | 1089 |
| Ligands | / | / | 1 | 1 | 1 |
| B factors (Å2) | |||||
| Protein | 48.64 | 52.94 | 63.61 | 50.48 | 120.78 |
| Ligand | / | / | 66.89 | 56.81 | 172.98 |
| R.m.s. deviations | |||||
| Bond lengths (Å) | 0.003 | 0.004 | 0.011 | 0.005 | 0.005 |
| Bond angles (°) | 0.550 | 0.583 | 0.879 | 0.698 | 0.725 |
| Validation | |||||
| MolProbity score | 1.27 | 1.64 | 1.55 | 1.50 | 1.49 |
| Clashscorc | 2.51 | 6.45 | 4.10 | 3.12 | 3.12 |
| Poor rotamers (%) | 0.00 | 0.00 | 0.00 | 0.00 | 0.00 |
| Ramachandran plot | |||||
| Favored (%) | 96.46 | 95.93 | 94.86 | 94.18 | 94.21 |
| Allowed (%) | 3.54 | 4.07 | 5.14 | 5.82 | 5.79 |
| Disallowed (%) | 0.00 | 0.00 | 0.00 | 0.00 | 0.00 |
underfocus positive
Resolution estimates from cryoSPARC auto-corrected GSFSC
Supplementary Material
Acknowledgements
This work was supported by NIH grants U24DA116195 (to B.L.R., B.K.S. and J.J) and R35GM122481 (to BKS), and by the Michael Hooker Distinguished Professorship to B.L.R. and NIH grant R01-DK121969, R01-DK121032 and R56-AI139620 to S.N.A. We thank Jared Peck and Dr. Joshua Strauss of the UNC CryoEM Core Facility for technical assistance in this project. W.Y. is partially supported by Program for Breakthrough Biomedical Research funded by the Sandler Foundation, University of California, San Francisco. L.Y.J. is a Howard Hughes Medical Institute investigator. The plasmids encoding human Kir6.2 and SUR1 were the gifts from Dr. Show-Ling Shyng (Oregon Health and Science University). We thank Dr. Show-Ling Shyng for her generosity of sharing the vectors. The Titan X Pascal used for this research was kindly donated to J.F.F. by the NVIDIA Corporation.
Footnotes
Competing interests
A patent describing the MRGPRX2 antagonists has been filed by UCSF listing B.L.R., B.K.S., C.C., I.S., and H.J.K. as inventors.
Supplementary information is available for this paper.
Data availability
The coordinate and cryoEM map of MRGPRX2-Gq-cortistatin-14, MRGPRX2-Gi1-cortistatin-14, MRGPRX2-Gq-(R)-ZINC-3573, MRGPRX2-Gi1-(R)-ZINC-3573 and MRGPRX4-Gq-MS47134 have been deposited to PDB and EMDB with accession code 7S8L (EMD-24896), 7S8M (EMD-24897), 7S8N (EMD-24898), 7S8O (EMD-24899) and 7S8P (EMD-24900), respectively. The cryoEM micrographs of MRGPRX4-Gq-MS47134, MRGPRX2-Gq-cortistatin-14, MRGPRX2-Gq-(R)-ZINC-3573, MRGPRX2-Gi1-cortistatin-14 and MRGPRX2-Gi1-(R)-ZINC-3573 have been deposited to EMPIAR database with accession number of EMPIAR-10852, EMPIAR-10853, EMPIAR-10854, EMPIAR-10855 and EMPIAR-10856, respectively. The MRGPRX2 antagonist C9 and C9-6 and negative control C7 and the MRGPRX4 agonist MS47134 and negative control X2-2 will be made available via Sigma-Millipore.
References
- 1.Zylka MJ, Dong X, Southwell AL & Anderson DJ Atypical expansion in mice of the sensory neuron-specific Mrg G protein-coupled receptor family. Proc Natl Acad Sci U S A 100, 10043–10048, doi: 10.1073/pnas.1732949100 (2003). [DOI] [PMC free article] [PubMed] [Google Scholar]
- 2.McNeil BD et al. Identification of a mast-cell-specific receptor crucial for pseudo-allergic drug reactions. Nature 519, 237–241, doi: 10.1038/nature14022 (2015). [DOI] [PMC free article] [PubMed] [Google Scholar]
- 3.Green DP, Limjunyawong N, Gour N, Pundir P & Dong X A Mast-Cell-Specific Receptor Mediates Neurogenic Inflammation and Pain. Neuron 101, 412–420 e413, doi: 10.1016/j.neuron.2019.01.012 (2019). [DOI] [PMC free article] [PubMed] [Google Scholar]
- 4.Yu H et al. MRGPRX4 is a bile acid receptor for human cholestatic itch. Elife 8, doi: 10.7554/eLife.48431 (2019). [DOI] [PMC free article] [PubMed] [Google Scholar]
- 5.Meixiong J, Vasavda C, Snyder SH & Dong X MRGPRX4 is a G protein-coupled receptor activated by bile acids that may contribute to cholestatic pruritus. Proc Natl Acad Sci U S A 116, 10525–10530, doi: 10.1073/pnas.1903316116 (2019). [DOI] [PMC free article] [PubMed] [Google Scholar]
- 6.Chompunud Na Ayudhya C, Roy S, Alkanfari I, Ganguly A & Ali H Identification of Gain and Loss of Function Missense Variants in MRGPRX2’s Transmembrane and Intracellular Domains for Mast Cell Activation by Substance P. Int J Mol Sci 20, doi: 10.3390/ijms20215247 (2019). [DOI] [PMC free article] [PubMed] [Google Scholar]
- 7.Ikoma A, Steinhoff M, Stander S, Yosipovitch G & Schmelz M The neurobiology of itch. Nat Rev Neurosci 7, 535–547, doi: 10.1038/nrn1950 (2006). [DOI] [PubMed] [Google Scholar]
- 8.Greaves MW & Wall PD Pathophysiology of itching. Lancet 348, 938–940, doi: 10.1016/s0140-6736(96)04328-0 (1996). [DOI] [PubMed] [Google Scholar]
- 9.Liu Q et al. Sensory neuron-specific GPCR Mrgprs are itch receptors mediating chloroquine-induced pruritus. Cell 139, 1353–1365, doi: 10.1016/j.cell.2009.11.034 (2009). [DOI] [PMC free article] [PubMed] [Google Scholar]
- 10.Lembo PM et al. Proenkephalin A gene products activate a new family of sensory neuron--specific GPCRs. Nature neuroscience 5, 201–209, doi: 10.1038/nn815 (2002). [DOI] [PubMed] [Google Scholar]
- 11.Azimi E et al. Dual action of neurokinin-1 antagonists on Mas-related GPCRs. JCI Insight 1, e89362, doi: 10.1172/jci.insight.89362 (2016). [DOI] [PMC free article] [PubMed] [Google Scholar]
- 12.Kroeze WK et al. PRESTO-Tango as an open-source resource for interrogation of the druggable human GPCRome. Nature structural & molecular biology 22, 362–369, doi: 10.1038/nsmb.3014 (2015). [DOI] [PMC free article] [PubMed] [Google Scholar]
- 13.Lansu K et al. In silico design of novel probes for the atypical opioid receptor MRGPRX2. Nat Chem Biol 13, 529–536, doi: 10.1038/nchembio.2334 (2017). [DOI] [PMC free article] [PubMed] [Google Scholar]
- 14.Subramanian H et al. β-Defensins activate human mast cells via Mas-related gene X2. J Immunol 191, 345–352, doi: 10.4049/jimmunol.1300023 (2013). [DOI] [PMC free article] [PubMed] [Google Scholar]
- 15.Olsen RHJ et al. TRUPATH, an open-source biosensor platform for interrogating the GPCR transducerome. Nat Chem Biol, doi: 10.1038/s41589-020-0535-8 (2020). [DOI] [PMC free article] [PubMed] [Google Scholar]
- 16.English JG et al. VEGAS as a Platform for Facile Directed Evolution in Mammalian Cells. Cell 178, 748–761 e717, doi: 10.1016/j.cell.2019.05.051 (2019). [DOI] [PMC free article] [PubMed] [Google Scholar]
- 17.Wacker D et al. Structural features for functional selectivity at serotonin receptors. Science (New York, N.Y.) 340, 615–619, doi: 10.1126/science.1232808 (2013). [DOI] [PMC free article] [PubMed] [Google Scholar]
- 18.Lu L, Kulka M & Unsworth LD Peptide-mediated mast cell activation: ligand similarities for receptor recognition and protease-induced regulation. J Leukoc Biol 102, 237–251, doi: 10.1189/jlb.3RU1216-539R (2017). [DOI] [PubMed] [Google Scholar]
- 19.Che T et al. Structure of the Nanobody-Stabilized Active State of the Kappa Opioid Receptor. Cell 172, 55–67 e15, doi: 10.1016/j.cell.2017.12.011 (2018). [DOI] [PMC free article] [PubMed] [Google Scholar]
- 20.Che T et al. Nanobody-enabled monitoring of kappa opioid receptor states. Nature communications 11, 1145, doi: 10.1038/s41467-020-14889-7 (2020). [DOI] [PMC free article] [PubMed] [Google Scholar]
- 21.Rasmussen SGF et al. Crystal structure of the β2 adrenergic receptor–Gs protein complex. Nature 477, 549–555, doi: 10.1038/nature10361 (2011). [DOI] [PMC free article] [PubMed] [Google Scholar]
- 22.Rosenbaum DM et al. GPCR engineering yields high-resolution structural insights into beta2-adrenergic receptor function. Science 318, 1266–1273 (2007). [DOI] [PubMed] [Google Scholar]
- 23.Ogasawara H, Furuno M, Edamura K & Noguchi M Novel MRGPRX2 antagonists inhibit IgE-independent activation of human umbilical cord blood-derived mast cells. J Leukoc Biol 106, 1069–1077, doi: 10.1002/JLB.2AB1018-405R (2019). [DOI] [PubMed] [Google Scholar]
- 24.Shinkai H et al. N-(cyclohexylcarbonyl)-D-phenylalanines and related compounds. A new class of oral hypoglycemic agents. 2. Journal of medicinal chemistry 32, 1436–1441, doi: 10.1021/jm00127a006 (1989). [DOI] [PubMed] [Google Scholar]
- 25.Irwin JJ & Shoichet BK ZINC--a free database of commercially available compounds for virtual screening. Journal of chemical information and modeling 45, 177–182, doi: 10.1021/ci049714+ (2005). [DOI] [PMC free article] [PubMed] [Google Scholar]
- 26.Meixiong J et al. Identification of a bilirubin receptor that may mediate a component of cholestatic itch. Elife 8, doi: 10.7554/eLife.44116 (2019). [DOI] [PMC free article] [PubMed] [Google Scholar]
- 27.Azimi E, Reddy VB & Lerner EA Brief communication: MRGPRX2, atopic dermatitis and red man syndrome. Itch (Phila) 2, doi: 10.1097/itx.0000000000000005 (2017). [DOI] [PMC free article] [PubMed] [Google Scholar]
- 28.Chen E et al. Inflamed ulcerative colitis regions associated to MRGPRX2-mediated mast cell degranulation and cell activation modules, defining a new therapeutic target. Gastroenterology, doi: 10.1053/j.gastro.2020.12.076 (2021). [DOI] [PMC free article] [PubMed] [Google Scholar]
- 29.Kozlitina J et al. An African-specific haplotype in MRGPRX4 is associated with menthol cigarette smoking. PLoS Genet 15, e1007916, doi: 10.1371/journal.pgen.1007916 (2019). [DOI] [PMC free article] [PubMed] [Google Scholar]
- 30.Li Z et al. Targeting human Mas-related G protein-coupled receptor X1 to inhibit persistent pain. Proceedings of the National Academy of Sciences of the United States of America 114, E1996–E2005, doi: 10.1073/pnas.1615255114 (2017). [DOI] [PMC free article] [PubMed] [Google Scholar]
- 31.Thapaliya M, Chompunud Na Ayudhya C, Amponnawarat A, Roy S & Ali H Mast Cell-Specific MRGPRX2: a Key Modulator of Neuro-Immune Interaction in Allergic Diseases. Curr Allergy Asthma Rep 21, 3, doi: 10.1007/s11882-020-00979-5 (2021). [DOI] [PMC free article] [PubMed] [Google Scholar]
- 32.Kim K et al. STRUCTURE OF A HALLUCINOGEN ACTIVATED Gq-COUPLED 5-HT2A SEROTONIN RECEPTOR. Cell 182, 1574–1588.e1519., doi: 10.1016/j.cell.2020.08.024. (2020). [DOI] [PMC free article] [PubMed] [Google Scholar]
- 33.Draper-Joyce CJ et al. Structure of the adenosine-bound human adenosine A1 receptor-Gi complex. Nature 558, 559–563, doi: 10.1038/s41586-018-0236-6 (2018). [DOI] [PubMed] [Google Scholar]
- 34.Koehl A et al. Structure of the micro-opioid receptor-Gi protein complex. Nature 558, 547–552, doi: 10.1038/s41586-018-0219-7 (2018). [DOI] [PMC free article] [PubMed] [Google Scholar]
- 35.Mastronarde DN Automated electron microscope tomography using robust prediction of specimen movements. J Struct Biol 152, 36–51, doi: 10.1016/j.jsb.2005.07.007 (2005). [DOI] [PubMed] [Google Scholar]
- 36.Punjani A, Rubinstein JL, Fleet DJ & Brubaker MA cryoSPARC: algorithms for rapid unsupervised cryo-EM structure determination. Nat Methods 14, 290–296, doi: 10.1038/nmeth.4169 (2017). [DOI] [PubMed] [Google Scholar]
- 37.Punjani A, Zhang H & Fleet DJ Non-uniform refinement: adaptive regularization improves single-particle cryo-EM reconstruction. Nat Methods 17, 1214–1221, doi: 10.1038/s41592-020-00990-8 (2020). [DOI] [PubMed] [Google Scholar]
- 38.Bepler T, Kelley K, Noble AJ & Berger B Topaz-Denoise: general deep denoising models for cryoEM and cryoET. Nat Commun 11, 5208, doi: 10.1038/s41467-020-18952-1 (2020). [DOI] [PMC free article] [PubMed] [Google Scholar]
- 39.Rosenthal PB & Henderson R Optimal determination of particle orientation, absolute hand, and contrast loss in single-particle electron cryomicroscopy. J Mol Biol 333, 721–745, doi: 10.1016/j.jmb.2003.07.013 (2003). [DOI] [PubMed] [Google Scholar]
- 40.Heymann JB & Belnap DM Bsoft: image processing and molecular modeling for electron microscopy. J Struct Biol 157, 3–18, doi: 10.1016/j.jsb.2006.06.006 (2007). [DOI] [PubMed] [Google Scholar]
- 41.Sanchez-Garcia R et al. DeepEMhacer: a deep learning solution for cryo-EM volume post-processing. bioRxiv (2020). [DOI] [PMC free article] [PubMed] [Google Scholar]
- 42.Grant T, Rohou A & Grigorieff N cisTEM, user-friendly software for single-particle image processing. Elife 7, doi: 10.7554/eLife.35383 (2018). [DOI] [PMC free article] [PubMed] [Google Scholar]
- 43.Xing C et al. Cryo-EM Structure of the Human Cannabinoid Receptor CB2-Gi Signaling Complex. Cell 180, 645–654 e613, doi: 10.1016/j.cell.2020.01.007 (2020). [DOI] [PMC free article] [PubMed] [Google Scholar]
- 44.Pettersen EF et al. UCSF Chimera--a visualization system for exploratory research and analysis. J Comput Chem 25, 1605–1612, doi: 10.1002/jcc.20084 (2004). [DOI] [PubMed] [Google Scholar]
- 45.Emsley P & Cowtan K Coot: model-building tools for molecular graphics. Acta Crystallogr D Biol Crystallogr 60, 2126–2132, doi: 10.1107/S0907444904019158 (2004). [DOI] [PubMed] [Google Scholar]
- 46.Adams PD et al. PHENIX: a comprehensive Python-based system for macromolecular structure solution. Acta Crystallogr D Biol Crystallogr 66, 213–221, doi: 10.1107/S0907444909052925 (2010). [DOI] [PMC free article] [PubMed] [Google Scholar]
- 47.Robertson MJ, van Zundert GCP, Borrelli K & Skiniotis G GemSpot: A Pipeline for Robust Modeling of Ligands into Cryo-EM Maps. Structure 28, 707–716 e703, doi: 10.1016/j.str.2020.04.018 (2020). [DOI] [PMC free article] [PubMed] [Google Scholar]
- 48.Chen VB et al. MolProbity: all-atom structure validation for macromolecular crystallography. Acta Crystallogr D Biol Crystallogr 66, 12–21, doi: 10.1107/S0907444909042073 (2010). [DOI] [PMC free article] [PubMed] [Google Scholar]
- 49.Besnard J et al. Automated design of ligands to polypharmacological profiles. Nature 492, 215-+, doi: 10.1038/nature11691 (2012). [DOI] [PMC free article] [PubMed] [Google Scholar]
- 50.Kroeze WK et al. PRESTO-Tango as an open-source resource for interrogation of the druggable human GPCRome. Nature structural & molecular biology 22, 362–U328, doi: 10.1038/nsmb.3014 (2015). [DOI] [PMC free article] [PubMed] [Google Scholar]
- 51.Longo PA, Kavran JM, Kim MS & Leahy DJ Transient mammalian cell transfection with polyethylenimine (PEI). Methods Enzymol 529, 227–240, doi: 10.1016/B978-0-12-418687-3.00018-5 (2013). [DOI] [PMC free article] [PubMed] [Google Scholar]
Associated Data
This section collects any data citations, data availability statements, or supplementary materials included in this article.
Supplementary Materials
Data Availability Statement
The coordinate and cryoEM map of MRGPRX2-Gq-cortistatin-14, MRGPRX2-Gi1-cortistatin-14, MRGPRX2-Gq-(R)-ZINC-3573, MRGPRX2-Gi1-(R)-ZINC-3573 and MRGPRX4-Gq-MS47134 have been deposited to PDB and EMDB with accession code 7S8L (EMD-24896), 7S8M (EMD-24897), 7S8N (EMD-24898), 7S8O (EMD-24899) and 7S8P (EMD-24900), respectively. The cryoEM micrographs of MRGPRX4-Gq-MS47134, MRGPRX2-Gq-cortistatin-14, MRGPRX2-Gq-(R)-ZINC-3573, MRGPRX2-Gi1-cortistatin-14 and MRGPRX2-Gi1-(R)-ZINC-3573 have been deposited to EMPIAR database with accession number of EMPIAR-10852, EMPIAR-10853, EMPIAR-10854, EMPIAR-10855 and EMPIAR-10856, respectively. The MRGPRX2 antagonist C9 and C9-6 and negative control C7 and the MRGPRX4 agonist MS47134 and negative control X2-2 will be made available via Sigma-Millipore.


