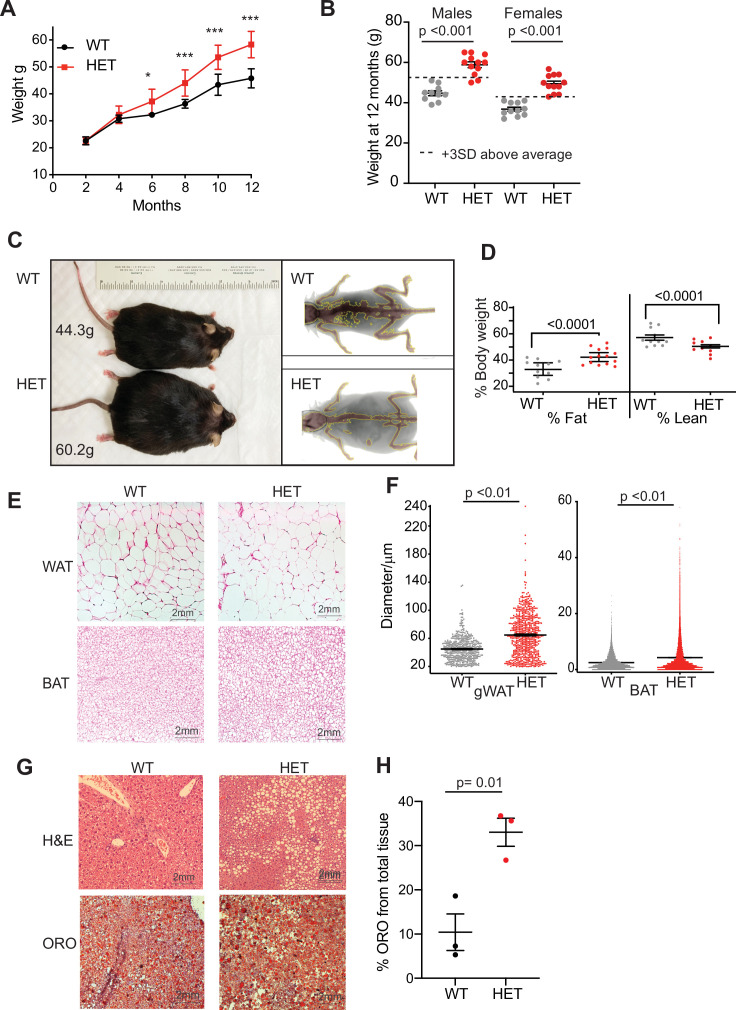
Figure 1. Dnmt3a-HET mice become overweight and develop obesity.
(A) Weight of male Dnmt3a-HET (HET, n=14) and WT (n=12) littermates on regular chow. * p=0.03, ***<p = 0.001 as determined by two-way ANOVA. (B) Distribution of weight from HET and WT mice females and males at 1 year of age. Dashed lines indicate 3 standard deviations (SD) above the mean of the WT. (C) Representative display of D3A-HET and WT mice at 1 year Left: D3A-HET and WT mice at 1 year. Right: dual energy X-ray absorptiometry (DEXA) analysis of 6-month-old WT and HET mice. Top: Representative image displaying lean (brown color) and fat (grey) tissues. (D) Quantification of fat and lean mass (n=10–14) from DEXA. Statistical analysis 1way ANOVA. (E) Representative H&E staining of gonadal white adipose tissue and BAT from 1-year-old mice. (F) Morphometric analysis of gWAT and BAT adipocyte diameter. ***p<0.001 by 1way ANOVA. (G) Representative staining of liver tissue from 1-year-old WT and 3A-HET littermates. Top: H&E staining. Bottom: Oil Red O lysochrome diazo dye. (H) Quantification of total red droplets from Oil Red O-stained livers (n=3 per group). Statistical analysis one-way ANOVA.


