. 2022 May 30;11:e72359. doi: 10.7554/eLife.72359

Figure 2. Dnmt3a-HET mice display increased feeding and develop glucose and insulin intolerance.

(A) Average hourly food consumption for WT (3 males and 3 females) and HET mice (3 males and 3 females) as averaged for data collected over 5 days. All analyses for CLAMS was performed using CalR and the Statical analysis ACNOVA. (B) Energy balance calculated from calories consumed versus calories expended. For the mice as in a. (C) Levels of fasting glucose and insulin of WT and HET mice at 2 months of age. All data are expressed as mean ± SEM. (D) Levels of fasting glucose and insulin of WT and HET mice at 6 months of age. All data are expressed as mean ± SEM. (E) Top: Glucose tolerance test at 2 months of age (n=10). Mice were fasted for 12 hr prior to beginning the test. Bottom: Glucose tolerance test at 6 months of age (n=10). Mice were fasted for 12 hr prior to beginning the test. All data are expressed as mean ± SEM. *p<0.05, **p<0.01, ***p<0.0001 by two-way ANOVA. (F) Left: Insulin tolerance test at 10 months of age (n=10). Mice were fasted for 12 hr prior to beginning the test. Right: scatter plot of glucose levels at baseline and at 30 min for the mice used in the analysis. All data are expressed as mean ± SEM. *p<0.05, **p<0.01, ***p<0.001 by two-way ANOVA.

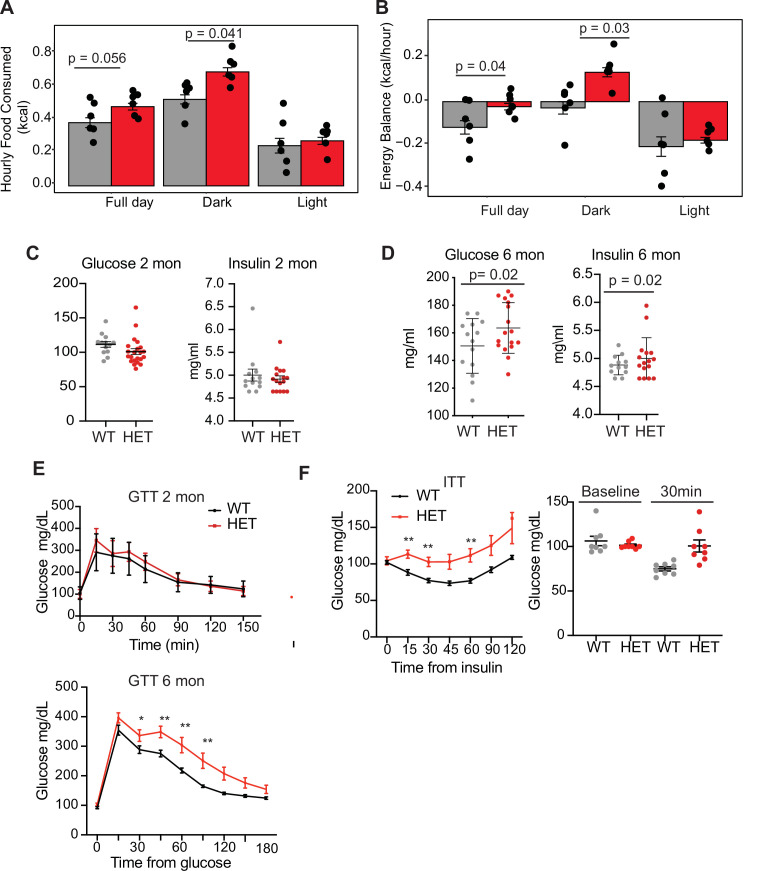
Figure 2.

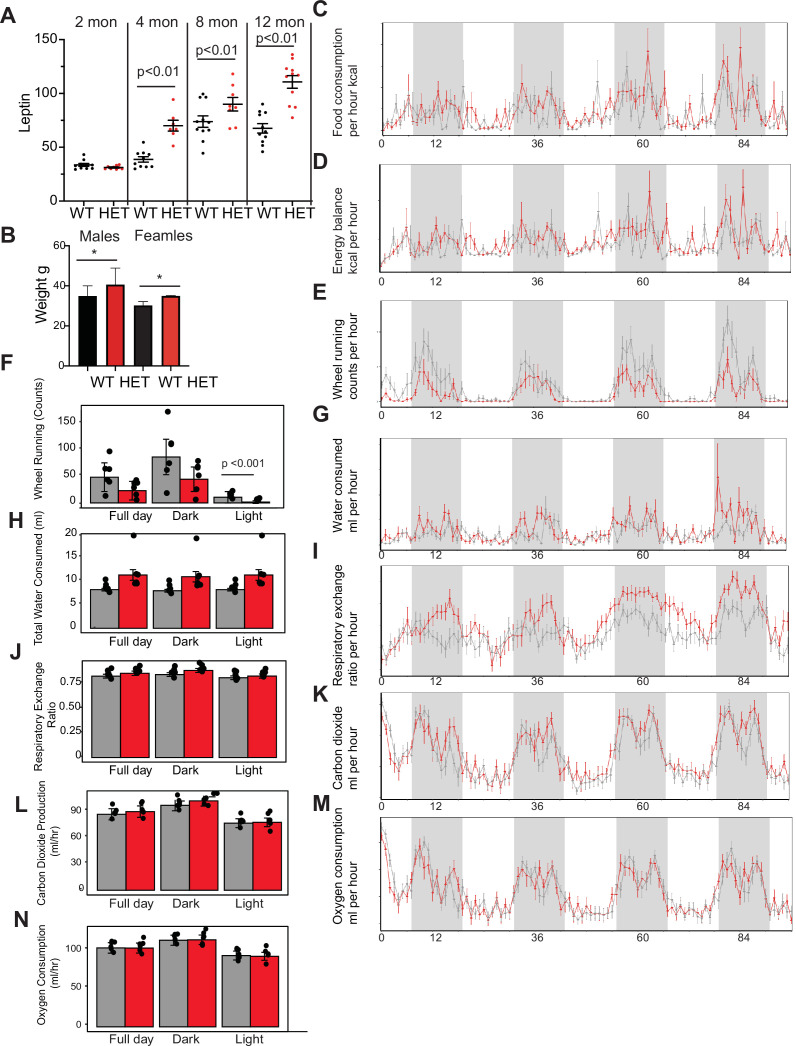
Figure 2—figure supplement 1. Dnmt3a-HET mice display altered metabolic activity.

Figure 2—figure supplement 1.

(A) Quantification of leptin over time. (B) Weight of mice used for CLAMS analysis. No significant weight difference for HET and WT mice at 6 months (M=males, F=females). (C) Trace over time of food consumption for WT and HET mice (3 males and 3 females per group) used for CLAMS analysis. Mice were individually housed and monitored in metabolic cages (CLAMS-HC) and average hourly food consumption was calculated. Gray marks the dark cycle. All data was analyzed by ClaR using ACNOVA for statistical analysis. (D) Energy balance over time analysis was done as in C. (E) Wheel running over time analysis was done as in C. (F) Average wheel running over time analysis was done as in C. (G) Water consumption over time analysis was done as in C. (H) Total water consumption over time analysis was done as in C. (I) Respiratory exchange rate over time analysis was done as in C. (J) Average respiratory exchange rate over time analysis was done as in C. (K) Carbon dioxide (CO2) production over time analysis was done as in C. (L) Average CO2 production over time analysis was done as in C. (M) Oxygen (O2) consumption over time analysis was done as in C. (N) Average O2 consumption over time analysis was done as in C.