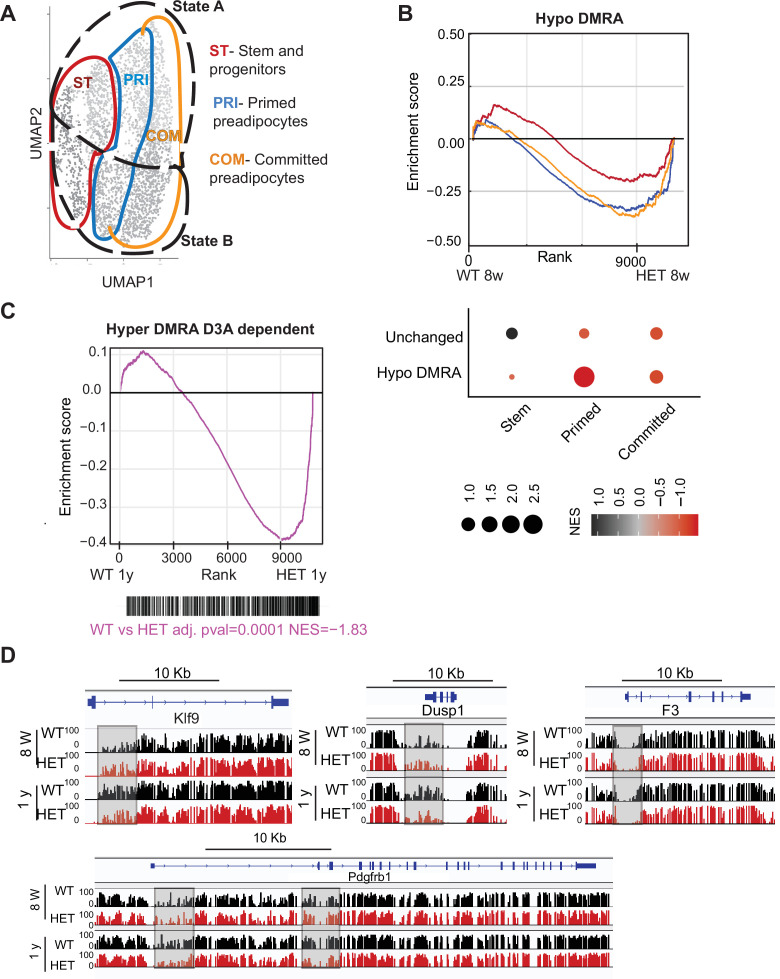
Figure 9. Loss of DNA methylation in HET cells is associated with activation of the pro-inflammatory cell state B.
(A) Illustration of the cell clusters used for the gene enrichment analysis based on the clusters and cellular states identified in Figure 5. (B) Displayed is the enrichment score and the Bonferroni adjusted p-value for genes associated with WT hypo and HET hypo DMRA based on their enrichment within cell cluster groups and cellular sates as described in A. Bottom: Negative normalized enrichment score (NES) indicates more contribution of HET cells to the genes associated with the WT hypo DMRA regions, while positive NES indicates more contribution of WT cells to the genes associated the described regions in DMRA and in unchanged regions. (C) Displayed is the enrichment score and the Bonferroni adjusted p-value for genes associated with WT hyper and HET (8 weeks and 1 year) hypo DMRA based on their enrichment within cell cluster groups and cellular sates as described in A. Negative normalized enticement score (NES) indicates more contribution of HET cells to the genes associated with the WT hyper DMRA regions, while positive NES indicates more contribution of WT cells to the genes associated the described regions. (D) For regions defined as WT hyper-DMRA and HET 8 weeks and 1 year hypomethylated (purple regions from Figure 6G), we performed gene enrichment analysis based on the cell clusters groups and cellular sates illustrated in A. Displayed is the enrichment score and the Bonferroni adjusted p-value in WT and HET cells. (E) DNA methylation at the Klf9, F3, Dusp1, and Pdgfrb loci in WT (black) and HET (red) cells at 8 weeks and at 1 year. Highlighted are the regions which gain methylation in WT cells but lose methylation in the HET.


