

Abstract
Background
Brain tumor therapeutic responses can be quantified from magnetic resonance images (MRI) using 1‐ (1D) and 2‐dimensional (2D) linear and volumetric methods, but few studies in dogs compare these techniques.
Hypotheses
Linear methods will be obtained faster, but have less agreement than volumetric measurements. Therapeutic response agreement will be highest with the total T2W tumor volumetric (TTV) method. Therapeutic response at 6‐weeks will correlate with overall survival (OS).
Animals
Forty‐six dogs with intracranial gliomas.
Methods
Prospective study. Three raters measured tumors using 1D and 2D linear, TTV, and contrast‐enhancing volumetric (CEV) techniques on 143 brain MRI to determine agreement between methods, define therapeutic responses, and assess relations with OS.
Results
Raters performed 1D the fastest (2.9 ± 0.57 minutes) and CEV slowest (17.8 ± 6.2 minutes). Inter‐ and intraobserver agreements were excellent (intraclass correlations ≥.91) across methods. Correlations between linear (1D vs 2D; ρ > .91) and volumetric (TTV vs CEV; ρ > .73) methods were stronger than linear to volumetric comparisons (ρ range, .26‐.59). Incorporating clinical and imaging data resulted in fewer discordant therapeutic responses across methods. Dogs having partial tumor responses at 6 weeks had a lower death hazard than dogs with stable or progressive disease when assessed using 2D, CEV, and TTV (hazard ration 2.1; 95% confidence interval, 1.22‐3.63; P = .008).
Conclusions and Clinical Importance
One‐dimensional, 2D, CEV, and TTV are comparable for determining therapeutic response. Given the simplicity, universal applicability, and superior performance of the TTV, we recommend its use to standardize glioma therapeutic response criteria.
Keywords: dog, magnetic resonance imaging, neurooncology, neuroradiology, radiology and diagnostic imaging
Abbreviations
- 1D
1‐dimensional
- 2D
2‐dimensional
- 3DT1W
3‐dimensional T1‐weighted images
- CEV
contrast‐enhancing tumor volume
- CR
complete response
- HR
hazard ratio
- LD
longest diameter
- MRI
magnetic resonance imaging
- OS
overall survival
- PD
progressive disease
- PR
partial responses
- RAVNO
Response Assessment in Veterinary Neuro‐oncology
- RECIST
Response Evaluation Criteria in Solid Tumors
- ROI
regions of interest
- SD
stable disease
- SPD
sum product diameters
- SRT
stereotactic radiotherapy
- TTV
total T2W tumor volume
1. INTRODUCTION
Using serial magnetic resonance imaging (MRI) scans to quantify changes in the size of brain tumors after treatment is 1 of the most important and widely applied objective criteria used to define and assess the efficacy of cancer therapeutics. 1 , 2 In dogs with gliomas, favorable relationships between objective reductions in tumor size and pragmatic clinical outcomes such as improvement in interictal clinical signs of brain dysfunction, seizure control, and survival have been observed. 3 , 4 , 5
Several methods to quantify solid tumor size on diagnostic imaging studies are described including the Response Evaluation Criteria in Solid Tumors (RECIST), which utilizes a 1‐dimensional (1D) linear measurement of the longest tumor diameter; the MacDonald and Response Assessment in Veterinary Neuro‐oncology (RAVNO) criteria, both of which measure tumor size using orthogonal 2‐dimensional (2D) linear measurements; and several manual, semiautomated, or fully computer automated volumetric methods. 1 , 2 , 6 Applying these methods in brain tumors, and particularly in gliomas, has been associated with numerous challenges associated with difficulties identifying distinct tumor borders, complex and irregular tumor geometries, and the requirement of conventional criteria to measure only the contrast‐enhancing tumor burden. 1 , 2 There is greater interobserver variability associated with 2D linear compared to volumetric measurement methods in dogs with glioma, but the implications of this variability on the assessment of therapeutic response have yet to be investigated. 6 As not all gliomas in dogs demonstrate contrast‐enhancement, there is a need to further define and evaluate tumor measurement criteria based on T2W sequences, as have been utilized in clinical studies in dogs. 3 , 4 , 5
The goals of this study were to: (a) evaluate inter‐ and intraobserver reliability and rater efficiency for 1D, 2D, and volumetric methods of glioma measurement in dogs; (b) compare agreement in tumor response assessments between linear and volumetric methods of glioma quantification; and (c) identify correlations of tumor response with survival. We hypothesized that: (a) linear methods would be performed faster but with less agreement compared to volumetric techniques; (b) among all methods examined, tumor response assignment agreement would be highest when assessed using the total T2W tumor volumetric (TTV) measurement; and (c) the tumor response at 6 weeks would correlate with overall survival (OS).
2. MATERIALS AND METHODS
2.1. Study design and animals
This was a prospective study of 46 dogs with histologically confirmed, solitary intracranial gliomas that were consecutively treated at a single institution that utilized a standardized image acquisition protocol (Table S1) to obtain serial pre‐ and posttreatment brain MRI scans in each dog using a 1.5 T superconducting magnet (Philips Intera, Andover, Massachusetts) as described previosuly. 4 , 7 To be included in the study, dogs needed to have survived long enough to have completed at least 1 (6 week) follow‐up brain MRI examination after treatment. All MRI were performed with the dogs under general anesthesia, and additional MRI sequences were obtained depending on which treatment the dog received, or at the request of the attending neurologist or radiologist. Each dog underwent a baseline (pretreatment) MRI scan, and was followed with clinical and MRI examinations at 6 weeks, and 3, 6, 9, and 12 months after treatment or until death. 4 Thirty‐three dogs received some form of investigational therapy; 8 dogs were treated with stereotactic radiotherapy (SRT; 3 × 8 Gy on alternate days), and 5/46 dogs were treated with an investigational agent and SRT. 4 No dog included in this study was treated with surgical resection of the glioma, as acute postoperative MRI scans in this population were not universally performed, and not standardized when obtained. Dog owners provided written, informed consent to participate in investigative clinical trials, and all trial related procedures were approved by the institutional animal care and use committee.
2.2. Quantitative MRI measurements
Three raters experienced with cranial MRI interpretation and canine brain tumor response assessment criteria independently evaluated and performed 1D, 2D, and volumetric measurements on each MRI included in the study. MRI DICOM datasets from each case and time were imported into commercial image viewing and analysis software (Osirix MD, v11.0.4, Pixmeo, Switzerland). The RECIST method was used to perform 1D measurements by identifying the longest diameter (LD; d 1) across a contrast‐enhancing lesion on transverse postcontrast 3‐dimensional T1‐weighted (3DT1W) images. 1 RAVNO criteria were used to perform 2D measurements, which was expressed as the sum of the product (SPD) of the largest diameter (d 1) and its maximum perpendicular diameter (d 2) from each measurable tumor on transverse postcontrast 3DT1W images (Figure S1). 1 , 2 For the purposes of this study, we conservatively defined measurable enhancing tumor burdens as those ≥4 mm in diameter, which is a target lesion threshold that is 4 times larger than the slice thickness of the 3DT1W sequences acquired. 1 Cystic and necrotic areas were excluded from 1D and 2D measurements. 1 , 2 For tumors that did not demonstrate contrast enhancement, 1D and 2D measurements were obtained from transverse T2W images (Figure S2), as has been applied to human low‐grade gliomas. 2
Two volumetric tumor habitats from each dog at each imaging timepoint were created for quantitative analyses. The first habitat was the total T2W tumor volume (TTV), which was defined using transverse T2W images. To exclude regions of peritumoral edema from the TTV, transverse 3DT1W, T2W, and FLAIR images were synchronized and qualitatively evaluated. Manually defined regions of interest (ROIs) representing the TTV were generated on contiguous T2W image slices (Figures S1 and S2), the subsequent TTV calculated with the Osirix MD ROI‐volume function, and the TTV saved as a DICOM file. 3 , 4
The second tumor habitat was the contrast‐enhancing tumor volume (CEV), which was calculated using a previously described dT1 method with IB Neuro Delta Suite plug‐in software (v 20.10, Imaging Biometrics, Wisconsin) for Osirix MD. 8 For dT1 image generation, 3DT1W pre‐ and postcontrast images were coregistered in an automated manner using a rigid mutual‐information cost function. Image calibration allows semiautomated delineation of enhancing lesions and was accomplished by selecting a fixed intensity threshold and applying it consistently across cases and time points. The threshold of 2800 calibrated units was applied to all studies based on consensus determination by 2 raters each with >20 years of experience in neuro‐oncologic image analysis. The calibrated and registered precontrast 3DT1W images were then subtracted from the calibrated and registered postcontrast 3DT1W images, resulting in a dT1image map, which was then saved as a DICOM file. 8
Preprocessed dT1 DICOM files were imported into open‐source image analysis software (3D Slicer v 4.0; http://www.slicer.org) for supervised CEV habitat segmentation visualization and verification using previously described methods. 9 , 10 For the CEV habitat, the user identifies and applies a color labelmap for the tumor‐specific habitat, and then also identifies the background by painting it with a differently colored labelmap outside the tumor‐specific habitat with a 5 to 7 mm brush tool. The “GrowCut” function of the editor module was then applied to automatically generate a competing growing region for the CEV habitat, which was simultaneously visualized in the transverse, dorsal, and sagittal planes of the postcontrast 3DT1W MR images (Figure S1). After qualitative visual inspection of the automated volumetric habitat labelmap overlays on the anatomic images, the user determines if habitat refinement is required. When refinements were applied, they were performed using the “dilation,” “erosion,” or “island removal” tools in the editor module. Upon final segmentation verification by the user, the CEV habitat was saved as an .nrrd file. CEV volumetric data from the resulting segmented habitat were generated by using the “volume calculation” function of the segment statistics module of 3D Slicer.
To assess the efficiency of the quantification methods and determine if there was a learning curve associated with measurement methods, each rater used an electronic timer during the calculation of each of the 1D, 2D, CEV, and TTV measurements determined from the first 25 (first batch) and 75th to 100th (second batch of) MRI scans that they reviewed. Intraobserver variability was evaluated by having each rater calculate 1D, 2D, CEV, and TTV measurements 2 times on 25 randomly selected MRI scans (random number generator, GraphPad, San Diego, California). The rater's first and second measurements of each scan were separated by at least 4 months.
At the end of data recording, each rater was also asked to provide subjective, open‐ended comments as to which measurement method(s) they thought the most efficient, user friendly, and challenging, as well as for the reasons behind their individual conclusions.
2.3. Therapeutic response criteria
Therapeutic responses were defined according to RECIST (1D), RAVNO (2D), and volumetric extrapolated criteria for TTV and CEV, as have been adapted for use in veterinary medicine. 1 , 4 For all methods, a complete response (CR) required the elimination of all enhancing tumor or complete disappearance of all T2W/FLAIR lesions. Partial responses (PR) were defined as ≥30% decrease in the LD for RECIST, ≥50% decrease in SPD for RAVNO linear systems, and ≥65% decreases in TTV or CEV for volumetric methods. Progressive disease (PD) was considered present if the LD increased by ≥20%, the SPD increased by ≥25%, or if TTV or CEV increased by ≥40%. All other responses constituted stable disease (SD). 1 , 4 For the purposes of this study, therapeutic responses assessments were first assigned by each rater using only RECIST, RAVNO, and volumetric imaging criteria while blinded to each case's clinical status. After a period of 6 months, each rater was provided the accompanying clinical information from each case and time point and then reassigned RAVNO and volumetric therapeutic responses using composite clinical and imaging criteria as described previously (Table S2). 1 , 2 , 7 Overall survival (OS) was measured in days from the date the baseline, pretreatment MRI was obtained until death.
2.4. Statistical analyses
To compare the time required for raters to measure tumors across batches, paired t‐tests were performed. A mixed effects model, which included rater and batch interaction effects, was later used to examine whether rater effect on the time required to measure tumors using each of the measurement methods was different by batches. Intraclass correlation coefficients were calculated to assess interobserver and intraobserver reliabilities. Pairwise correlations between tumor measurement methods were determined by comparing percent change in tumor size from baseline or best response (1D vs 2D, 1D vs TTV, 1D vs CEV, etc) to determine the concordance between methods using Spearman's rank correlation coefficients because not all variables were normally distributed. The concordant counts by categorical response for all raters were calculated. Therapeutic response agreement by rater, measurement method, and follow‐up time when comparing clinical and imaging criteria vs imaging criteria alone was calculated using weighted Kappa statistics.
Landmark survival analyses were performed at the 6‐week follow‐up time to determine whether tumor response assignment generated using each measurement method predicted OS. Landmark analyses included all dogs that were alive and not censored at the 6‐week time point and compared the subsequent OS of dogs that had demonstrated an objective response (CR and PR) at that point vs those that had not (SD and PD), as determined using clinical and imaging‐based criteria where applicable (eg, 2D, CEV, TTV). Cox proportional hazard model was used to determine risk of death based on the average therapeutic response determined across the 3 raters at 6 weeks for each tumor measurement method. All statistical analyses were performed using SAS software (version 9.4, SAS Institute, Cary, North Carolina).
3. RESULTS
3.1. Dog characteristics
Forty‐six dogs with histopathological confirmed intracranial gliomas were included in the study. The breed distribution consisted of Boxers (10), Boston terriers (8), mixed breeds (7), French bulldogs (3), English bulldogs (3), Cane Corso (2), and Staffordshire terriers (2), with the remaining dogs representing 11 other purebreds. The median age at which the baseline MRI was obtained was 7 years (range, 4‐11) and the median body weight was 24 kg (range, 5‐55). There were 29 males (26 neutered, 3 intact) and 17 females (16 spayed, 1 intact). Tumor histopathologic diagnoses were obtained by stereotactic brain biopsy in all dogs, and additionally at necropsy in 28/46 (61%) of dogs. 11 , 12 , 13 , 14 Histopathological diagnoses included 26 oligodendrogliomas (9 low‐grade, 17 high‐grade), 16 astrocytomas (7 low‐grade, 9 high‐grade), and 4 undefined gliomas (3 low‐grade, 1 high‐grade). All dogs were treated with prednisone continuously (33/46) or intermittently (13/46) throughout the course of their disease (median 1.1 mg/kg/day PO; range, 0.62‐1.4 mg/kg day).
A total of 143 MRI scans from these 46 dogs were reviewed by each rater. Contrast‐enhancing tumor burdens were present in 33/46 dogs. All dogs underwent baseline and 6‐week posttreatment imaging. Additionally, 3‐month posttreatment MRI were obtained in 24/46 (52%) dogs, 6 month posttreatment MRI in 17/46 (37%), 9 month posttreatment MRI in 6/46 (13%), and 12 month posttreatment MRI in 4/46 (9%). All dogs were dead at the time of data analysis.
3.2. Tumor measurement method calculation time
Raters performed 1D measurements faster than the other 3 methods, and also took longer to calculate the CEV compared to the other methods (Figure 1; Table S3). After adjusting for batch effects, the times required to perform 1D (P = .0002), 2D (P < .0001), TTV (P < .0001), and CEV (P < .0001) measurements were each different across raters. Rater 1 performed 1D (P < .0001), 2D (P < .0001), and TTV (P < .0001) measurements faster than Rater 3, and CEV calculations faster than Raters 2 and 3 (P < .0001). After adjusting for rater effects, raters performed 1D (P < .0001), TTV (P = .0003), and CEV (P < .0001) faster on the second batch of MRI scans compared to the first batch.
FIGURE 1.
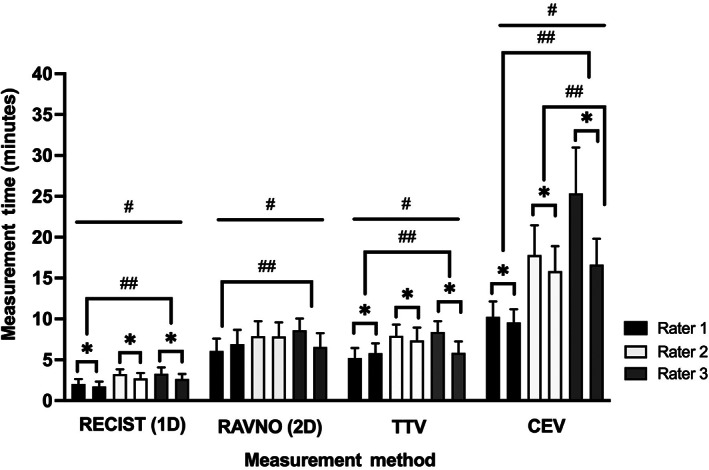
Time required for raters to measure tumors using each method. Each of the 1D, 2D, TTV, CEV measurements were significantly different across raters (#, all P ≤ .0002) . Rater 1 performed all measurements faster than Rater 3, and Rater 2 also performed the CEV faster than Rater 3 (##, all P < .0001). Raters performed 1D, TTV, and CEV measurements faster on the second batch of MRI scans compared to the first batch (*, all P ≤ .0003)
3.3. Rater interobserver and intraobserver correlations
Interobserver and intraobserver correlations were excellent across measurement methods and time periods, with all interobserver intraclass correlations ≥.91 (Table 1) and all intraobserver intraclass correlations ≥.99 (Table 2).
TABLE 1.
Interobserver intraclass correlations (ICC) by tumor measurement method
| Measurement method and evaluation time | Interobserver ICC |
|---|---|
| 1D baseline | .94 |
| 2D baseline | .96 |
| CEV baseline | .98 |
| TTV baseline | .98 |
| 1D 6 week | .95 |
| 2D 6 week | .96 |
| CEV 6 week | .98 |
| TTV 6 week | .98 |
| 1D 3 month | .98 |
| 2D 3 month | .98 |
| CEV 3 month | .98 |
| TTV 3 month | .99 |
| 1D 6 month | .99 |
| 2D 6 month | .98 |
| CEV 6 month | .97 |
| TTV 6 month | .99 |
| 1D 9 month | .97 |
| 2D 9 month | .91 |
| CEV 9 month | .94 |
| TTV 9 month | .99 |
| 1D 12 month | .98 |
| 2D 12 month | .92 |
| CEV 12 month | .98 |
| TTV 12 month | .99 |
TABLE 2.
Intraobserver intraclass correlations (ICC) by tumor measurement method
| Intraobserver ICC | ||||
|---|---|---|---|---|
| Measurement method | Rater 1 | Rater 2 | Rater 3 | All raters |
| 1D | .998 | .998 | .998 | .995 |
| 2D | .997 | .998 | .998 | .995 |
| CEV | .999 | .999 | .999 | .997 |
| TTV | .999 | .999 | .999 | .999 |
3.4. Measurement methodologic correlations
Across raters, linear assessment method comparisons (ie, 1D vs 2D) correlated very strongly (all ρ ≥ .91), between volumetric comparisons were strong (ie, TTV vs CEV; all ρ ≥ .73), and correlations between linear and volumetric methods (ie, 1D vs CEV, etc) were moderate to weak (ρ range, .26‐.59; Table 3).
TABLE 3.
Pairwise correlations between tumor measurement methods
| Rater 1 | Rater 2 | Rater 3 | ||||
|---|---|---|---|---|---|---|
| Measurement method comparison | Correlation coefficient (ρ) | P value | Correlation coefficient (ρ) | P value | Correlation coefficient (ρ) | P value |
| 1D vs 2D | .973 | <.0001 | .902 | <.0001 | .911 | <.0001 |
| 1D vs TTV | .562 | <.0001 | .554 | <.0001 | .551 | <.0001 |
| 1D vs CEV | .321 | .03 | .308 | .03 | .262 | .08 |
| 2D vs TTV | .498 | .001 | .459 | .001 | .454 | .002 |
| 2D vs CEV | .261 | .07 | .265 | .08 | .263 | .08 |
| TTV vs CEV | .764 | <.0001 | .782 | <.0001 | .738 | <.0001 |
3.5. Therapeutic response assignment agreement
To determine the concordance among methods in categorizing therapeutic response, all of the follow‐up scans were classified by each rater into each response category according to the percentage change from baseline or best overall response as defined by the various measurement methods using only imaging or imaging and clinical criteria (Table 4). There was perfect (100%) concordance across raters and methods for assigning CR, with greater variability and good to excellent concordance associated with PR (89%‐100% concordance), SD (93%‐99% concordance), and PD (91%‐99% concordance). Concordance rates across raters and methods were superior when therapeutic responses were assigned using clinical and imaging criteria (Table 4) vs imaging data alone. Discordance between therapeutic response categorical assignments using imaging compared to imaging and clinical data was observed for all methods (Tables 4 and 5).
TABLE 4.
Categorical therapeutic response assignment determined by each rater and measurement method for 97 follow‐up MRI scans
| Categorical response counts by rater | Concordant counts by categorical response for all raters (frequency of agreement %) | Total concordance (frequency of agreement %) | |||||||||||||||
|---|---|---|---|---|---|---|---|---|---|---|---|---|---|---|---|---|---|
| Rater 1 | Rater 2 | Rater 3 | |||||||||||||||
| Measurement method | CR | PR | SD | PD | CR | PR | SD | PD | CR | PR | SD | PD | CR | PR | SD | PD | |
| Imaging response assessment only | |||||||||||||||||
| 1D | 4 | 17 | 47 | 29 | 4 | 13 | 51 | 29 | 4 | 16 | 47 | 30 | 12/12 (100%) | 41/46 (89%) | 142/145 (98%) | 87/88 (98%) | 282/291 (97%) |
| 2D | 4 | 18 | 40 | 35 | 4 | 17 | 47 | 29 | 4 | 16 | 45 | 32 | 12/12 (100%) | 49/51 (96%) | 123/132 (93%) | 87/96 (91%) | 271/291 (92%) |
| CEV | 4 | 6 | 15 | 13 | 4 | 6 | 14 | 14 | 4 | 6 | 16 | 12 | 12/12 (100%) | 18/18 (100%) | 43/45 (95%) | 36/39 (92%) | 109/114 (96%) |
| TTV | 4 | 16 | 43 | 34 | 4 | 16 | 44 | 33 | 4 | 16 | 44 | 33 | 12/12 (100%) | 48/48 (100%) | 130/131 (99%) | 99/100 (99%) | 289/291 (99%) |
| Total counts | 16 | 57 | 145 | 111 | 16 | 52 | 156 | 105 | 16 | 54 | 152 | 107 | 48/48 (100%) | 156/163 (96%) | 438/453 (97%) | 309/323 (96%) | 951/987 (96%) |
| Clinical and imaging response assessment a | |||||||||||||||||
| 2D | 4 | 17 | 41 | 35 | 4 | 16 | 47 | 30 | 4 | 15 | 46 | 32 | 12/12 (100%) | 46/48 (96%) | 127/134 (95%) | 90/97 (93%) | 275/291 (95%) |
| CEV | 4 | 5 | 15 | 14 | 4 | 5 | 16 | 13 | 4 | 5 | 16 | 13 | 12/12 (100%) | 15/15 (100%) | 46/47 (98%) | 39/40 (97%) | 112/114 (98%) |
| TTV | 4 | 16 | 43 | 34 | 4 | 16 | 44 | 33 | 4 | 16 | 44 | 33 | 12/12 (100%) | 48/48 (100%) | 130/131 (99%) | 99/100 (99%) | 289/291 (99%) |
| Total counts | 12 | 38 | 99 | 83 | 12 | 37 | 107 | 76 | 12 | 36 | 106 | 78 | 36/36 (100%) | 109/111 (98%) | 303/312 (97%) | 228/237 (96%) | 676/696 (97%) |
Abbreviations: CR, complete response; PD, progressive disease; PR, partial response; SD, stable disease.
There are no clinical criteria associated with assigning therapeutic responses with the RECIST (1D) method.
TABLE 5.
Therapeutic response agreement by rater, measurement method, and follow‐up time when comparing clinical and imaging criteria vs imaging criteria alone
| Weighted kappa | |||
|---|---|---|---|
| Measurement method and follow‐up time | Rater 1 | Rater 2 | Rater 3 |
| 2D 6 week | 1.00 | 1.00 | 1.00 |
| CEV 6 week | 1.00 | 1.00 | 1.00 |
| TTV 6 week | 1.00 | 1.00 | 1.00 |
| 2D 3 month | 0.94 | 1.00 | 1.00 |
| CEV 3 month | 1.00 | 1.00 | 1.00 |
| TTV 3 month | 1.00 | 1.00 | 1.00 |
| 2D 6 month | 1.00 | 1.00 | 1.00 |
| CEV 6 month | 0.86 | 1.00 | 1.00 |
| TTV 6 month | 1.00 | 1.00 | 1.00 |
| 2D 9 month | 1.00 | 0.84 | 1.00 |
| CEV 9 month | 1.00 | 1.00 | 1.00 |
| TTV 9 month | 1.00 | 0.96 | 1.00 |
| 2D 12 month | 1.00 | 1.00 | 1.00 |
| CEV 12 month | 1.00 | 1.00 | 1.00 |
| TTV 12 month | 1.00 | 1.00 | 1.00 |
3.6. Survival analyses
Compared with dogs having CR or PR at 6 weeks, the death hazard was significantly higher for dogs with SD or PD when therapeutic responses were assessed using 2D, CEV, and TTV methodologies (Figure 2). The death hazard was not significantly different between dogs having CR or PR at 6 weeks compared to those with SD and PD when determined using 1D measurements.
FIGURE 2.
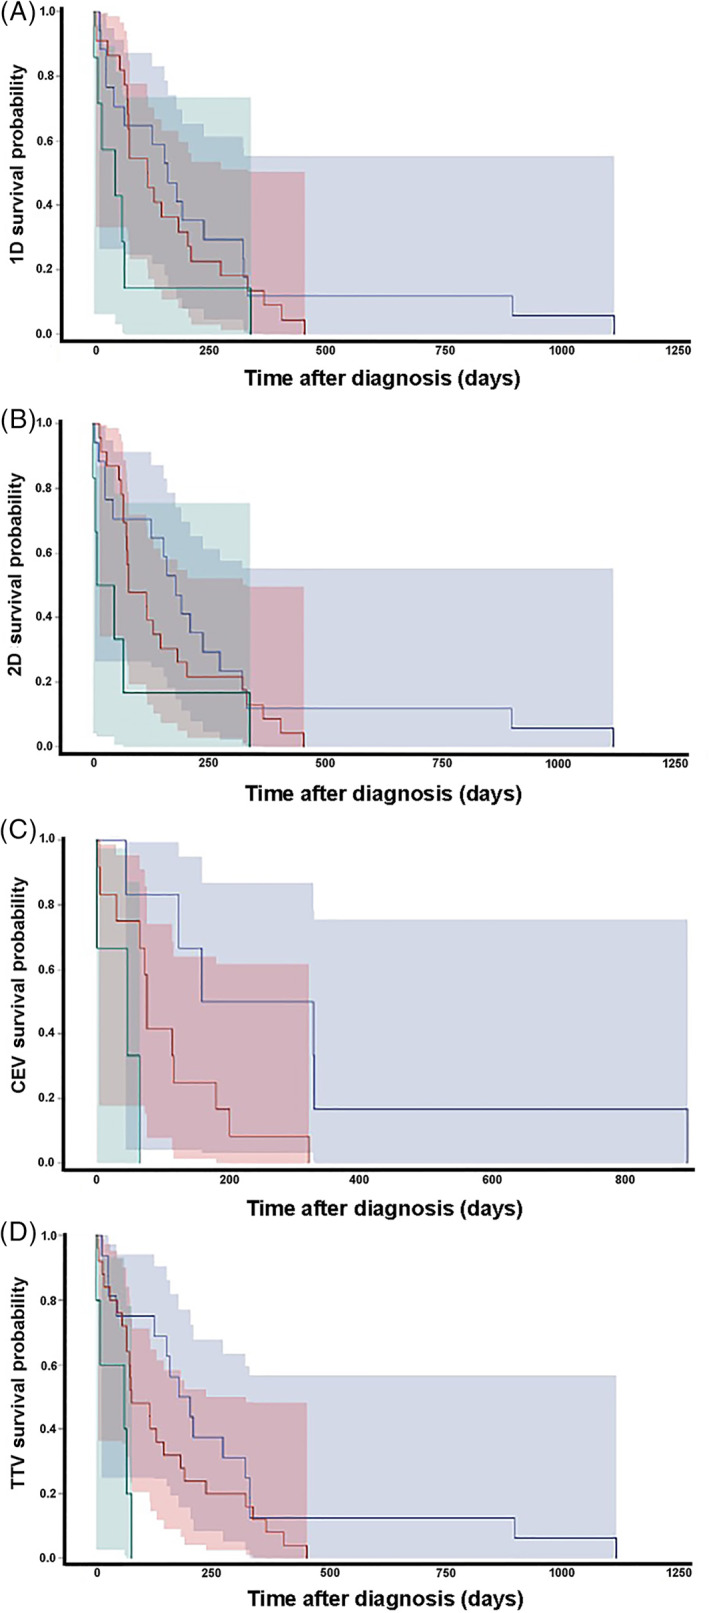
Kaplan‐Meier survival estimates after the 6 week landmark with tumor responses determined using 1D (A), 2D (B), CEV (C), and TTV (D) measurement criteria. The death hazard was not significantly different between dogs having CR or PR (blue curve) at 6 weeks compared to those with SD (red curve) or PD (green curve) when determined using 1D measurements (A; hazard ratio [HR] 1.15; 95% confidence interval [CI], 0.99‐1.33; P = .053). Dogs with CR or PR have significantly increased survivals compared to dogs with SD or PD when tumor responses were determined using 2D (B; HR 1.20; 95% CI, 1.03‐1.40; P = .02), CEV (C; HR 1.58; 95% CI, 1.81‐2.11; P = .002), or TTV (D; HR 2.10; 95% CI, 1.22‐3.63; P = .008) criteria. The shadowed areas represent 95% CIs for the survival curve of corresponding color
3.7. Rater subjective assessments of measurement methods
Raters unanimously stated that the 1D method was technically the easiest and quickest to perform, requiring just 3 mouse clicks to execute once image slice selection was complete, and that the CEV was associated with the largest time investment and steepest learning curve. All raters also commented that manual placement of 1D and 2D measurements on contrast‐enhancing, cystic, and necrotic tumors was the most challenging aspect of the analyses, and generally resulted in an underestimation of the tumor burden. Two raters each indicated that: (a) the TTV represented an ideal compromise between efficiency and reliability; (b) discrimination of potential treatment related changes from tumor was difficult, and (c) the CEV's relative complexity and reliance on multiple software platforms, including a proprietary plug‐in module, represented practical barriers to the routine clinical use of this method.
4. DISCUSSION
This study attempts to address notable and persistent challenges to the implementation and interpretation of objective, quantitative neuroradiologic criteria for determination of therapeutic responses in dogs with glioma, which is a fundamental step toward defining evidence‐based treatment recommendations. Currently, there is lack of consensus regarding a tumor measurement method that is easily and rapidly performed, robust, and widely available for routine clinical use. There are also relatively little data with respect to the reproducibility of measurement methods within and across observers. 6 Our results indicate that experienced raters can perform linear and volumetric methods of glioma quantification efficiently, each of these measurement methods are sufficiently reliable to be applied in the clinical setting, and that head‐to‐head correlations between the different linear (1D vs 2D) and volumetric measurement techniques (CEV vs TTV) were excellent and good, respectively.
The time investment required for raters to perform quantitative glioma measurements indicate that 1D, 2D, and TTV methods could be incorporated into the routine generation of neuroradiologic reports without onerously increasing the workload of the interpreting clinician. Raters were able to obtain 1D measurements in <5 minutes, 2D and TTV in 5 to 10 minutes, generally became more efficient with experience, and each of these 3 methods can be performed with digital caliper and volumetric ROI tools that are standard features on proprietary and open source image analysis software platforms. 1 , 6 , 10 , 11 , 12 All raters took longer to execute the CEV calculations (10‐25 minutes) than the other 3 methods, likely due to the inherent complexity of segmenting this tumor habitat as well as our specific methodologic requirement to use multiple image processing steps and software platforms to generate the CEV. 8 , 9 , 10
Intraobserver and interobserver variabilities were low, yielding consistent linear and volumetric glioma measurements. Our results demonstrate an experienced rater will generate similar measurements from the same tumor over the course of 2 sessions. Intraobserver agreement was higher than interobserver agreement, which is not unexpected based on inherent features of gliomas that have confounded measurements of gliomas in this and other studies in humans and dogs. 6 Subjective comments provided by raters indicated that linear assessments of contrast‐enhancing target lesions presented the most challenges in this study, as it was often difficult to determine the exact origin or termination of linear measurements in areas demonstrating a gradient of contrast‐enhancement on T1W images, or placing orthogonal measurements in a fashion that avoided cystic or necrotic tumor areas. 1 , 6 Raters also commented that suspected therapeutic effects, such as radiation necrosis or peritumoral edema, further and preferentially confounded linear assessments. 1 , 2 , 5 , 15 As was hypothesized, these subjective impressions were supported by our findings of intraobserver and interobserver variabilities that were higher for linear when compared to volumetric methods, which is similar to previous observations when measuring gliomas in dogs and humans. 6 , 15 , 16
Compared to volumetric techniques, linear measurement methods are subject to greater imprecisions due to their high sensitivity to slice and point selection by the rater, and their relative insensitivity to detection of size change, particularly when markedly asymmetric tumor responses occur. 1 , 6 , 15 , 17 Although some potential sources of slice variability were mitigated through the use of a standardized MRI sequences, our protocol did not control head position and thus slice acquisition angles. Different slice acquisition angles can have significant impacts on linear measurements, while having minimal effect on volumetric methods. 15 , 17
Overall, there was very good concordance among the various raters and methods in classifying therapeutic responses. Total concordance was slightly higher when raters determined therapeutic responses using clinical and imaging criteria, and the least discordance was observed with the TTV method. These results reinforce the importance and relevance of including results of physical examinations and corticosteroid dosing requirements into holistic therapeutic response assessments. 1 There was perfect agreement when classifying CR, although this was only identified in 4 MRI studies, which were all from the same dog. Compared to the TTV, linear methods, especially the 1D, tended to underestimate PD. Volumetric techniques may detect disease progression earlier, as tumor volume is dependent on the third power of its diameter. 1 , 15 , 16 , 18 For example, PD is defined in the 1D method by a ≥20% increase in the LD, and a 20% increase in the diameter of a sphere is equivalent to a 73% increase in volume, whereas the TTV threshold for PD is a ≥40% increase in volume. 18 However, as we observed similar and significant associations between 2D, CEV, and TTV tumor responses at 6 weeks and OS, which is a frequently utilized and clinically relevant endpoint in dogs with glioma, the small differences in response rates we observed between these methods may not be clinically significant.
Our survival analysis results indicated that associations between tumor response at 6 weeks and OS were stronger when volumetric methods were used compared to linear methods, and support the intuitive clinical assumptions that an objective reduction in glioma size is a clinically meaningful surrogate of therapeutic response and associated with a survival benefit. 1 , 2 , 15 The 1D method was the only 1 examined in this study that did not have a statistically significant association with survival and this could be due to the fact that, as highlighted above, tumors are 3‐dimensional entities, so methods that more globally evaluate the tumor morphology are better predictors of therapeutic response and survival because they are more representative of the real evolution of the disease. 15 , 18 We elected to use the 6 week follow‐up evaluation for our landmark analysis partly because of our dataset limitations, as 6 week follow‐up MRI examinations were available for all dogs, and by the 3 month follow‐up nearly 50% of the dogs had died. Thus, survival analyses using other imaging endpoints in this study would have been underpowered.
Depending on the kinetics and mechanism of action of the antineoplastic treatment applied, the 6 week posttreatment observation interval might not be ideal for surveillance of therapeutic response. 1 However, given the relatively short survivals associated with the treatment of dogs with glioma in this and other studies and the correlations we observed with tumor response and OS, recommending imaging surveillance at 6 weeks represents a clinically justifiable cost: benefit compromise. 19 The survival analyses performed in this study might also not be generalizable across tumor types, grades, or therapeutic modalities, as we did not evaluate effects of tumor type or grade on survival nor did we include dogs receiving surgery, immunotherapeutics, or cytostatic agents. 20 Our results are relevant to dogs receiving SRT, which is a widely used therapeutic modality in clinical practice. 5
Our study is limited by the use of only expert raters to perform quantitative tumor measurements. Inclusion of more raters with differing medical backgrounds and levels of experience may have provided additional insight into ranges of efficiency, variability, and discordance that could be anticipated if these methods are routinely used clinically. 16 However, our results indicate that expert raters can measure gliomas and assign therapeutic responses consistently enough to avoid excessive adjudication, which supports the use of blinded, independent central radiologic reviews for glioma clinical trials in dogs. 21
Our measurement results might also not be relevant to the entire population of dogs with glioma, as we did not include dogs treated with surgical resection, or gliomas presenting with multicentric satellite, butterfly, or diffuse leptomeningeal or ependymal tumors. 13 Surgically induced changes in the brain can further complicate quantitative assessments of the residual or recurrent tumor burden, especially when using postcontrast images. 1 , 20 However, the dT1 mapping technique that was used to determine the CEV in this study, when applied to pre‐ and immediate postoperative postcontrast images, can assist with discrimination of residual tumor associated contrast‐enhancement from surgically induced changes. 8 , 20 As gliomas in dogs are currently rarely treated surgically outside of clinical trial settings, and frequently present as a solitary mass lesions in the brain, our results are applicable to the majority of dogs with these tumors. 3 , 4 , 5 , 6 , 11 , 12 , 13 , 14 Thinner slices provide more accurate representations of tumor volume, usage of thinner and contiguous T2W slices or acquisition of 3D balanced steady‐state free precession gradient echo sequences may further improve quantitative tumor assessments, although at the expense of increased scanning time. 1 , 6 , 17
5. CONCLUSIONS
Therapeutic response assessments were comparable using 1D, 2D, CEV, and TTV techniques. When a standardized MRI protocol is used, all of these methods are adequate for routine clinical use. However, differences in therapeutic response rates were observed across the various methods and when performed using only imaging criteria vs composite clinical and imaging data. Thus, adoption of standardized criteria for response assessment of gliomas in dogs that include clinical status should be considered to facilitate comparison of results across studies and treatment modalities. Given the relative efficiency and ease of performance of the TTV using open source, readily available software platforms, the inclusion of clinical assessment criteria into TTV derived responses, the applicability of this method to nonenhancing gliomas, its superior reliability among and across raters, and its demonstrated prognostic value, we recommend that TTV continue to be used for the assessment therapeutic response of canine gliomas, unless an alternate method is indicated based on the treatment being assessed. 3 , 4
CONFLICT OF INTEREST DECLARATION
Authors declare no conflict of interest.
OFF‐LABEL ANTIMICROBIAL DECLARATION
Authors declare no off‐label use of antimicrobials.
INSTITUTIONAL ANIMAL CARE AND USE COMMITTEE (IACUC) OR OTHER APPROVAL DECLARATION
Approved by Virginia Tech IACUC, protocols 17‐011 and 20‐057.
HUMAN ETHICS APPROVAL DECLARATION
Authors declare human ethics approval was not needed for this study.
Supporting information
Table S1. Minimum sequences and parameters used for brain MR imaging (1.5 T).
Table S2. Summary of linear and volumetric criteria used to assign therapeutic responses in canine gliomas.
Table S3. Tumor measurement efficiency by rater, method, and batch.
Figure S1. Partial response (PR) determined in a dog with a contrast‐enhancing astrocytoma. Compared to baseline measurements (A‐C), a reduction in tumor size meeting criteria for PR is evident on the follow‐up scan (D‐F) using 1D RECIST (d 1; A, D) 2D RAVNO (d 1 × d 2; A, D), dorsal planar reconstructed total tumor volume (TTV; B, E), and contrast‐enhancing volume (CEV [green]; C, F) measurements. Insets of A and D are precontrast T1W images and are T1W postcontrast images in C and F.
Figure S2. Progressive disease (PD) with quantitative measurements obtained from T2‐weighted (T2W) images in a dog with a nonenhancing, high‐grade oligodendroglioma. Compared to the tumor nadir measurements (A‐D), an unequivocal increase in tumor size meeting criteria for PD is evident on the follow‐up scan (E‐H) using 1D RECIST (d 1; C, G), 2D RAVNO (d 1 × d 2; C, G), and dorsal planar reconstructed total tumor volume (TTV; D, H) measurements. Qualitative evaluations included review of T1‐weighted postcontrast images (A, E), fluid attenuated inversion recovery images (B, F), and T2W images (C, G).
ACKNOWLEDGMENT
Funding provided by United States Department of Health and Human Services, National Institutes of Health, National Cancer Institute, P01CA207206 and R01CA213423.
Garcia Mora JK, Robertson J, Hsu F‐C, et al. Comparison of linear and volumetric criteria for the determination of therapeutic response in dogs with intracranial gliomas. J Vet Intern Med. 2022;36(3):1066‐1074. doi: 10.1111/jvim.16406
Funding information National Cancer Institute, Grant/Award Numbers: R01CA213423, P01CA207206; National Institutes of Health; United States Department of Health and Human Services
REFERENCES
- 1. Rossmeisl JH Jr, Garcia PA, Daniel GB, et al. Invited review—neuroimaging response assessment criteria for brain tumors in veterinary patients. Vet Radiol Ultrasound. 2014;55:115‐132. [DOI] [PMC free article] [PubMed] [Google Scholar]
- 2. Chukwueke UN, Wen PY. Use of the response assessment in neuro‐oncology (RANO) criteria in clinical trials and clinical practice. CNS Oncol. 2019;8:CNS28. [DOI] [PMC free article] [PubMed] [Google Scholar]
- 3. Dickinson PJ, LeCouteur RA, Higgins RJ, et al. Canine spontaneous glioma: a translational model system for convection‐enhanced delivery. Neuro Oncol. 2010;12:928‐940. [DOI] [PMC free article] [PubMed] [Google Scholar]
- 4. Rossmeisl JH, Herpai D, Quigley M, et al. Phase I trial of convection‐enhanced delivery of IL13RA2 and EPHA2 receptor targeted cytotoxins in dogs with spontaneous intracranial gliomas. Neuro Oncol. 2021;3:422‐434. [DOI] [PMC free article] [PubMed] [Google Scholar]
- 5. Dolera M, Malfassi L, Bianchi C, et al. Frameless stereotactic radiotherapy alone and combined with temozolomide for presumed canine gliomas. Vet Comp Oncol. 2018;16:90‐101. [DOI] [PubMed] [Google Scholar]
- 6. Thomson CB, Haynes KH, Pluhar GE. Comparison of visual metric and planimetry methods for brain tumor measurement in dogs. Am J Vet Res. 2016;77:471‐477. [DOI] [PubMed] [Google Scholar]
- 7. Packer RA, Rossmeisl JH, Kent MS, Griffin JF IV, Mazcko C, LeBlanc AK. Consensus recommendations on standardized magnetic resonance imaging protocols for multicenter canine brain tumor clinical trials. Vet Radiol Ultrasound. 2018;59:261‐271. [DOI] [PMC free article] [PubMed] [Google Scholar]
- 8. Schmainda KM, Prah MA, Zhang Z, et al. Quantitative delta T1 (dT1) as a replacement for adjudicated central reader analysis of contrast‐enhancing tumor burden: a subanalysis of the American College of Radiology Imaging Network 6677/radiation therapy oncology group 0625 multicenter brain tumor trial. AJNR Am J Neuroradiol. 2019;40:1132‐1139. [DOI] [PMC free article] [PubMed] [Google Scholar]
- 9. Egger J, Kapur T, Fedorov A, et al. GBM volumetry using the 3D slicer medical image computing platform. Sci Rep. 2013;3:1364. [DOI] [PMC free article] [PubMed] [Google Scholar]
- 10. Fedorov A, Beichel R, Kalpathy‐Cramer J, et al. 3D Slicer as an image computing platform for the quantitative imaging network. Magn Reson Imaging. 2012;30:1323‐1241. [DOI] [PMC free article] [PubMed] [Google Scholar]
- 11. Kani Y, Cecere T, Lahmers K, et al. Diagnostic accuracy of stereotactic brain biopsy for intracranial neoplasia in dogs: comparison of biopsy, surgical resection, and necropsy specimens. J Vet Int Med. 2019;33:1384‐1391. [DOI] [PMC free article] [PubMed] [Google Scholar]
- 12. Shinn RL, Kani Y, Hsu FC, Rossmeisl JH. Risk factors for adverse events occurring after recovery from stereotactic brain biopsy in dogs with primary intracranial neoplasia. J Vet Int Med. 2020;34:2021‐2028. [DOI] [PMC free article] [PubMed] [Google Scholar]
- 13. Bentley RT, Yanke AB, Miller MA, Heng HG, Cohen‐Gadol A, Rossmeisl JH. Cerebrospinal fluid drop metastases of canine glioma: magnetic resonance imaging classification. Front Vet Sci. 2021;8:650320. [DOI] [PMC free article] [PubMed] [Google Scholar]
- 14. Sharma P, Sonawane P, Herpai D, et al. Multireceptor targeting of glioblastoma. Neurooncol Adv. 2020;2:vdaa107. [DOI] [PMC free article] [PubMed] [Google Scholar]
- 15. Dempsey MF, Condon BR, Hadley DM. Measurement of tumor “size” in recurrent malignant glioma: 1D, 2D, or 3D? AJNR Am J Neuroradiol. 2005;26:770‐776. [PMC free article] [PubMed] [Google Scholar]
- 16. Kanaly CW, Mehta AI, Ding D, et al. A novel, reproducible, and objective method for volumetric magnetic resonance imaging assessment of enhancing glioblastoma. J Neurosurg. 2014;121:536‐542. [DOI] [PMC free article] [PubMed] [Google Scholar]
- 17. Rohde S, Massberg M, Reinhardt J, et al. Impact of technical and morphological factors on the precision of software‐based MR tumor volumetry: a phantom study. Fortschr Roentgenstr. 2008;180:654‐661. [DOI] [PubMed] [Google Scholar]
- 18. Warren KE, Patronas N, Albert PS, et al. Comparison of one‐, two‐, and three‐dimensional measurements of childhood brain tumors. J Natl Canc Inst. 2001;93:1401‐1405. [DOI] [PubMed] [Google Scholar]
- 19. Jose‐Lopez R, Gutierrez‐Quintana R, de la Fuente C, et al. Clinical features, diagnosis, and survival analysis of dogs with glioma. J Vet Int Med. 2021;35:1902‐1917. [DOI] [PMC free article] [PubMed] [Google Scholar]
- 20. Vogelbaum M, Jost S, Aghi M, et al. Application of novel response/progression measures for surgically delivered therapies for gliomas: response assessment in neuro‐oncology (RANO) working group. Neurosurgery. 2012;70:234‐243. [DOI] [PubMed] [Google Scholar]
- 21. Ford RR, O'Neal M, Moskowitz SC, et al. Adjudication rates between readers in independent central review of oncology studies. J Clin Trials. 2016;6:5. [Google Scholar]
Associated Data
This section collects any data citations, data availability statements, or supplementary materials included in this article.
Supplementary Materials
Table S1. Minimum sequences and parameters used for brain MR imaging (1.5 T).
Table S2. Summary of linear and volumetric criteria used to assign therapeutic responses in canine gliomas.
Table S3. Tumor measurement efficiency by rater, method, and batch.
Figure S1. Partial response (PR) determined in a dog with a contrast‐enhancing astrocytoma. Compared to baseline measurements (A‐C), a reduction in tumor size meeting criteria for PR is evident on the follow‐up scan (D‐F) using 1D RECIST (d 1; A, D) 2D RAVNO (d 1 × d 2; A, D), dorsal planar reconstructed total tumor volume (TTV; B, E), and contrast‐enhancing volume (CEV [green]; C, F) measurements. Insets of A and D are precontrast T1W images and are T1W postcontrast images in C and F.
Figure S2. Progressive disease (PD) with quantitative measurements obtained from T2‐weighted (T2W) images in a dog with a nonenhancing, high‐grade oligodendroglioma. Compared to the tumor nadir measurements (A‐D), an unequivocal increase in tumor size meeting criteria for PD is evident on the follow‐up scan (E‐H) using 1D RECIST (d 1; C, G), 2D RAVNO (d 1 × d 2; C, G), and dorsal planar reconstructed total tumor volume (TTV; D, H) measurements. Qualitative evaluations included review of T1‐weighted postcontrast images (A, E), fluid attenuated inversion recovery images (B, F), and T2W images (C, G).