

SUMMARY
West Nile virus (WNV) was first recognized in the USA in 1999. We estimated the cumulative incidence of WNV infection in the USA from 1999 to 2010 using recently derived age- and sex-stratified ratios of infections to WNV neuroinvasive disease (WNND) and the number of WNND cases reported to national surveillance. We estimate that over 3 million persons have been infected with WNV in the USA, with the highest incidence rates in the central plains states. These 3 million infections would have resulted in about 780 000 illnesses. A substantial number of WNV infections and illnesses have occurred during the virus' first decade in the USA.
Key words: Epidemiology, incidence, West Nile virus, zoonoses
Since the first identification of West Nile virus (WNV) in North America in 1999, the national ArboNET surveillance system has documented that the virus has become endemic throughout most of the USA [1]. Studies conducted in the USA indicate that in persons infected with WNV, about 75% remain asymptomatic, 25% develop West Nile fever (WNF), and <1% develop West Nile neuroinvasive disease (WNND) [2, 3]. Since routine diagnostic testing is not recommended for WNF patients and many of these patients do not seek medical care, WNF cases are considerably underreported. In contrast, WNND reporting to ArboNet is thought to be nearly complete, particularly in older persons and persons with compatible clinical features [4, 5]. From 1999 to 2010, the ArboNET surveillance system recorded 12 823 cases of WNND from 47 states.
Several studies have attempted to estimate the true number of WNV infections in the USA. Seroprevalence surveys conducted to determine cumulative infection incidence have found seroprevalences of WNV IgG antibody ranging from 1·9% to 14% [3, 6, 7]; however, these studies were limited by surveying small geographical areas and relatively few subjects. Cumulative infection incidence has also been estimated by multiplying the total number of reported WNND cases by the estimated proportion of total infections per WNND case. Results from a seroprevalence survey in New York after the 1999 epidemic suggested that each reported case of WNND resulted from an average of 140 infections [3]. This ratio was later used to estimate a cumulative infection incidence of 1 655 080 up to 2006 in the USA [8]. However, this cumulative incidence estimate was subject to considerable uncertainty given that the 140:1 ratio of infection to WNND was based on a seroprevalence estimate (2·6%) whose confidence limits spanned more than threefold (1·2–4·1%) [3]. In fact, data derived from blood donor screening suggested that there may be as many as 256–353 infections for each reported WNND case [9]. More recently, data from a serosurvey of blood donors and WNND reporting from an entire state indicated that 213–286 infections are necessary to result in a case of WNND [10]. This last study was of sufficient scope to estimate age- and gender-specific infection-to-WNND ratios; however, the ratio in children could not be ascertained since infection data were derived from blood donors. The risk of WNND following infection was estimated as more than 20 times higher in men aged ⩾65 years than women aged 16–24 years, a finding consistent with national WNND surveillance data [8]. Thus, population age and gender structure is an important consideration when computing national WNV infection estimates.
In order to estimate the number of WNV infections in adults in the USA by state to the end of 2010, taking into account the substantial variation in risk in age and gender groups, we multiplied the age- and gender-stratified number of WNND cases with onset up to the end of 2010 (reported through the ArboNET surveillance system) by the recently derived, corresponding estimated infection-to-WNND ratios [10]. Cumulative incidence (percent of population previously infected) was then calculated by dividing these numbers by the corresponding state population (US Census Bureau, 2010). ArboNET was missing age and/or gender data for 79 of the 12 823 WNND cases reported to the end of 2010. For the above calculations, those cases were assigned to the various age and gender strata proportionally based on the cases' state's percentage of WNND cases in each stratum. Variance estimates for the total number of previously infected individuals for each state were also computed by accounting for the stratification by age and gender. The estimated total number of infections (variance estimates) for the whole of USA was computed by summing the state-specific totals (variances), and a Wald 95% confidence interval (CI) was computed using these. Statistical analyses were performed using SAS version 9.2 (SAS Institute Inc., USA), Epi Info (CDC, USA), and R version 2.11.1 (www.r-project.org). R was also used to produce the estimated cumulative incidence map (Fig. 1).
Fig. 1.
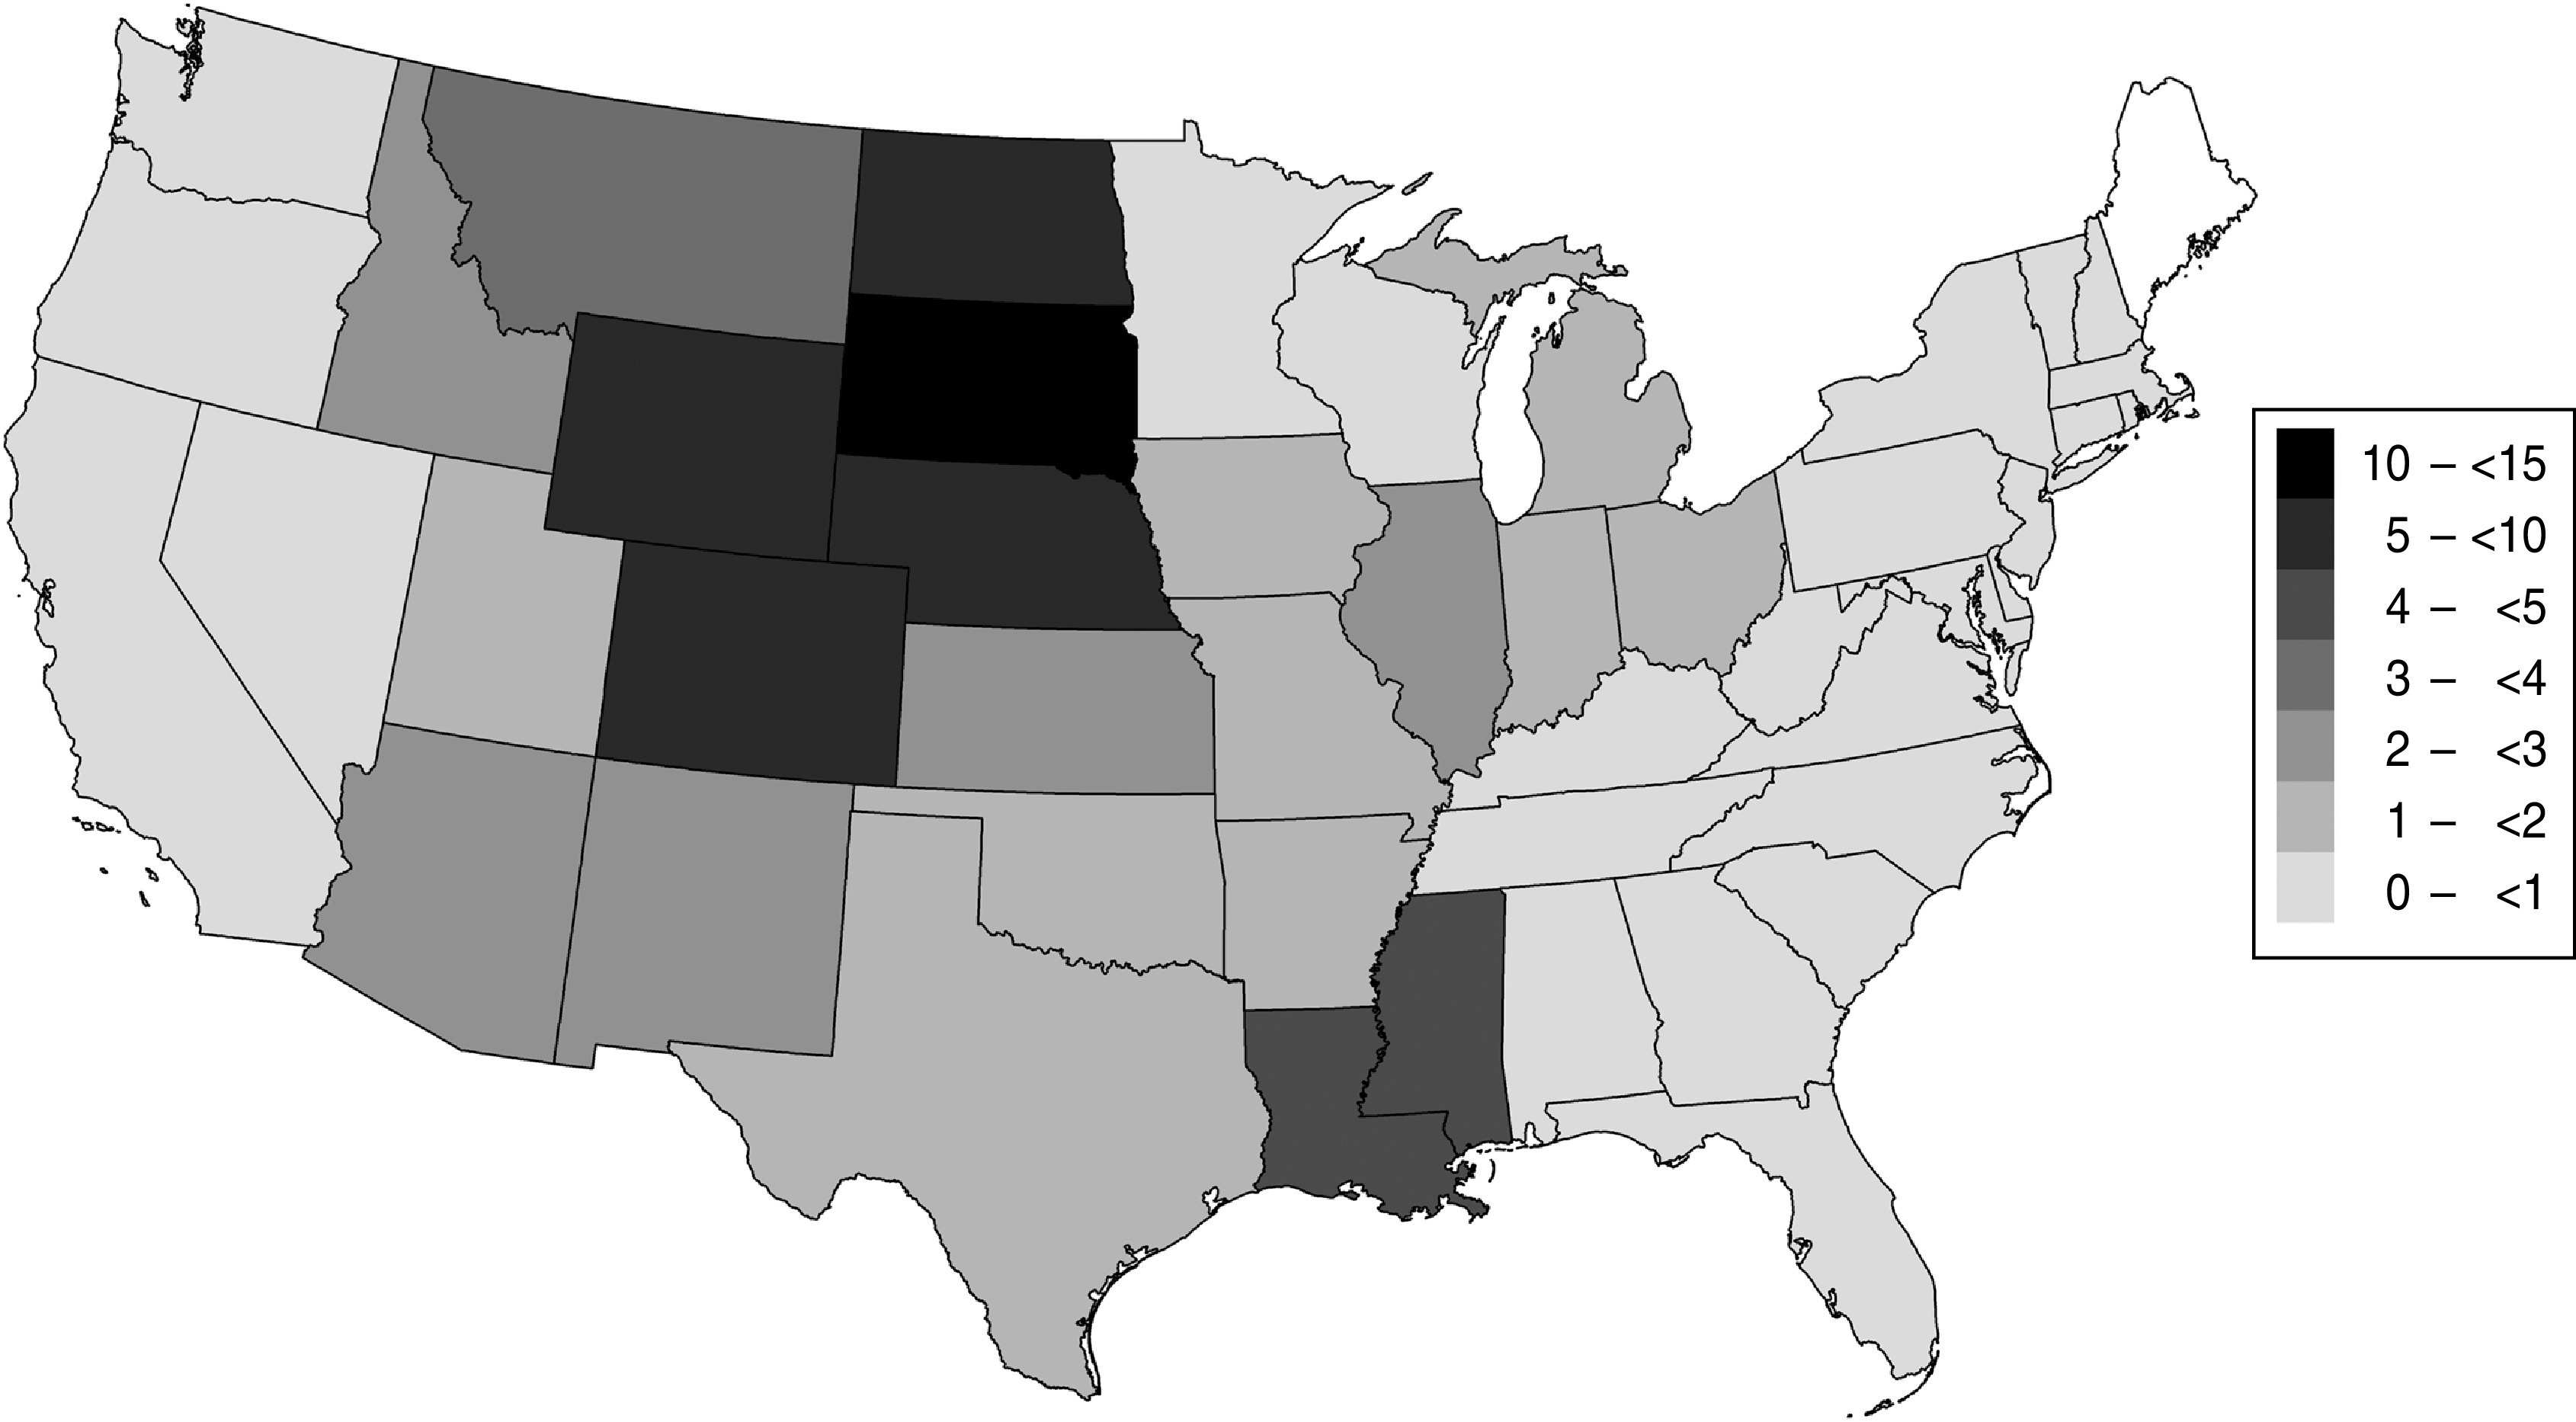
Estimated cumulative incidence of West Nile virus infection (per cent of population infected) in US adults aged ⩾16 years, 1999–2010.
State-specific cumulative infection incidence estimates indicated that the central plains states had the highest cumulative incidence, with South Dakota (13·4%), Wyoming (8·2%), North Dakota (7·5%), Nebraska (7·4%), and Colorado (6·0%) leading in incidence (Fig. 1, Table 1). An estimated 2 757 029 (95% CI 2 688 327–2 825 730) persons aged ⩾16 years were infected with WNV by the end of 2010 in the USA.
Table 1.
Reported cases of West Nile virus (WNV) neuroinvasive disease, estimated number of WNV infections, and estimated cumulative incidence of WNV infection in adults aged ⩾16 years, by state, 1999–2010, USA
| State | Total WNND cases* | Estimated WNV infections† | Total population‡ | Cumulative incidence (%) | 95% CI |
|---|---|---|---|---|---|
| South Dakota | 321 | 84 920 | 634 183 | 13·3 | 11·9–14·9 |
| Wyoming | 142 | 36 195 | 443 141 | 8·2 | 7·2–9·1 |
| North Dakota | 187 | 40 472 | 539 946 | 7·5 | 6·7–8·03 |
| Nebraska | 440 | 104 677 | 1 417 810 | 7·4 | 6·6–8·2 |
| Colorado | 963 | 235 512 | 3 937 831 | 6·0 | 5·3–6·6 |
| Mississippi | 445 | 100 001 | 2 299 852 | 4·4 | 3·9–4·8 |
| Louisiana | 659 | 150 230 | 3 544 274 | 4·2 | 3·8–4·7 |
| Montana | 132 | 28 785 | 792 520 | 3·6 | 3·2–4·0 |
| Idaho | 157 | 35 426 | 1 184 858 | 3·0 | 2·7–3·3 |
| Arizona | 609 | 134 614 | 4 944 481 | 2·7 | 2·4–3·0 |
| New Mexico | 196 | 43 549 | 1 600 398 | 2·7 | 2·4–3·0 |
| Kansas | 206 | 46 952 | 2 206 600 | 2·1 | 1·9–2·3 |
| Illinois | 991 | 201 223 | 10 072 849 | 2·0 | 1·8–2·2 |
| Michigan | 723 | 144 033 | 7 832 236 | 1·8 | 1·6–2·0 |
| Iowa | 176 | 41 604 | 2 402 200 | 1·7 | 1·5–1·9 |
| Texas | 1458 | 320 993 | 19 035 255 | 1·7 | 1·5–1·9 |
| Utah | 113 | 32 849 | 1 978 979 | 1·7 | 1·5–1·9 |
| Missouri | 335 | 68 182 | 4 730 501 | 1·4 | 1·3–1·6 |
| Oklahoma | 197 | 39 584 | 2 924 289 | 1·4 | 1·2–1·5 |
| Arkansas | 135 | 28 911 | 2 284 744 | 1·3 | 1·1–1·4 |
| District of Columbia | 32 | 6261 | 512 575 | 1·2 | 1·1–1·4 |
| Indiana | 263 | 57 996 | 5 061 394 | 1·2 | 1·0–1·3 |
| Ohio | 504 | 93 903 | 9 133 831 | 1·0 | 0·9–1·2 |
| Minnesota | 174 | 40 424 | 4 168 319 | 1·0 | 0·9–1·1 |
| California | 1272 | 275 083 | 29 079 048 | 0·9 | 0·9–1·0 |
| Nevada | 93 | 17 831 | 2 109 730 | 0·8 | 0·8–0·9 |
| Maryland | 135 | 25 500 | 4 584 109 | 0·6 | 0·5–0·6 |
| Pennsylvania | 255 | 53 402 | 10 260 299 | 0·5 | 0·5–0·6 |
| Alabama | 118 | 19 360 | 3 781 800 | 0·5 | 0·5–0·6 |
| New York | 438 | 74 262 | 15 588 804 | 0·5 | 0·4–0·5 |
| Tennessee | 136 | 22 690 | 5 022 781 | 0·4 | 0·4–0·5 |
| Connecticut | 56 | 11 673 | 2 859 207 | 0·4 | 0·4–0·5 |
| Kentucky | 86 | 13 606 | 3 432 660 | 0·4 | 0·3–0·5 |
| Georgia | 124 | 24 731 | 7 478 195 | 0·3 | 0·3–0·4 |
| Delaware | 13 | 1940 | 716 853 | 0·3 | 0·2–0·3 |
| Wisconsin | 69 | 12 013 | 4 506 907 | 0·3 | 0·2–0·3 |
| New Jersey | 100 | 15 737 | 6 976 489 | 0·2 | 0·2–0·3 |
| Florida | 162 | 32 307 | 15 283 266 | 0·2 | 0·2–0·2 |
| Massachusetts | 49 | 8380 | 5 303 787 | 0·2 | 0·1–0·2 |
| Rhode Island | 8 | 1289 | 857 232 | 0·2 | 0·1–0·2 |
| Virginia | 50 | 7736 | 6 362 861 | 0·1 | 0·1–0·1 |
| South Carolina | 17 | 4290 | 3 669 965 | 0·1 | 0·1–0·1 |
| New Hampshire | 3 | 1116 | 1 066 277 | 0·1 | 0·1–0·1 |
| Oregon | 18 | 3179 | 3 064 689 | 0·1 | 0·1–0·1 |
| North Carolina | 28 | 7791 | 7 510 570 | 0·1 | 0·1–0·1 |
| Washington | 29 | 4850 | 5 327 767 | 0·1 | 0·1–0·1 |
| West Virginia | 6 | 969 | 1 511 356 | 0·1 | 0·1–0·1 |
| Total | 12 823 | 2 757 029 | 240 037 748 | 1·1 | 1·1–1·2 |
West Nile neuroinvasive disease (WNND) cases reported to CDC through ArboNET; Alaska, Maine, Vermont and Hawaii reported no cases up to 2010.
Product of WNND cases by age and gender reported in state and corresponding ratios of WNV infections per WNND case reported by Carson et al. [10].
US Census Bureau data for 2010, persons aged ⩾16 years.
Our study estimated that almost 2·8 million adults in the USA had been infected with WNV by 2010. Estimates obtained from serological surveys of the risk of WNV infection in children compared to adults vary [3, 6]; however, if similar infection rates are assumed in children aged <16 years as in persons aged 16–24 years, the estimated number of infections in all persons in the USA would be closer to 3·2 million. Assuming that about 26% of persons contracting WNV will develop clinical disease by the virus [2], an estimated 780 000 persons in the USA have become ill by the end of 2010. A recent study estimated acute care medical costs of US$46 530 for each case of WNND and US$302 for WNF [11]. Applying these figures to the 12 823 reported cases of WNND and the estimated 780 000 cases of WNF yields an estimate of the total acute care medical cost of about US$832 million.
The reasons for the geographical pattern in WNV infection incidence are probably complex and are not well understood. The extensive acreage of irrigated farmland in the central plains and some western states may explain the high incidences observed in those locations [12–14]. Irrigated farmland provides excellent habitat for Culex tarsalis, an efficient vector for WNV transmission [15, 16]. Other factors associated with WNV incidence in other areas include surface water and wetlands [17–19]; avian density, diversity, and abundance [20–22]; and human density, urbanization, and housing [20, 22–24].
Because not all patients with WNND are recognized and reported to ArboNET [4, 5], the actual number of WNND cases was probably higher than the reported number used in our calculations. Thus, the actual number of infections may be higher than that estimated in this study. Although all states use ArboNET's standardized reporting system, completeness of recognition and reporting of cases may vary among states. In addition, uncertainties regarding the age- and gender-specific infection-to-WNND ratios [10] used in our calculations could have resulted in an over- or underestimate of the actual number of infections. Another limitation is that our study spans 12 years, and 2010 census data were used in the extrapolation to derive state-specific and national infection rates; however, our incidence estimates were similar when using census estimates for 2005 (data not presented).
In conclusion, our data indicate that over 3 million people have become infected with WNV in the USA by the end of 2010, almost twice the number estimated based on prior non-stratified estimates up to 2006 [8]. Since 2003, the US blood supply has been screened for WNV. Had this not been done, the 2·8 million infected adults would have represented a transfusion safety risk during their acute infection since most are asymptomatic or mildly symptomatic. It is important to note that despite the many people infected so far, over 98% of the US population remains at risk of infection, and hence efforts to prevent infection through vector control and personal protection measures remain important. Our findings indicating high infection incidences in people living in central midwestern states stress the particular importance of prevention measures during the summer WNV transmission season in that region.
ACKNOWLEDGEMENTS
This work was funded in part by grants from the Centers for Disease Control and Prevention (R01-CI-000214) and the National Heart Lung and Blood Institute (RC2-HL-101632).
DECLARATION OF INTEREST
None.
REFERENCES
- 1.Centers for Disease Control and Prevention. West Nile virus disease and other arboviral diseases – United States, 2010. Morbidity and Mortality Weekly Report 2011; 60: 1009–1013. [PubMed] [Google Scholar]
- 2.Zou S, et al. West Nile fever characteristics among viremic persons identified through blood donor screening. Journal of Infectious Diseases 2010; 202: 1354–1361. [DOI] [PubMed] [Google Scholar]
- 3.Mostashari F, et al. Epidemic West Nile encephalitis, New York, 1999: results of a household-based seroepidemiological survey. Lancet 2001; 358: 261–264. [DOI] [PubMed] [Google Scholar]
- 4.Boehmer TK, et al. Use of hospital discharge data to evaluate notifiable disease reporting to Colorado's electronic disease reporting system. Public Health Reports 2011; 126: 100–106. [DOI] [PMC free article] [PubMed] [Google Scholar]
- 5.Weber IB, et al. Completeness of West Nile virus testing in patients with meningitis and encephalitis during an outbreak in Arizona, USA. Epidemiology and Infection. Published online: 29 November 2011. doi: 10.1017/S0950268811002494. [DOI] [PubMed] [Google Scholar]
- 6.Mandalakas AM, et al. West Nile virus epidemic, northeast Ohio, 2002. Emerging Infectious Diseases 2005; 11: 1774–1777. [DOI] [PMC free article] [PubMed] [Google Scholar]
- 7.Schweitzer BK, et al. Geographic factors contributing to a high seroprevalence of West Nile virus-specific antibodies in humans following an epidemic. Clinical and Vaccine Immunology 2006; 13: 314–318. [DOI] [PMC free article] [PubMed] [Google Scholar]
- 8.Lindsey NP, et al. Surveillance for human West Nile virus disease – United States, 1999–2008. Morbidity and Mortality Weekly Report. Surveillance Summaries 2010; 59: 1–17. [PubMed] [Google Scholar]
- 9.Busch MP, et al. West Nile virus infections projected from blood donor screening data, United States, 2003. Emerging Infectious Diseases 2006; 12: 395–402. [DOI] [PMC free article] [PubMed] [Google Scholar]
- 10.Carson PJ, et al. Neuroinvasive disease and West Nile virus infection, North Dakota, USA, 1999–2008. Emerging Infectious Diseases 2012; 18: 684–686. [DOI] [PMC free article] [PubMed] [Google Scholar]
- 11.Barber LM, Schleier JJ 3rd, Peterson RK. Economic cost analysis of West Nile virus outbreak, Sacramento County, California, USA, 2005. Emerging Infectious Diseases 2010; 16: 480–486. [DOI] [PMC free article] [PubMed] [Google Scholar]
- 12.De Groot AS, et al. Rapid determination of HLA B*07 ligands from the West Nile virus NY99 genome. Emerging Infectious Diseases 2001; 7: 706–713. [DOI] [PMC free article] [PubMed] [Google Scholar]
- 13.Gates MC, Boston RC. Irrigation linked to a greater incidence of human and veterinary West Nile virus cases in the United States from 2004 to 2006. Preventive Veterinary Medicine 2009; 89: 134–137. [DOI] [PubMed] [Google Scholar]
- 14.Eisen L, et al. Irrigated agriculture is an important risk factor for West Nile virus disease in the hyperendemic Larimer-Boulder-Weld area of north central Colorado. Journal of Medical Entomology 2010; 47: 939–951. [DOI] [PubMed] [Google Scholar]
- 15.Turell MJ, et al. An update on the potential of north American mosquitoes (Diptera: Culicidae) to transmit West Nile Virus. Journal of Medical Entomology 2005; 42: 57–62. [DOI] [PubMed] [Google Scholar]
- 16.Goddard LB, et al. Vector competence of California mosquitoes for West Nile virus. Emerging Infectious Diseases 2002; 8: 1385–1391. [DOI] [PMC free article] [PubMed] [Google Scholar]
- 17.Ezenwa VO, et al. Land cover variation and West Nile virus prevalence: patterns, processes, and implications for disease control. Vector Borne Zoonotic Diseases 2007; 7: 173–180. [DOI] [PubMed] [Google Scholar]
- 18.Walsh MG. The role of hydrogeography and climate in the landscape epidemiology of West Nile virus in New York State from 2000 to 2010. PLoS One 2012; 7: e30620. [DOI] [PMC free article] [PubMed] [Google Scholar]
- 19.Shaman J, Day JF, Komar N. Hydrologic conditions describe West Nile virus risk in Colorado. International Journal of Environmental Research and Public Health 2010; 7: 494–508. [DOI] [PMC free article] [PubMed] [Google Scholar]
- 20.Allan BF, et al. Ecological correlates of risk and incidence of West Nile virus in the United States. Oecologia 2009; 158: 699–708. [DOI] [PubMed] [Google Scholar]
- 21.Swaddle JP, Calos SE. Increased avian diversity is associated with lower incidence of human West Nile infection: observation of the dilution effect. PLoS One 2008; 3: e2488. [DOI] [PMC free article] [PubMed] [Google Scholar]
- 22.Liu H, Weng Q, Gaines D. Geographic incidence of human West Nile virus in northern Virginia, USA, in relation to incidence in birds and variations in urban environment. Science of the Total Environment 2011; 409: 4235–4241. [DOI] [PubMed] [Google Scholar]
- 23.Brown HE, et al. Ecological factors associated with West Nile virus transmission, northeastern United States. Emerging Infectious Diseases 2008; 14: 1539–1545. [DOI] [PMC free article] [PubMed] [Google Scholar]
- 24.Rochlin I, et al. Predictive mapping of human risk for West Nile virus (WNV) based on environmental and socioeconomic factors. PLoS One 2011; 6: e23280. [DOI] [PMC free article] [PubMed] [Google Scholar]