

Abstract
Background:
Neoplasia detection rate, the proportion of Barrett’s oesophagus patients with high-grade dysplasia or oesophageal adenocarcinoma detected at index surveillance endoscopy has been proposed as a quality metric. However, the correlation between neoplasia detection rate and a clinically relevant outcome like post-endoscopy Barrett’s neoplasia remains unknown. Post-endoscopy Barrett’s neoplasia refers to the rate of high- grade dysplasia or oesophageal adenocarcinoma on repeat endoscopy within one year of an index screening examination revealing non-dysplastic Barrett’s oesophagus or low-grade dysplasia.
Aim:
To assess correlation between neoplasia detection rate and post- endoscopy Barrett’s neoplasia.
Methods:
We performed a systematic search of multiple databases from date of inception to June 2021 to identify cohort studies reporting both neoplasia detection rate and post-endoscopy Barrett’s neoplasia. Data from each study were pooled using a random effects model, and their correlation assessed using meta-regression. Heterogeneity was assessed and a priori planned subgroup analyses were conducted.
Results:
Ten studies with 27 894 patients with Barrett’s oesophagus were included. The pooled neoplasia detection rate and post- endoscopy Barrett’s neoplasia were 5.0% (95% CI: 3.4%–7.1%, I2 = 97%) and 19.6% (95% CI: 10.1%−34.7%, I2 = 96%), respectively. Meta-r egression revealed a statistically significant inverse relationship between the two variables (coefficient −3.50, 95% CI: −4.63 to −2.37, P < 0.01). With every 1% increase of neoplasia detection rate, post- endoscopy Barrett’s neoplasia decreased by 3.50%. Heterogeneity was high despite adjusting for study quality and performing several subgroup analyses.
Conclusion:
We observed a statistically significant inverse correlation between neoplasia detection rate and post-endoscopy Barrett’s neoplasia. Additional studies are needed to further validate this correlation.
1 |. INTRODUCTION
The incidence of oesophageal adenocarcinoma has been rising over the past 4 decades and survival remains dismal with 5-year survival rates estimated at 20%.1,2 Barrett’s oesophagus is the only known precursor to oesophageal adenocarcinoma, and is thought to progress sequentially from non-dysplastic Barrett’s oesophagus to low-grade dysplasia to high-grade dysplasia to oesophageal adenocarcinoma.3 Screening efforts have focused on early detection of Barrett’s oesophagus and dysplasia, a known risk factor for progression to cancer.4 Additionally, current guidelines recommend using the degree of dysplasia to guide management and surveillance in Barrett’s oesophagus patients.5,6
A high-quality endoscopic examination for detection of dysplasia is thus imperative for guiding appropriate patient risk stratification and management. However, a recent meta-analysis showed that more than a quarter of patients with non-dysplastic Barrett’s oesophagus or low-grade dysplasia at baseline esophagogastroduodenoscopy who had repeat examinations within 1 year are diagnosed with high-grade dysplasia or oesophageal adenocarcinoma, implying that these lesions were missed at the index screening endoscopy.7 While patchy distribution of dysplasia could be a culprit, a poor-quality endoscopic examination is a likely contributing factor as well. Adequate visualisation of the Barrett’s oesophagus segment, use of advanced imaging modalities and high-resolution endoscopes, and adherence to the Seattle biopsy protocol are all elements of a high-quality examination.8–11 However, the routine use of many of these measures remains limited.12 This is likely one of the reasons why the effectiveness of surveillance endoscopy in lowering oesophageal adenocarcinoma related mortality remains modest.13,14
Validated quality metrics to gauge the quality of Barrett’s oesophagus surveillance are currently lacking. While quality metrics in colonoscopy, notably the adenoma detection rate, have been shown to be associated with clinically important outcomes such as post-colonoscopy colorectal cancer, no comparable validated measures exist for endoscopy in patients with Barrett’s oesophagus.15 So far, most of the proposed quality indicators are based on weak evidence, not tied to relevant clinical outcomes, and based only on expert consensus opinions. One proposed metric for Barrett’s oesophagus endoscopic examination quality is the neoplasia detection rate, which is defined as the rate of high-grade dysplasia or oesophageal adenocarcinoma detected during the index screening endoscopic examination.16 In a recent meta-analysis, the neoplasia detection rate from tertiary referral centres was estimated to be 7% (95% CI: 4%−10%),17 while a population-based study reported a somewhat lower rate of 4.9% (95% CI: 3.8%−6.4%).18 For neoplasia detection rate to be a high value quality indicator, its correlation with important clinical outcome measures such as post- endoscopy Barrett’s neoplasia and oesophageal adenocarcinoma mortality is critical.19 We hypothesised that a higher neoplasia detection rate would correspond to a lower post-endoscopy Barrett’s neoplasia rate, defined as missed high-grade dysplasia or oesophageal adenocarcinoma detected on repeat examination within one year of a negative index screening endoscopy.
We aimed to conduct a systematic review and meta-analysis to determine the correlation between neoplasia detection rates in patients undergoing index screening endoscopy with subsequent rates of post-endoscopy Barrett’s neoplasia. We also aimed to assess a threshold neoplasia detection rate above which post- endoscopy Barrett’s neoplasia rates would substantially be reduced.
2 |. METHODS
2.1 |. Definitions
Barrett’s oesophagus was defined as the presence of columnar lined mucosa on endoscopy with specialised intestinal metaplasia on pathology.
The following definitions of baseline detection rates were used:
Neoplasia detection rate was defined as the proportion of patients with high-grade dysplasia or oesophageal adenocarcinoma among all Barrett’s oesophagus subjects on index screening endoscopy. This definition was based on previous literature.17,19 In addition, we also examined a more expanded definition of neoplasia detection rate defined as follows:
The expanded neoplasia detection rate was defined as the proportion of patients with low-grade dysplasia, high-grade dysplasia, or oesophageal adenocarcinoma among all subjects diagnosed with Barrett’s oesophagus on index screening endoscopy.
Post-endoscopy Barrett’s neoplasia was defined as the rate of high-grade dysplasia or oesophageal adenocarcinoma on repeat endoscopy within one year of an index screening examination revealing non-dysplastic Barrett’s oesophagus or low-grade dysplasia. This definition was based on prior studies.19
We used these different permutations of definitions to explore the mathematical correlation of the various baseline detection metrics with the clinical outcome of missed high-grade dysplasia or cancer.
2.2 |. Data sources and strategy
This systematic review was performed in accordance with the Cochrane Handbook for Systematic Reviews of Interventions and is reported in accordance with the Preferred Reporting Items for Systematic Reviews and Meta-Analyses (PRISMA) guidelines.20,21 A comprehensive search of several databases from inception to June 25, 2021, excluding animal studies, was conducted. The databases included Ovid MEDLINE(R) and Epub Ahead of Print, in-process, and other non-indexed Citations and Daily, Ovid Embase, Ovid Cochrane Central Register of Controlled Trials, Ovid Cochrane Database of Systematic Reviews, and Scopus. The search strategy was designed and conducted by an experienced librarian (LCH) with input from the study’s principal investigator. Controlled vocabulary supplemented with keywords were used to search for studies of interest. The actual strategy listing all search terms used and how they are combined is available in Appendix 1.
2.3 |. Study selection
Cohort studies were included if they fulfilled the following criteria: (a) studies performed on human subjects age ≥18 years; (b) sample size of ≥10 patients; (c) patients undergoing index screening endoscopy with no alarm symptoms in order to approximate a true Barrett’s oesophagus screening population; (d) studies that documented number of Barrett’s oesophagus patients with low-grade dysplasia, high-grade dysplasia, or oesophageal adenocarcinoma on index screening endoscopy; (e) studies that documented missed rates of high-grade dysplasia or oesophageal adenocarcinoma at 1 year or less after index screening endoscopy.
We excluded studies that (a) included patients having screening endoscopy for a known diagnosis of Barrett’s oesophagus; (b) were published as case reports, review articles, letters to editors, and conference abstracts. In instances where there was an overlap between two studies in the same population, only the most recently published study was included. Two authors (NH, AK) independently reviewed the title and abstract of studies identified in the primary search and excluded studies that did not address the research question, based on the pre-specified inclusion and exclusion criteria. The full text of remaining articles was reviewed to determine whether it contained relevant information. We established a priori that any discrepancy in article selection would be resolved by senior investigators (PGI, HF). However, this was not necessary as there was 100% agreement on the full-text articles that were included.
2.4 |. Data extraction
Variables of interest included type of study, sample size, mean age of patients, gender, mean length of the Barrett’s oesophagus segment, rate of adherence to Seattle biopsy protocol, methodology of pathology interpretation, proton pump inhibitor use, number of patients with non-dysplastic Barrett’s oesophagus, low-grade dysplasia, high-grade dysplasia, and oesophageal adenocarcinoma at index screening endoscopy, which were used to calculate the neoplasia detection rate, and post-endoscopy Barrett’s neoplasia cases at 1 year or less. Data was extracted by two independent authors (NH, AK) with any discrepancy resolved by discussion with the senior investigators (PI, HF). If variables were missing from the articles, we contacted the original study authors to request additional data.
2.5 |. Outcomes and quality assessment
For the primary outcome, we reported the neoplasia detection rate and post- endoscopy Barrett’s neoplasia rate per study and assessed the correlation between the two metrics. For secondary outcomes, we also reported the expanded neoplasia detection rate and its correlation to post-endoscopy Barrett’s neoplasia at 1 year.
To assess the quality of the included studies, we used a modified Newcastle-Ottawa scale for cohort studies based on a prior meta-analysis by Visrodia et al that used a modified quality assessment scale,7,22 consisting of eight questions scored up to one point each. The scoring system used to assess studies is shown in Table S1. Total scores of >5, 4–5, and <4 corresponded to high-, medium-, and low- quality studies, respectively.
2.6 |. Statistical analysis
Neoplasia detection rate was calculated using the formula: (number of patients with high-grade dysplasia or oesophageal adenocarcinoma on index screening endoscopy) divided by (total number of patients diagnosed with Barrett’s oesophagus on index screening endoscopy).
Expanded neoplasia detection rate was calculated using the formula: (number of patients with low-grade dysplasia or high-grade dysplasia or oesophageal adenocarcinoma on index screening endoscopy) divided by (total number of patients diagnosed with Barrett’s oesophagus on index screening endoscopy).
Post-endoscopy Barrett’s neoplasia rate was calculated using the formula: (number of patients with high-grade dysplasia or oesophageal adenocarcinoma within one year of index screening endoscopy showing no dysplasia or low-grade dysplasia) divided by (total number of patients with high-grade dysplasia or oesophageal adenocarcinoma either at index endoscopy or within one year of index endoscopy).
To account for differences in study sample size, proportions were pooled and weighted. We used the random-effects model described by DerSimonian and Laird to calculate pooled rates using logit transformation and in the meta-regression analysis.23,24 We assessed heterogeneity between study-specific estimates using inconsistency index (I2 statistic), which estimates the proportion of total variances across studies because of heterogeneity rather than by chance. Heterogeneity was assessed using the inconsistency index (I2 statistic). Values of I2 <30%, 30%−60%, 61%−75%, and >75% were classified as low, moderate, substantial, and considerable heterogeneity, respectively.25,26
When heterogeneity was noted, we investigated between study sources of heterogeneity using subgroup analyses by stratifying original estimates according to study characteristics. We performed pre-determined subgroup analyses based on geographic location (USA vs other countries), practice setting (referral vs community hospital), and study quality (high vs medium vs low). This meant that stratifying based on the subgroups could potentially explain heterogeneity noted in the overall analysis. We also calculated pooled estimates of outcomes of interest restricting to those studies that reported on use of gastrointestinal pathologist and adherence to Seattle biopsy protocol. Sensitivity analysis was also done by excluding studies that showed high risk of bias.
We performed a meta-regression analysis to assess the correlation between:
Neoplasia detection rate and post-endoscopy Barrett’s neoplasia rate, followed by adjusted analysis by age and sex individually.
The expanded neoplasia detection rate and post-endoscopy Barrett’s neoplasia rate.
In addition, to assess whether there was a difference in post-endoscopy Barrett’s neoplasia based on a neoplasia detection rate threshold, we performed a stratified analysis using a pre-specified cut-off neoplasia detection rate of 5%, presuming that a higher neoplasia detection rate would correlate with a lower post-endoscopy Barrett’s neoplasia rate. This cut-off was chosen based on results from prior studies.17,18
All analyses were performed using Comprehensive Meta- Analysis software (version 3, Biostat). For the main analysis, a P value of < 0.05 was considered significant.27
3 |. RESULTS
3.1 |. Search results
We identified a total of 6852 studies, of which 680 studies were excluded after abstract review. After applying our inclusion and exclusion criteria, the search was narrowed to 90 studies, all of which were reviewed in detail. Ultimately, 10 studies were included for analysis.18,28–36 The flowchart of the article search and selection process is outlined in Figure 1.
FIGURE 1.

PRISMA flow diagram
3.2 |. Study characteristics and quality
The study characteristics and results are highlighted in Tables 1 and 2. Approximately 63% (range: 56%−99%) of participants were male. The 10 studies were performed either in Europe (n = 7) or in the USA (n = 3). There was roughly even distribution of studies performed in the community (n = 6) and referral (n = 4) centres. Expert gastroenterology pathology review was documented in five studies (no gastrointestinal pathology review, n = 1; not reported, n = 4). Adherence to Seattle protocol for Barrett’s oesophagus biopsies was as follows: ≥50% adherence, n = 5; <50% adherence, n = 2; not reported, n = 3. Overall, four studies were categorised as high quality, five medium quality, and one low quality (Table S2).
TABLE 1.
Baseline study characteristics
| Study | Study population | Study period | Study design | Definition of Barrett’s oesophagus | Seattle protocol | Pathology |
|---|---|---|---|---|---|---|
| Bhat et al28 | Northern Ireland Barrett’s oesophagus registry | 1993–2005 | Retrospective | Columnar lined epithelium. We excluded patients with absent IM. | Not reported | Details of pathologist not reported |
| Dulai et al36 | Southern California Regional VA healthcare system | 1988–2002 | Retrospective | Identification of IM proximal to the GEJ | Followed in 30% exams | Pathology specimens from all sites were submitted to pathology laboratories at the major medical centres with accredited gastroenterology and pathology post-graduate training programs |
| Vogt et al31 | Gastroenterology divisions in St. Gallen and Bern, Switzerland | NA | Prospective | Any length of CLE containing goblet cells within distal oesophagus | Followed for all exams | All histologic samples were reviewed by the study-coordinating centre’s GI pathologist |
| Bani Hani et al33 | Leeds General Infirmary, UK | 1984–1996 | Retrospective | Columnar epithelium for at least 3 cm above the GEJ with presence of SIM | Not reported | Details not reported |
| Rugge et al34 | North eastern Italian registry, a prospective 13 centre registry | 2003–2011 | Retrospective analysis of prospectively collected data | Endoscopically visible gastric type epithelium extending at least 0.5 cm above GEJ with IM | Seattle biopsy protocol followed | High-grade dysplasia cases were always submitted to a gastrointestinal pathologist for second opinion and further discussed during audit meetings |
| Parasa et al30 | The Barrett’s Oesophagus Study database is a prospective multicentre outcomes project that involves a single large database of BE patients from 6 tertiary referral centres in the US and Europe | 1985–2014 | Retrospective analysis of prospectively collected data | Presence of columnar lined distal oesophagus with intestinal metaplasia | Seattle biopsy protocol followed | Verified by GI pathologist |
| Peters et al29 | Nationwide registry of Barrett’s patients in Netherlands | 2003–2012 | Retrospective | Presence of IM | Not clearly defined | Verified by 2 pathologists |
| Dhaliwal et al18 | Patients from 11 counties of south-eastern Minnesota | 1991–2018 | Retrospective | At least 1 cm of visible columnar mucosa in the oesophagus and histology demonstrating intestinal metaplasia | 60% followed Seattle biopsy protocol | All dysplastic histology was confirmed by expert gastrointestinal pathologists at Mayo Clinic Rochester |
| Vieth et al32 | Single centre, Institute of pathology in Bayreuth, Germany | 1990–1995 | Retrospective | Presence of SIM; followed WHO classification | Followed 32.5% of the time | All cases with neoplasia were assessed twice by two pathologist; discrepant cases were discussed and consensus was reached |
| Picardo et al35 | Single centre registry from Ireland | 2008–2012 | Retrospective | Identified by SIM in the oesophageal biopsies | Followed Seattle biopsy protocol | Verified by 2 independent specialist gastrointestinal pathologists |
Abbreviations: BE, Barrett’s oesophagus; CLE, columnar lined epithelium; GEJ, gastroesophageal junction; IM, intestinal metaplasia; SIM, specialised intestinal metaplasia.
TABLE 2.
Study results including the neoplasia detection and missed rates
| Study | Total number of patients | Males (%) | Mean Age (range) | Length of Barrett’s oesophagus | Use of proton pump inhibitor | Neoplasia detection rate | Post-endoscopy Barrett’s neoplasia |
|---|---|---|---|---|---|---|---|
| Bhat et al28 | 5343 | 2311 (59%) | 62 (45.4–76.4) | 81% unknown, 11.1% LSBE, 8% SSBE | NA | 96/5343 (1.7%) | 115/211 (54.5%) |
| Dulai et al36 | 650 | 643 (99%) | 60 (48–72) | 7.4 cm, 6.5 cm (dysplasia vs non-dysplasia group) | 147 (23%) |
66/650 (10.1%) | 9/75 (12%) |
| Vogt et al31 | 93 | 67 (72%) | 61 (21–84) | NA | NA | 11/93 (11.8%) | 2/13 (15.4%) |
| Bani Hani et al33 | 597 | 333 (56%) | 63 (2–94) | Mean length of BE: 6.2 cm (male), 5.9 cm (female) | NA | 24/509 (4.7%) | 7/31 (22.5%) |
| Rugge et al34 | 858 | 646 (75.3%) | 60 (51–68) | Mean 2 cm, 58% with SSBE and 42% had LSBE | NA | 11/858 (1.3%) | 6/17 (35%) |
| Parasa et al30 | 2697 | 2267 (84%) | 55.4 (SD 20.1) | 3.7 cm (SD 3.2) | NA | 115/2697 (4.3%) | 20/135 (14.8%) |
| Peters et al29 | 14 281 | NA | 63 (SD 11) | NA | NA | 1095/14 281 (7.7%) | 116/1211 (9.6%) |
| Dhaliwal et al18 | 1066 | 763 (71.6%) | 63 (SD 13) | 3.6 cm (SD 3.0) | NA | 53/1066 (4.9%) | 8/61 (13.1%) |
| Vieth et al32 | 816 | 507 (67.8%) | 60.9 (SD 14.2, range 15–94) | 315 had LSBE, 246 had SSBE, and 187 with no BE length documented | NA | 56/816 (6.9%) | 5/61 (8.2%) |
| Picardo et al35 | 1093 | 732 (67.1%) | Median (IQR) 59 (49–69) | Where specified, SSBE in 38% and LSBE in 34% | 919 (84%) |
60/1093 (5.5%) | 18/78 (23.1%) |
Abbreviations: LSBE, long segment Barrett’s oesophagus; NA, not available; SSBE, short segment Barrett’s oesophagus.
3.3 |. Pooled analysis
There were a total of 27 894 subjects with Barrett’s oesophagus in the included studies (studies ranged in population from 93 to 14 281 subjects). There were 1636 patients diagnosed with high-grade dysplasia or oesophageal adenocarcinoma on index screening endoscopy with an overall pooled neoplasia detection rate of 5.0% (95% CI: 3.4%−7.1%) (Figure 2). A total of 314 patients were diagnosed with high-grade dysplasia or oesophageal adenocarcinoma within 1 year of the index screening endoscopy showing only non-dysplastic Barrett’s oesophagus or low-grade dysplasia, for an overall post-endoscopy Barrett’s neoplasia rate of 19.6% (95% CI: 10.1%−34.7%; Figure 3). There was considerable heterogeneity in the pooled analyses of neoplasia detection rate (I2 = 97%) and post-endoscopy Barrett’s neoplasia rate (I2 = 96%). The pooled expanded neoplasia detection rate, based on data available from nine studies, was 14.4% (95% CI: 11.2%- 18.3%, I2 = 98%).18,29–36
FIGURE 2.
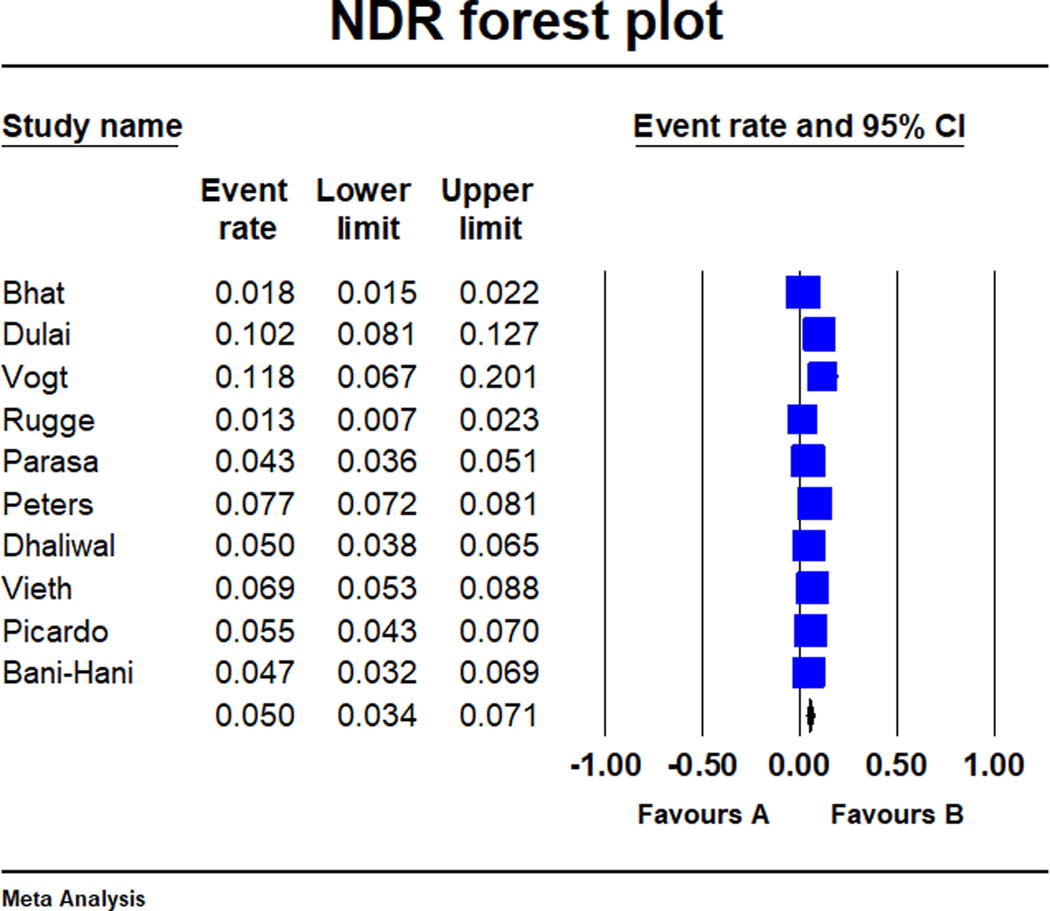
Forest-plot of the neoplasia detection rate in Barrett’s oesophagus across the 10 studies. Neoplasia detection rate was defined as the proportion of patients with high-grade dysplasia or oesophageal adenocarcinoma among all Barrett’s oesophagus subjects on index surveillance endoscopy
FIGURE 3.
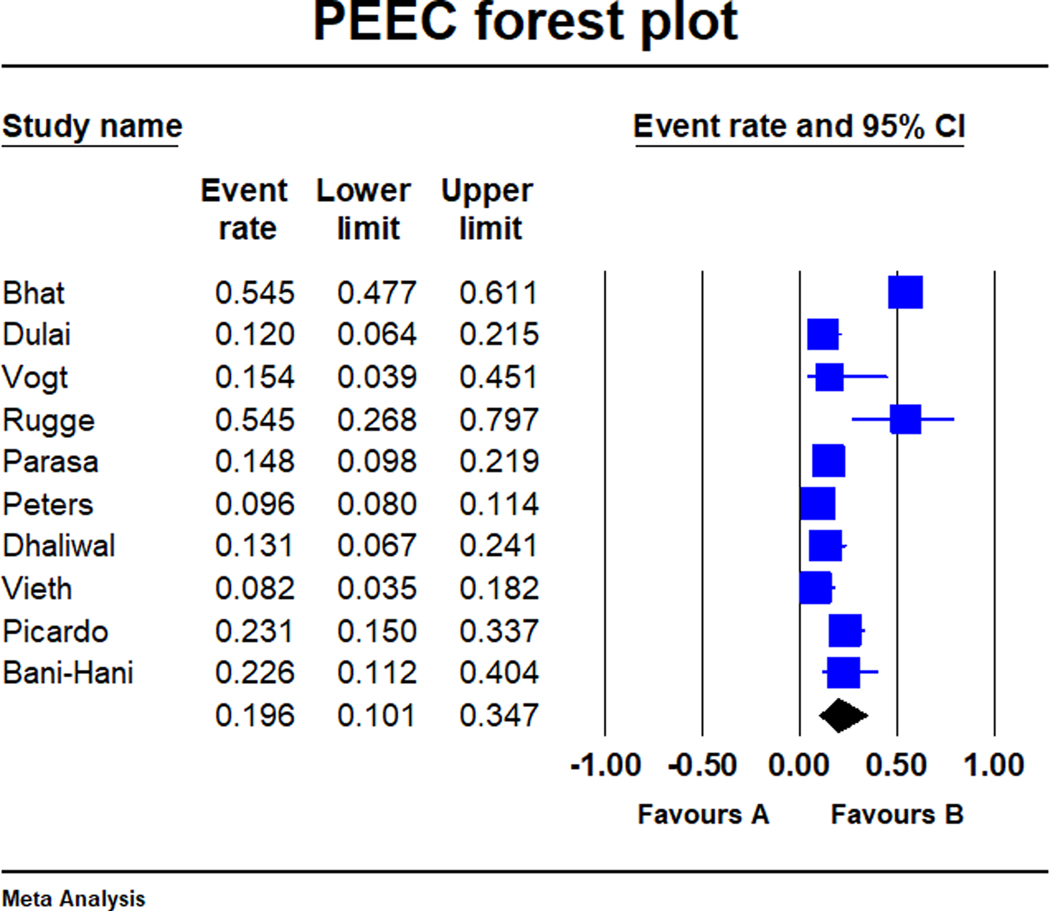
Forest-plot of the post- endoscopy Barrett’s neoplasia rate in Barrett’s oesophagus across the 10 studies. Post-endoscopy Barrett’s neoplasia was defined as the rate of high-grade dysplasia or oesophageal adenocarcinoma on repeat endoscopy within one year of an index surveillance examination revealing non-dysplastic Barrett’s oesophagus or low-grade dysplasia
3.4 |. Meta-regression analysis
There was a significant inverse relationship between neoplasia detection rate and post-endoscopy Barrett’s neoplasia on meta-regression (coefficient −3.50, 95% CI: −4.63 to −2.37, P < 0.01; Figure 4) with the association also remaining significant when adjusting for age (P = 0.01) and sex (P < 0.01) individually. In other words, with every 1% increase in neoplasia detection rate, post-endoscopy Barrett’s neoplasia decreased by 3.50%.
FIGURE 4.
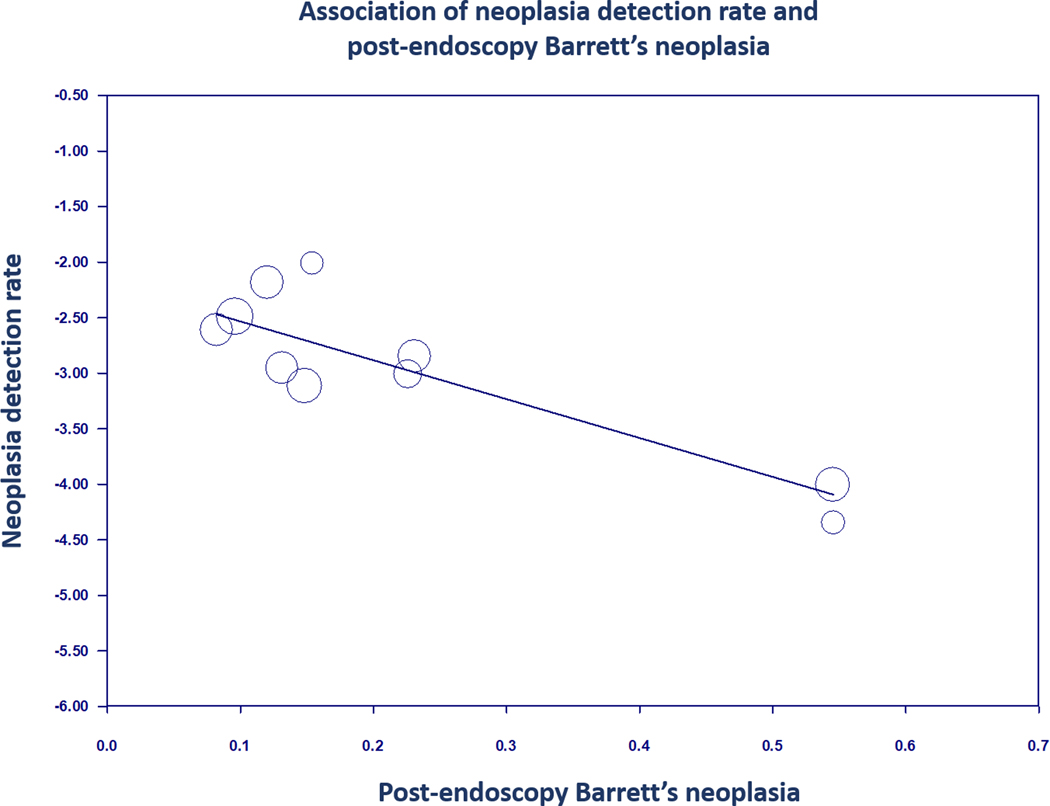
Regression of neoplasia detection rate on post-endoscopy Barrett’s neoplasia in Barrett’s oesophagus
There was also a significant inverse relationship between the expanded neoplasia detection rate and post-endoscopy Barrett’s neoplasia on meta-regression (coefficient −1.66, 95% CI: −2.90 to −0.42, P < 0.01; Figure 5) with the association remaining significant when adjusting for age and sex individually.
FIGURE 5.
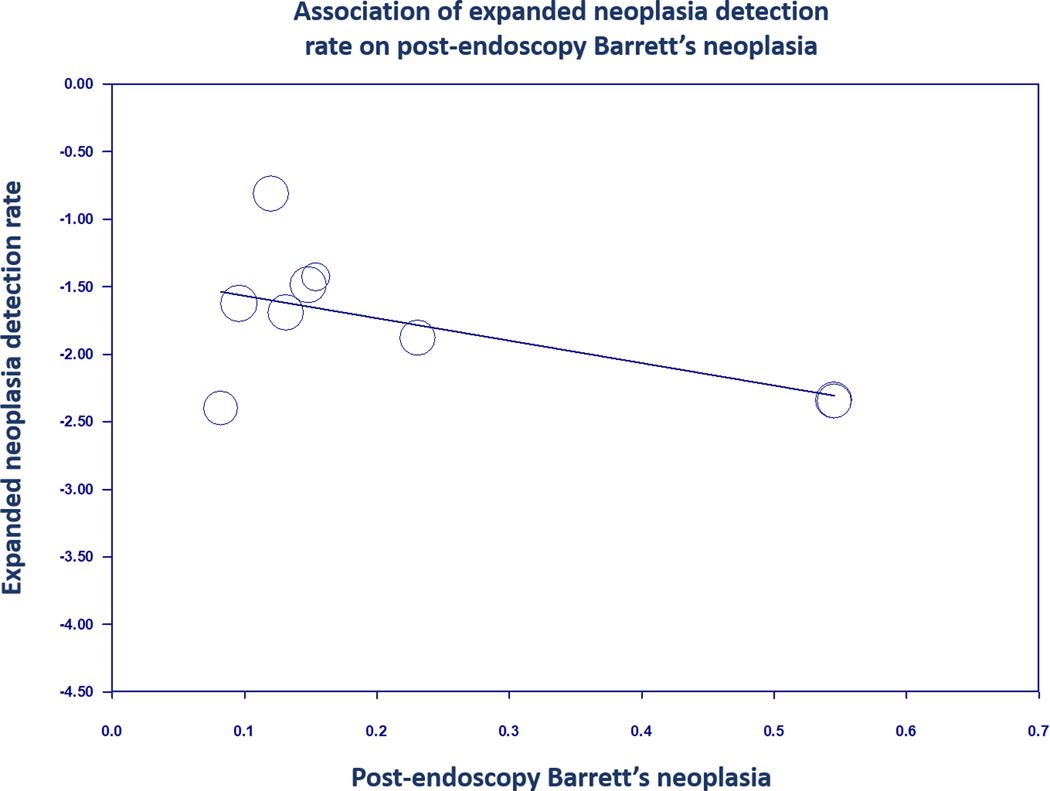
Regression of expanded neoplasia detection rate on post-endoscopy Barrett’s neoplasia in Barrett’s oesophagus
In the a priori planned stratified analysis with a neoplasia detection rate threshold of 5%, the post-endoscopy Barrett’s neoplasia was more than two fold higher, at 28.4% (5 studies, 95% CI: 14.6%−47.9%) for studies with neoplasia detection rate <5% vs lower at 12.8% (five studies, 95% CI: 5.9%−25.6%) for studies with neoplasia detection rate >5%. However, the difference in post-endoscopy Barrett’s neoplasia rates between the two groups did not reach statistical significance (P = 0.10).
3.5 |. Subgroup and sensitivity analyses
On subgroup analysis, neoplasia detection rate did not vary significantly by location (P = 0.55), practice setting (P = 0.31), or study quality (P = 0.42; Table S3).
In addition to subgroup analyses, we performed sensitivity analyses restricting to studies that reported data on expert gastrointestinal pathologist interpretation and adherence to Seattle protocol. Neoplasia detection rate did not vary with use of expert gastrointestinal pathologist interpretation (five studies, NDR 4.5%, 95% CI: 3.1%−6.7%, I2 = 87%) or adherence to Seattle protocol (seven studies, NDR 5.5%, 95% CI: 3.8%−7.8%, I2 = 91%) compared to the neoplasia detection rate from all 10 studies.
It was noted that the Bhat et al study had a high post-endoscopy Barrett’s neoplasia rate of 54.5% as compared to the other studies (range: 8.2%−35%), and hence a sensitivity analysis was performed excluding the Bhat et al study. While post-endoscopy Barrett’s neoplasia rate dropped to 15.9% when excluding Bhat et al, this was not significantly different from our overall estimate of 19.6%.
4 |. DISCUSSION
In this systematic review and meta-analysis, we demonstrate a statistically significant inverse correlation between neoplasia detection rate, a proposed Barrett’s oesophagus endoscopy quality metric and a relevant clinical outcome, namely post-endoscopy Barrett’s neoplasia. We found that with every 1% increase in the neoplasia detection rate, there was a decrease of 3.50% in post-endoscopy Barrett’s neoplasia. This correlation remained significant after adjusting for age and sex individually. While neoplasia detection rate as currently defined does not include low-grade dysplasia (which remains a histologically heterogeneous but potentially actionable diagnosis), we also observed a significant inverse correlation between expanded neoplasia detection rate and post-endoscopy Barrett’s neoplasia, further supporting the rationale for a higher detection rate on index screening endoscopy. While these associations are biologically plausible and some are mathematically expected, our study is the first to date to correlate these metrics and identify gaps in the current literature. We did observe high heterogeneity with this analysis and a priori planned subgroup analyses did not explain or mitigate this heterogeneity.
An important implication of our findings is that the quality of the index screening endoscopy in Barrett’s oesophagus is critical as subtle lesions harboring early high-grade dysplasia or oesophageal adenocarcinoma can be easily missed if the exam is not performed in a careful, methodical manner with adequate inspection and sampling of the entire Barrett’s oesophagus segment (using both targeted and four-quadrant Seattle protocol biopsies). We chose a combination of high-grade dysplasia and oesophageal adenocarcinoma as an outcome variable (defined as post-endoscopy Barrett’s neoplasia) given that endoscopic mucosal resection upstages the histologic diagnosis to oesophageal adenocarcinoma in 30%−40% of cases with high-grade dysplasia.37 Early detection of high-grade dysplasia or oesophageal adenocarcinoma allows for endoscopic eradication therapy which has been shown to prevent progression to oesophageal adenocarcinoma and lead to >80% cancer free survival in early stage cancer as compared to esophagectomy.38
As we and others have reported, there is a substantial rate of high-grade dysplasia and oesophageal adenocarcinoma that is missed on initial screening endoscopy.7 Developing a quality metric such as neoplasia detection rate is clinically important and may provide an objective measure to evaluate the quality of endoscopic examination in patients with Barrett’s oesophagus. A relevant precedent exists in the colonoscopy quality literature, with the establishment of quality metrics such as adenoma detection rate, which has been validated in large studies and shown to have an inverse relationship with risk of post-colonoscopy colorectal cancer.39,40 Of note, the adenoma detection rate includes all adenomatous polyps (both low-grade dysplasia and high-grade dysplasia). While the hope is that the neoplasia detection rate (or one of the alternate metrics defined in this paper) will evolve similarly in Barrett’s oesophagus endoscopy, one challenge is that esophageal neoplasia is less prevalent than colorectal cancer and universal screening for Barrett’s oesophagus is not recommended. Thus, large scale and adequately powered studies will be needed to correlate neoplasia (or dysplasia) detection rate(s) (LGD + HGD) with robust outcomes like (post-endoscopy) oesophageal adenocarcinoma incidence and mortality. This study sets the stage for such investigations. Additionally, as highlighted in a recent editorial, the volume of Barrett’s oesophagus surveillance endoscopy is substantially lower at a per endoscopist level than screening colonoscopy and hence establishing this association at an endoscopist level may be challenging.41 Alternative metrics such as neoplasia or dysplasia detection rate at a practice or institutional level may have to be considered.
As an outcome measure, post- endoscopy Barrett’s neoplasia may be associated with and serve as a reflection of several process measures such as adequate inspection time, obtaining an adequate number of biopsies, and use of dye- based or electronic chromoendoscopy to detect dysplastic lesions. In addition, there are other modalities on the horizon that are being developed for improved Barrett’s oesophagus dysplasia detection such as volumetric laser endomicroscopy, wide-area transepithelial sampling with computer-assisted three-dimensional analysis, and biomarker assisted dysplasia detection. While our analysis did not show a significant difference in neoplasia detection rate in studies that used Seattle biopsy protocol or a gastrointestinal pathologist vs those that did not, this may be due to the small number of included studies. Future validation of neoplasia detection rate as a quality metric could carry significant implications on several levels. First, it could provide a uniform parameter by which quality of initial endoscopic surveillance can be evaluated. Second, it could also satisfy regulatory requirements, as payers will likely continue to demand documentation of high-value care in the transition towards a value-based payment system.
In this systematic review and meta- analysis, we found an overall pooled neoplasia detection rate of 5.0%. A previous meta-analysis proposed a benchmark neoplasia detection rate of 4%; however, this figure has not been correlated with outcome measures.17 While we found that with neoplasia detection rate <5%, the post-endoscopy Barrett’s neoplasia rate is more than two-fold higher compared to the post-endoscopy Barrett’s neoplasia rate with neoplasia detection rate >5%, this approached but did not meet the threshold for statistical significance. Additional studies will be needed to establish the optimal neoplasia detection rate thresholds, and it remains to be seen if these should be adapted based on practice setting. For example, it may be reasonable to assume a higher neoplasia detection rate benchmark for tertiary referral centres compared to those in community general gastroenterology practices.
Our study has some notable strengths. This is the first study to correlate neoplasia detection rate with a clinically relevant outcome measure such as post-endoscopy Barrett’s neoplasia. We followed robust methodology using a comprehensive search strategy, pre-defined inclusion and exclusion criteria, and quantification of study quality. We also performed various subgroup analyses to identify sources of heterogeneity between studies. Lastly, our study findings raise the possibility of using a neoplasia detection rate of 5% as a benchmark for assessing initial endoscopic evaluation in Barrett’s oesophagus patients if validated in other studies.
Our study also has a number of limitations. In addition to the small number of studies that met inclusion criteria and their retrospective design, a majority of the studies included in this meta-analysis did not have neoplasia detection rate and post-endoscopy Barrett’s neoplasia as primary outcome measures. It is also difficult to ascertain whether the definition of index screening endoscopy was met in individual studies. In addition, several studies originate from tertiary referral centres. In those cases, index screening endoscopies may not have been truly index and instead, may have been referrals for assessment or management of dysplasia. Additionally, due to a paucity of studies (N = 5), we were unable to perform a metaregression of the association between dysplasia detection rate (LGD + HGD) and post-endoscopy oesophageal adenocarcinoma.
There was considerable heterogeneity between studies in terms of Barrett’s oesophagus diagnosis, biopsy protocols, frequency of surveillance, documentation of length of Barrett’s oesophagus or visible lesions, use of high definition scopes or advanced imaging modalities and period of data collection, amongst several other parameters. Furthermore, the definition of post-endoscopy Barrett’s neoplasia used in this manuscript was derived from the recent definition set forth by Wani et al, with the inherent limitation that including high grade within 1 year of low-grade dysplasia diagnosis is questionable as this may be natural evolution of disease detected within adequate surveillance as opposed to a missed lesion.19 However, we opted to maintain this definition to remain consistent with the previously published literature. In addition, while the rates of post- endoscopy Barrett’s neoplasia were generally high, one study by Bhat et al had a particularly high post-endoscopy Barrett’s neoplasia rate that may have slightly skewed the overall results. The causes behind this are not entirely clear but it is important to note that the study did not report adherence to Seattle protocol or use of a gastrointestinal pathologist.28 A sensitivity analysis excluding this study did not change the overall results. Furthermore, the included studies spanned different time periods and it is possible that newer generation endoscopes could have influenced the results of more recent studies, though evidence from other studies does not appear to support this.18,42 In addition, while we were able to establish a correlation between neoplasia detection rate and post-endoscopy Barrett’s neoplasia rate, it is important to note that this is does not necessarily imply causation.
In conclusion, establishing endoscopic quality indicators in Barrett’s oesophagus that are linked to clinically significant outcome measures is imperative. Adoption of metrics such as neoplasia (or dysplasia) detection rate (akin to adenoma detection rate in colonoscopy), may achieve higher quality and more cost-effective care. Future studies are needed to further validate the association between neoplasia detection rate and post-endoscopy Barrett’s neoplasia (and potentially oesophageal adenocarcinoma incidence and mortality), establish a neoplasia detection rate threshold that endoscopists should strive to meet, and explore factors that could lead to higher neoplasia detection rate and lower post- endoscopy Barrett’s neoplasia rates.
Supplementary Material
ACKNOWLEDGEMENT
Declaration of personal interests: Nour Hamade, Amrit K. Kamboj, Rajesh Krishnamoorthi, Siddharth Singh, Charles J. Kahi and Hala Fatima: None. David A. Katzka: Research funding from Shire Pharmaceuticals. Prasad Iyer: Research funding from Exact Sciences and Pentax Medical, Consultant: Medtronic.
Funding information
Supported in part by NCI R01 grant CA 241164 to PGI and NIDDK grant DK117058 to SS.
APPENDIX 1.
Actual Search Strategies
OVID
Database(s): Embase 1988 to 2021 Week 24, Ovid MEDLINE(R) and Epub Ahead of Print, In- Process, In-Data-Review & Other Non-Indexed Citations 1996 to June 24, 2021, EBM Reviews—Cochrane Central Register of Controlled Trials May 2021, EBM Reviews—Cochrane Database of Systematic Reviews 2005 to June 23, 2021
Search Strategy:
| # | Searches |
| 1 | exp “Barrett Esophagus”/ |
| 2 | (barret* adj10 (esophag* or oesophag* or metaplasia or “meta-plasia” or syndrome or dyslpas* or epitheli*)).ti,ab,hw,kw. |
| 3 | ((specialized or columnar or intestinal) adj2 (epitheli* or metaplasia or mucosa)).ti,ab,hw,kw. |
| 4 | or/1–3 |
| 5 | (nondysplas* or “non-dysplas*” or lgd or lgbe or “premalignan* or pre-malignan*” or premetast* or “pre-metastat” or precancerous or “pre-cancerous” or precursor).ti,ab,hw,kw. |
| 6 | ((indefinite or “non-invasive”) and dysplas*).ti,ab,hw,kw. |
| 7 | (early adj3 (neoplas* or negative or detect*)).ti,ab,hw,kw. |
| 8 | (dysplasia/ or exp gastrointestinal dysplasia/ or esophagus dysplasia/ or (metaplas* or dysplas*).ti,ab,hw,kw.) and “low-grade”.ti,ab,hw,kw. |
| 9 | ((risk or miss or missed or develop* or surveill* or “low-grade”) adj10 (dysplasia or adenocarcinoma)).ti,ab,hw,kw. |
| 10 | *Precancerous Conditions/ |
| 11 | Esophagus/ or (esophag* or oesophag* or barrett*).ti. |
| 12 | 10 and 11 |
| 13 | or/5–9,12 |
| 14 | Disease Progression/ or “Cell Transformation, Neoplastic”/ |
| 15 | “Adenocarcinoma”/ |
| 16 | “Esophageal Neoplasms”/ or esophageal adenocarcinoma/ |
| 17 | (progression or adenocarcinoma).ti,ab,hw,kw. or (worsen* or “clinical course” or “clinical pathway*”).ti,ab. or (detect* adj3 (neoplas* or dysplas*)).ti. |
| 18 | (neoplas* or cancer* or carcino* or cancer* or malignan* or tumor* or tumour*).ti,ab,hw,kw. |
| 19 | “high-grade”.ti,ab,hw,kw. |
| 20 | (invasive or hgd).ti,ab. |
| 21 | or/14–20 |
| 22 | 4 and 13 and 21 |
| 23 | (detect* or baseline or miss or missed or diagnos* or recogniz* or recognis* or screen* or follow* or early or yield or index or indices). ti,ab,hw,kw. |
| 24 | Population Surveillance/ or disease surveillance/ or (population or surveill*).ti,ab. |
| 25 | Incidence/ or incidence.ti,ab,kw. |
| 26 | Prevalence/ or prevalence.ti,ab,kw. |
| 27 | exp Epidemiology/ or epidemiolog*.ti,ab. or ep.fs. |
| 28 | *Risk Assessment/ or *Risk Factors/ or *Risk/ or risk.ti. |
| 29 | exp *Cohort Studies/ or exp *retrospective study/ or exp *prospective study/ or (cohort* or retrospective or prospective*).ti,ab. |
| 30 | *Esophagoscopy/ or exp *Endoscopy, Digestive System/ or (esophagoduodenoscop* or oesophagoduodenoscop* or esophagoscop* or oesophagoscop* or endoscop* or microendoscop*).ti,ab. |
| 31 | or/23–30 |
| 32 | 22 and 31 |
| 33 | (exp animals/ or exp nonhuman/) not exp humans/ |
| 34 | ((alpaca or alpacas or amphibian or amphibians or animal or animals or antelope or armadillo or armadillos or avian or baboon or baboons or beagle or beagles or bee or bees or bird or birds or bison or bovine or buffalo or buffaloes or buffalos or “c elegans” or “Caenorhabditis elegans” or camel or camels or canine or canines or carp or cats or cattle or chick or chicken or chickens or chicks or chimp or chimpanze or chimpanzees or chimps or cow or cows or “D melanogaster” or “dairy calf” or “dairy calves” or deer or dog or dogs or donkey or donkeys or drosophila or “Drosophila melanogaster” or duck or duckling or ducklings or ducks or equid or equids or equine or equines or feline or felines or ferret or ferrets or finch or finches or fish or flatworm or flatworms or fox or foxes or frog or frogs or “fruit flies” or “fruit fly” or “G mellonella” or “Galleria mellonella” or geese or gerbil or gerbils or goat or goats or goose or gorilla or gorillas or hamster or hamsters or hare or hares or heifer or heifers or horse or horses or insect or insects or jellyfish or kangaroo or kangaroos or kitten or kittens or lagomorph or lagomorphs or lamb or lambs or llama or llamas or macaque or macaques or macaw or macaws or marmoset or marmosets or mice or minipig or minipigs or mink or minks or monkey or monkeys or mouse or mule or mules or nematode or nematodes or octopus or octopuses or orangutan or “orang-utan” or orangutans or “orang-utans” or oxen or parrot or parrots or pig or pigeon or pigeons or piglet or piglets or pigs or porcine or primate or primates or quail or rabbit or rabbits or rat or rats or reptile or reptiles or rodent or rodents or ruminant or ruminants or salmon or sheep or shrimp or slug or slugs or swine or tamarin or tamarins or toad or toads or trout or urchin or urchins or vole or voles or waxworm or waxworms or worm or worms or xenopus or “zebra fish” or zebrafish) not (human or humans or patient or patients)).ti,ab,hw,kw. |
| 35 | (rat or rats or mice or mouse or murine or pig or pigs or porcine or swine or dog or dogs).ti. |
| 36 | or/33–35 |
| 37 | 32 not 36 |
| 38 | (conference abstract or conference review or editorial or erratum or note or addresses or autobiography or bibliography or biography or blogs or comment or dictionary or directory or interactive tutorial or interview or lectures or legal cases or legislation or news or newspaper article or patient education handout or periodical index or portraits or published erratum or video-audio media or webcasts). mp. or conference abstract.st. |
| 39 | 37 not 38 |
| 40 | remove duplicates from 39 |
SCOPUS
| 1 | TITLE-ABS-KEY (barret* w/10 (esophag* or oesophag* or metaplasia or “meta-plasia” or syndrome or dyslpas* or epitheli*)) |
| 2 | TITLE-ABS-KEY ((specialized or columnar or intestinal) w/2 (epitheli* or metaplasia or mucosa)) |
| 3 | 1 or 2 |
| 4 | TITLE-ABS-KEY (nondysplas* or “non-dysplas*” or lgd or lgbe or “premalignan* or pre-malignan*” or premetast* or “pre-metastat” or precancerous or “pre-cancerous” or precursor) |
| 5 | TITLE-ABS-KEY ((indefinite or “non-invasive” or “low-grade”) and dysplas*) |
| 6 | TITLE-ABS-KEY (early w/3 (neoplas* or negative or detect*)) |
| 7 | 4 or 5 or 6 |
| 8 | TITLE-ABS-KEY (progression or adenocarcinoma or worsen* or “clinical course” or “clinical pathway*” or neoplas* or cancer* or carcino* or cancer* or malignan* or tumor* or tumour* or “high-grade” or invasive or hgd) |
| 9 | TITLE (detect* w/3 (neoplas* or dysplas*)) |
| 10 | 8 or 9 |
| 11 | TITLE-ABS-KEY (detect* or surveill* or incidence or prevalence or risk or baseline or miss or missed or diagnos* or recogniz* or recognis* or screen* or follow* or early or yield or index or indices or esophagoduodenoscop* or oesophagoduodenoscop*) |
| 12 | 3 and 7 and 10 and 11 |
| 13 | INDEX(embase) OR INDEX(medline) OR PMID(0* OR 1* OR 2* OR 3* OR 4* OR 5* OR 6* OR 7* OR 8* OR 9*) |
| 14 | 12 not 13 |
| 15 | DOCTYPE(ed) OR DOCTYPE(bk) OR DOCTYPE(er) OR DOCTYPE(no) OR DOCTYPE(sh) OR DOCTYPE(ch) |
| 16 | 14 not 15 |
| 17 | ( TITLE-ABS-KEY ( ( alpaca OR alpacas OR amphibian OR amphibians OR animal OR animals OR antelope OR armadillo OR armadillos OR avian OR baboon OR baboons OR beagle OR beagles OR bee OR bees OR bird OR birds OR bison OR bovine OR buffalo OR buffaloes OR buffalos OR “c elegans” OR “Caenorhabditis elegans” OR camel OR camels OR canine OR canines OR carp OR cats OR cattle OR chick OR chicken OR chickens OR chicks OR chimp OR chimpanze OR chimpanzees OR chimps OR cow OR cows OR “D melanogaster” OR “dairy calf” OR “dairy calves” OR deer OR dog OR dogs OR donkey OR donkeys OR drosophila OR “Drosophila melanogaster” OR duck OR duckling OR ducklings OR ducks OR equid OR equids OR equine OR equines OR feline OR felines OR ferret OR ferrets OR finch OR finches OR fish OR flatworm OR flatworms OR fox OR foxes OR frog OR frogs OR “fruit flies” OR “fruit fly” OR “G mellonella” OR “Galleria mellonella” OR geese OR gerbil OR gerbils OR goat OR goats OR goose OR gorilla OR gorillas OR hamster OR hamsters OR hare OR hares OR heifer OR heifers OR horse OR horses OR insect OR insects OR jellyfish OR kangaroo OR kangaroos OR kitten OR kittens OR lagomorph OR lagomorphs OR lamb OR lambs OR llama OR llamas OR macaque OR macaques OR macaw OR macaws OR marmoset OR marmosets OR mice OR minipig OR minipigs OR mink OR minks OR monkey OR monkeys OR mouse OR mule OR mules OR nematode OR nematodes OR octopus OR octopuses OR orangutan OR “orang-utan” OR orangutans OR “orang-utans” OR oxen OR parrot OR parrots OR pig OR pigeon OR pigeons OR piglet OR piglets OR pigs OR porcine OR primate OR primates OR quail OR rabbit OR rabbits OR rat OR rats OR reptile OR reptiles OR rodent OR rodents OR ruminant OR ruminants OR salmon OR sheep OR shrimp OR slug OR slugs OR swine OR tamarin OR tamarins OR toad OR toads OR trout OR urchin OR urchins OR vole OR voles OR waxworm OR waxworms OR worm OR worms OR xenopus OR “zebra fish” OR zebrafish ) AND NOT ( human OR humans OR patient OR patients ) ) ) |
| 18 | 16 not 17 |
Footnotes
As part of AP&T’s peer-review process, a technical check of this meta-analysis was performed by Dr Yuhong Yuan. The Handling Editor for this article was Dr Colin Howden, and it was accepted for publication after full peer-review.
SUPPORTING INFORMATION
Additional supporting information will be found online in the Supporting Information section.
DATA AVAILABILITY STATEMENT
The data that support the findings of this study are openly available in PubMed.
REFERENCES
- 1.Siegel RL, Miller KD, Jemal A. Cancer statistics, 2019. CA Cancer J Clin. 2019;69:7–34. [DOI] [PubMed] [Google Scholar]
- 2.Hur C, Miller M, Kong CY, et al. Trends in esophageal adenocarcinoma incidence and mortality. Cancer. 2013;119:1149–1158. [DOI] [PMC free article] [PubMed] [Google Scholar]
- 3.Hvid-Jensen F, Pedersen L, Drewes AM, Sørensen HT, Funch-Jensen P. Incidence of adenocarcinoma among patients with Barrett’s esophagus. N Engl J Med. 2011;365:1375–1383. [DOI] [PubMed] [Google Scholar]
- 4.Ebigbo A, Karstensen JG, Aabakken L, et al. Esophageal stenting for benign and malignant disease: European Society of Gastrointestinal Endoscopy (ESGE) Cascade Guideline. Endosc Int Open. 2019;7:E833–e836. [DOI] [PMC free article] [PubMed] [Google Scholar]
- 5.Sharma P, Shaheen NJ, Katzka D, Bergman JJGHM. AGA Clinical Practice Update on endoscopic treatment of Barrett’s esophagus with dysplasia and/or early cancer: expert review. Gastroenterology. 2020;158:760–769. [DOI] [PubMed] [Google Scholar]
- 6.Shaheen NJ, Falk GW, Iyer PG, Gerson LB. ACG Clinical Guideline: diagnosis and management of Barrett’s esophagus. Am J Gastroenterol. 2016;111:30–50; quiz 51. [DOI] [PMC free article] [PubMed] [Google Scholar]
- 7.Visrodia K, Singh S, Krishnamoorthi R, et al. Magnitude of missed esophageal adenocarcinoma after Barrett’s esophagus diagnosis: a systematic review and meta- analysis. Gastroenterology. 2016;150: 599–607.e7; quiz e14–5. [DOI] [PMC free article] [PubMed] [Google Scholar]
- 8.Gupta N, Gaddam S, Wani SB, Bansal A, Rastogi A, Sharma P. Longer inspection time is associated with increased detection of high-grade dysplasia and esophageal adenocarcinoma in Barrett’s esophagus. Gastrointest Endosc. 2012;76:531–538. [DOI] [PubMed] [Google Scholar]
- 9.ASGE Technology Committee, Thosani N, Abu Dayyeh BK, et al. ASGE Technology Committee systematic review and meta-analysis assessing the ASGE Preservation and Incorporation of Valuable Endoscopic Innovations thresholds for adopting real-time imaging-assisted endoscopic targeted biopsy during endoscopic surveillance of Barrett’s esophagus. Gastrointest Endosc. 2016;83:684–698.e7. [DOI] [PubMed] [Google Scholar]
- 10.Alvarez Herrero L, Curvers WL, van Vilsteren FG, et al. Validation of the Prague C&M classification of Barrett’s esophagus in clinical practice. Endoscopy. 2013;45:876–882. [DOI] [PubMed] [Google Scholar]
- 11.Gorrepati VS, Sharma P. How should we report endoscopic results in patient’s with Barrett’s esophagus? Dig Dis Sci. 2018;63:2115–2121. [DOI] [PubMed] [Google Scholar]
- 12.Abrams JA, Kapel RC, Lindberg GM, et al. Adherence to biopsy guidelines for Barrett’s esophagus surveillance in the community setting in the United States. Clin Gastroenterol Hepatol. 2009;7:736–742; quiz 710. [DOI] [PMC free article] [PubMed] [Google Scholar]
- 13.Codipilly DC, Chandar AK, Singh S, et al. The effect of endoscopic surveillance in patients with Barrett’s esophagus: a systematic review and meta- analysis. Gastroenterology. 2018;154:2068–2086.e5. [DOI] [PMC free article] [PubMed] [Google Scholar]
- 14.Verbeek RE, Leenders M, ten Kate FJW, et al. Surveillance of Barrett’s esophagus and mortality from esophageal adenocarcinoma: a population-based cohort study. Am J Gastroenterol. 2014;109:1215–1222. [DOI] [PubMed] [Google Scholar]
- 15.Rex DK, Schoenfeld PS, Cohen J, et al. Quality indicators for colonoscopy. Gastrointest Endosc. 2015;81:31–53. [DOI] [PubMed] [Google Scholar]
- 16.Desai M, Sharma P. What quality metrics should we apply in Barrett’s esophagus? Am J Gastroenterol. 2019;114:1197–1198. [DOI] [PubMed] [Google Scholar]
- 17.Parasa S, Desai M, Vittal A, et al. Estimating neoplasia detection rate (NDR) in patients with Barrett’s oesophagus based on index endoscopy: a systematic review and meta-analysis. Gut. 2019;68:2122–2128. [DOI] [PubMed] [Google Scholar]
- 18.Dhaliwal L, Codipilly DC, Gandhi P, et al. Neoplasia detection rate (NDR) in Barrett’s esophagus and its impact on missed dysplasia: results from a large population- based database. Clin Gastroenterol Hepatol. 2021;19:922–929.e1. [DOI] [PMC free article] [PubMed] [Google Scholar]
- 19.Wani S, Gyawali CP, Katzka DA. AGA Clinical Practice Update on reducing rates of post-endoscopy esophageal adenocarcinoma: commentary. Gastroenterology. 2020;159:1533–1537. [DOI] [PubMed] [Google Scholar]
- 20.Higgins JP. Cochrane Handbook for Systematic Reviews of Interventions. Version 5.1.0 [updated March 2011]. The Cochrane Collaboration; 2011. www.cochrane-handbook.org [Google Scholar]
- 21.Moher D, Liberati A, Tetzlaff J, Altman DG. Preferred reporting items for systematic reviews and meta- analyses: the PRISMA statement. PLoS Med. 2009;6:e1000097. [DOI] [PMC free article] [PubMed] [Google Scholar]
- 22.Stang A. Critical evaluation of the Newcastle-Ottawa scale for the assessment of the quality of nonrandomized studies in meta-analyses. Eur J Epidemiol. 2010;25:603–605. [DOI] [PubMed] [Google Scholar]
- 23.DerSimonian R, Laird N. Meta-analysis in clinical trials revisited. Contemp Clin Trials. 2015;45:139–145. [DOI] [PMC free article] [PubMed] [Google Scholar]
- 24.Freeman MF, Tukey JW. Transformations related to the angular and the square root. Ann Math Stat. 1950;21:607–611. [Google Scholar]
- 25.Higgins JP, Thompson SG, Deeks JJ, Altman DG. Measuring inconsistency in meta-analyses. BMJ. 2003;327:557–560. [DOI] [PMC free article] [PubMed] [Google Scholar]
- 26.Guyatt GH, Oxman AD, Kunz R, et al. GRADE guidelines: 7. Rating the quality of evidence–inconsistency. J Clin Epidemiol. 2011;64:1294–1302. [DOI] [PubMed] [Google Scholar]
- 27.Donegan S, Williams L, Dias S, Tudur-Smith C, Welton N. Exploring treatment by covariate interactions using subgroup analysis and meta-regression in Cochrane reviews: a review of recent practice. PLoS One. 2015;10:e0128804. [DOI] [PMC free article] [PubMed] [Google Scholar]
- 28.Bhat S, Coleman HG, Yousef F, et al. Risk of malignant progression in Barrett’s esophagus patients: results from a large population-based study. J Natl Cancer Inst. 2011;103:1049–1057. [DOI] [PMC free article] [PubMed] [Google Scholar]
- 29.Peters Y, Honing J, Kievit W, et al. Incidence of progression of persistent nondysplastic Barrett’s esophagus to malignancy. Clin Gastroenterol Hepatol. 2019;17:869–877.e5. [DOI] [PubMed] [Google Scholar]
- 30.Parasa S, Vennalaganti S, Gaddam S, et al. Development and validation of a model to determine risk of progression of Barrett’s esophagus to neoplasia. Gastroenterology. 2018;154:1282–1289.e2. [DOI] [PubMed] [Google Scholar]
- 31.Vogt N, Schönegg R, Gschossmann JM, Borovicka J. Benefit of baseline cytometry for surveillance of patients with Barrett’s esophagus. Surg Endosc. 2010;24:1144–1150. [DOI] [PubMed] [Google Scholar]
- 32.Vieth M, Schubert B, Lang-Schwarz K, Stolte M. Frequency of Barrett’s neoplasia after initial negative endoscopy with biopsy: a long-term histopathological follow-up study. Endoscopy. 2006;38:1201–1205. [DOI] [PubMed] [Google Scholar]
- 33.Bani-Hani K, Sue-Ling H, Johnston D, Axon AT, Martin IG. Barrett’s oesophagus: results from a 13-year surveillance programme. Eur J Gastroenterol Hepatol. 2000;12:649–654. [PubMed] [Google Scholar]
- 34.Rugge M, Zaninotto G, Parente P, et al. Barrett’s esophagus and adenocarcinoma risk: the experience of the North-Eastern Italian Registry (EBRA). Ann Surg. 2012;256:788–794; discussion 794–5. [DOI] [PubMed] [Google Scholar]
- 35.Picardo SL, O’Brien MP, Feighery R, et al. A Barrett’s esophagus registry of over 1000 patients from a specialist center highlights greater risk of progression than population-based registries and high risk of low grade dysplasia. Dis Esophagus. 2015;28:121–126. [DOI] [PubMed] [Google Scholar]
- 36.Dulai GS, Shekelle PG, Jensen DM, et al. Dysplasia and risk of further neoplastic progression in a regional Veterans Administration Barrett’s cohort. Am J Gastroenterol. 2005;100:775–783. [DOI] [PubMed] [Google Scholar]
- 37.Wani S, Abrams J, Edmundowicz SA, et al. Endoscopic mucosal resection results in change of histologic diagnosis in Barrett’s esophagus patients with visible and flat neoplasia: a multicenter cohort study. Dig Dis Sci. 2013;58:1703–1709. [DOI] [PMC free article] [PubMed] [Google Scholar]
- 38.Wu J, Pan YM, Wang TT, Gao DJ, Hu B. Endotherapy versus surgery for early neoplasia in Barrett’s esophagus: a meta-analysis. Gastrointest Endosc. 2014;79:233–241.e2. [DOI] [PubMed] [Google Scholar]
- 39.Kaminski MF, Regula J, Kraszewska E, et al. Quality indicators for colonoscopy and the risk of interval cancer. N Engl J Med. 2010;362:1795–1803. [DOI] [PubMed] [Google Scholar]
- 40.Corley DA, Jensen CD, Marks AR, et al. Adenoma detection rate and risk of colorectal cancer and death. N Engl J Med. 2014;370:1298–1306. [DOI] [PMC free article] [PubMed] [Google Scholar]
- 41.Eluri S, Shaheen NJ. Measuring quality in Barrett’s Endoscopy. Clin Gastroenterol Hepatol. 2021;19:889–891. [DOI] [PubMed] [Google Scholar]
- 42.Steele D, Baig KKK, Peter S. Evolving screening and surveillance techniques for Barrett’s esophagus. World J Gastroenterol. 2019;25:2045–2057. [DOI] [PMC free article] [PubMed] [Google Scholar]
Associated Data
This section collects any data citations, data availability statements, or supplementary materials included in this article.
Supplementary Materials
Data Availability Statement
The data that support the findings of this study are openly available in PubMed.