Abstract
Falls during walking are a major contributor to accidental deaths and injuries that can result in debilitating hospitalization costs, lost productivity, and diminished quality of life. To reduce these losses, we must develop a more profound understanding of the characteristic responses to perturbations similar to those encountered in daily life. This study addresses this issue by building on our earlier studies that examined mechanical and visual perturbations in the same environment by applying the same continuous pseudo-random perturbations at multiple (3 mechanical, 5 visual) amplitudes. Walking variability during mechanical perturbations increased significantly with amplitude for all subjects and differences as measured by variabilities of step width, COM position, and COM velocity. These parameters were the only ones sensitive to the presence of visual perturbations, but none of them changed significantly with perturbation amplitude. Additionally, visual perturbation effects were far less consistent across participants, with several who were essentially unaffected by visual perturbations at any level. The homogeneity of the mechanical perturbation effects demonstrates that human responses to mechanical perturbations are similar because they are driven by kinetics that require similar corrections that must be made in order to maintain balance. Conversely, responses to visual perturbations are driven by the perceived need to make corrections and this perception is not accurate enough to produce amplitude-related corrections, even for a single participant, nor is this perception consistent across individuals. This latter finding is likely to be relevant to future visual perturbation studies and the diagnosis and rehabilitation of gait and balance disorders.
Keywords: Balance, Perturbation, Gait, Strategies, Movement
1. Introduction
Each year there are over 700,000 new non-fatal fall injuries, which will eventually lead to nearly $35 billion in hospitalization and lost productivity costs (CDC, 2011). The third-leading cause of these falls was a slip, trip, or stumble while walking (CDC, 2011). Therefore, a better understanding of walking balance is vital to reducing physical, emotional, and economic costs associated with these accidents. Because walking balance relies on proprioceptive and visual feedback, gait perturbations increase demand on these sensory systems in a way that may provide better insight into the maintenance of walking balance. However, each of these perturbation types affects balance in unique ways which have not been extensively studied in the same environment. Also, the scaling effects of perturbation amplitude on kinematic and temporospatial variability during gait have received little attention. The combination of limited knowledge and significant personal and financial burdens of fall-related injuries presents an urgent need to better understand these responses.
To enhance our understanding of falls caused by visual and mechanical perturbations, recent investigations have examined changes in gait patterns during applied perturbations. Sinusoidal support surface perturbations during walking in a static visual environment induced increased step width variability (Brady et al., 2009). Visual environments that included changes in scene complexity, tilt angle, and optical flow caused shorter and wider steps and greater step width and stride velocity variability (Hollman et al., 2006; Nyberg et al., 2006; Hollman et al., 2007; Lamontagne et al., 2007). Additionally, exposure to a virtual curved corridor during treadmill walking caused significant increases in weight acceptance and push-off forces along with increased step width, reduced stride length, and larger step width and stride velocity variabilities (Hollman et al., 2006, 2007). These effects were also found to be significantly greater when the perturbations were in the medio-lateral (M-L) direction (Warren et al., 1996; O’Connor and Kuo, 2009). These findings were confirmed as part of this study’s precursor, which included optic flow matched to treadmill walking speed during platform or visual perturbations in the M-L or anterior–posterior (A–P) directions (McAndrew et al., 2010). However, because that study used only one perturbation amplitude for each perturbation type, it was not possible to quantify amplitude sensitivity, which could provide information about scaling effects, individual responsiveness, and balance limits.
Currently, knowledge of amplitude effects on visually and mechanically perturbed gait at multiple amplitudes is limited. One study examined gait sensitivity to discrete perturbations at two amplitudes and found that M-L sternum displacements and corrective step widths increased for the higher amplitude perturbations (Oddsson et al., 2004). Additionally, two visual perturbation studies presented sinusoidal perturbations at multiple amplitudes and revealed a correlation between perturbation amplitude and kinematic and temporospatial responses (Warren et al., 1996; O’Connor and Kuo, 2009). However, both visual studies used pure sinusoidal perturbations that may have allowed for adaptation and entrainment of responses to these predictable perturbations.
Intuitively, perturbation effects might be expected to increase with perturbation amplitude, but these effects are not necessarily consistent or linear. Furthermore, the responses to mechanical perturbations are likely to be inherently different from those for visual perturbations. Better knowledge of amplitude effects could be useful for protocol development and provide insight into the characteristic responses produced by different stimuli. There may also be limited responses at amplitude extremes when perturbations are either so small that they have negligible influence or so large that gait is either completely disrupted (with a stumble or fall). For instance, mechanical perturbations induce an immediate involuntary displacement and subsequent corrective movements to maintain balance, walking speed, and direction. However, responses to visual perturbations are driven only by a perceived need to correct posture and walking direction. Should these unnecessary corrections actually increase walking variability, they will drive additional corrections as the body attempts to recover normal walking patterns. This fundamental difference suggests that the sensitivity to perturbation amplitude must be established separately for each perturbation type.
Our goal was to quantify the amplitude-driven temporospatial and kinematic changes in responses to pseudo-random, continuous visual and mechanical perturbations. We anticipated that participants would exhibit: (1) variabilities proportional to perturbation amplitude and (2) amplitude responsiveness specific to each perturbation type.
2. Methods
Eleven young healthy individuals with no gait deficiencies provided written informed consent, as approved by the Institutional Review Boards at Brooke Army Medical Center, Ft. Sam Houston, TX, and The University of Texas at Austin. Participants walked at normalized speeds (1.21 ± 0.03 m/s) in a Computer Assisted Rehabilitation ENvironment (CAREN) (Motek, Amsterdam, Netherlands).
The CAREN includes a 2 m × 3 m instrumented treadmill embedded in a 4 m diameter movable platform surrounded by a 7 m diameter dome with a virtual environment projected 300° around the participant, from 40° below to 60° above eye level. Participants completed a 6-min warm-up followed by two 3-min trials under each of nine test conditions: no perturbation (NP), 3 platform amplitudes (P1–P3), and five visual amplitudes (V1–V5). The order of condition presentation was randomized for each individual and rest breaks were provided every 4–5 trials or when requested. 55 reflective markers were tracked at 60 Hz using a 24-camera Vicon motion analysis system (Vicon, Oxford, UK). Marker positions were combined with digitized joint centers and then post-processed using Vicon Nexus and Visual 3D software (C-Motion Inc., Germantown, MD) to define a 13-segment model based on ISB standards (Wu and Swain, 2002; Collins et al., 2009). This customized model was then used to establish each individual’s kinematics, including the center of mass (COM) position and velocity. Heel strikes identified using a velocity-based detection algorithm (Zeni et al., 2008) were used to calculate step width (SW) and stride time (ST). All kinematic and temporospatial data processing was performed using Visual3D and MATLAB (The Mathworks, Natick, MA).
For mechanical perturbations, the platform translated pseudo-randomly in the M-L direction. Visual perturbations were generated by fixing the center of the path on the horizon while the near field scene translated medio-laterally. Before beginning data collection, participants were instructed to focus on the horizon directly in front of them. Throughout each trial, their head orientation was monitored visually to ensure they were looking forward and at the horizon, which was approximately at eye level. Instantaneous perturbation amplitudes A(t) were calculated using
| (1) |
where t was time (s) and Aw was an amplitude weighting factor (in meters). The four perturbation frequencies (f1–4) were 0.16, 0.21, 0.24, and 0.49 Hz. Platform perturbations were produced at three levels (P1–P3) using Aw=0.03, 0.04, and 0.05 m. Visual perturbations were performed at five levels (V1–V5) using Aw=0.30–0.50 m, in 0.05 m increments. More visual perturbation amplitudes were used because their effects were expected to be less predictable and more variable across participants. These perturbation frequencies and the maximum Aw for each perturbation type were the same ones used previously (McAndrew et al., 2010, 2011).
For platform perturbations, the base of support (BOS) moved with the platform, requiring the CNS to control balance based on the COM position and velocity relative to the BOS. Therefore, the platform position was subtracted from all kinematic positions so that movements were quantified in the platform frame of reference. This adjustment allowed for consistency between measurements of platform perturbation responses and those recorded during unperturbed and visually perturbed trials, when the platform was stationary.
Temporospatial effects were quantified using the mean and standard deviation of stride time (STmn and STsd) and step width (SWmn and SWsd), which were found for the first 150 strides of each trial. To quantify kinematic variability, we calculated the mean standard deviation of the COM position and velocity (MeanSDpos and MeanSDvel) over the same 150 strides as
| (2) |
| (3) |
where Δxij is the deviation from the mean position for stride j of interval i (Dingwell and Marin, 2006). SDj and MeanSD quantities were calculated over Nint (101) 1% intervals for Nstr (150) strides. Although similar to the root-mean-square (RMS) stride deviation, the MeanSD quantifies the mean of standard deviations at each 1% interval of the stride cycle across strides, as opposed to the mean RMS deviation, which averages the deviations within each stride (O’Connor and Kuo, 2009).
Two-way (amplitude x trial) repeated measures ANOVAs were conducted using SPSS 18 (SPSS Inc., Chicago, IL) to test for differences (α=0.05) for each kinematic and temporospatial gait parameter. Post-hoc estimated marginal means analyses with Sidak corrections for multiple comparisons were performed to isolate differences between perturbation amplitudes and between trials 1 and 2. Separate analyses were performed for comparisons of platform and visual perturbation effects (using the same NP trials as a baseline condition) due to differences in the number of perturbation amplitudes (3 versus 5) and response characteristics for each perturbation type.
3. Results
3.1. Platform perturbations
Mechanically perturbed trials (P1–P3) produced significantly larger mean step widths (p<0.001) but post-hoc analyses showed that SWmn did not change with amplitude increases beyond P1 (Fig. 1A). Conversely, step width variability (SWsd) increased with each increase in amplitude (p<0.006; Fig. 1C). The between-trial difference (Trial 1 vs. Trial 2) in SWmn was just beyond significance (p=0.051), but this difference was only 1 mm for mean step width of 12.7 cm. Like the group means, individual SWmn values were generally higher for the perturbed trials (Fig. 1B), but did not consistently increase with amplitude. Individual SWsd values followed the group trend (with one exception), monotonically increasing with each amplitude increase (Fig. 1D).
Fig. 1.
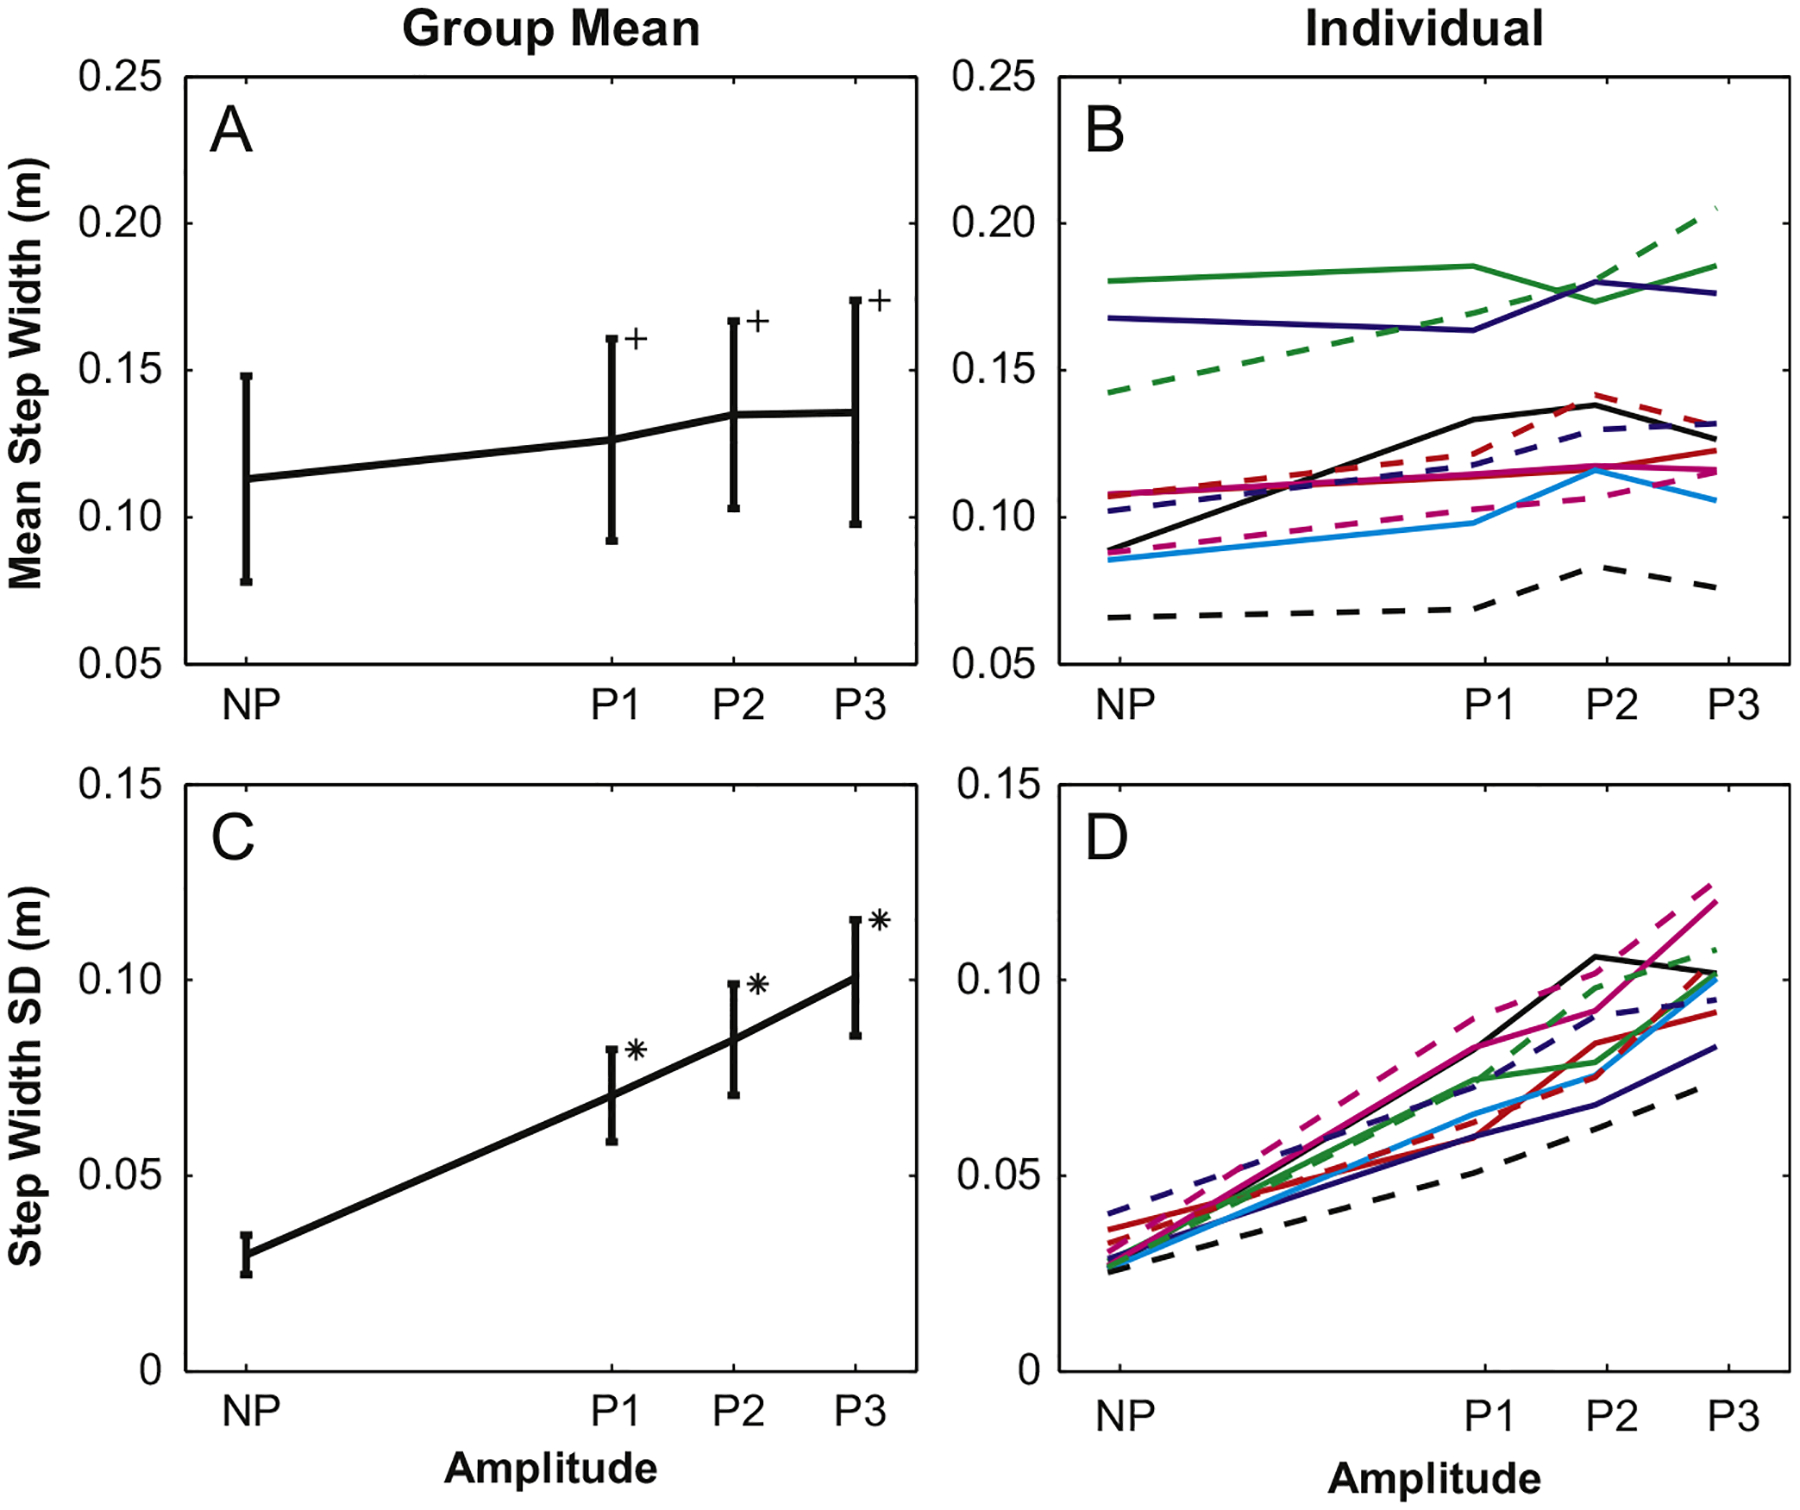
Group mean step width values for platform perturbations were significantly larger for perturbed trials versus those for the NP condition, but were not different for each increase in amplitude. Step width variability also increased, but increased significantly with each increase in perturbation amplitude. Individual results generally reflect these trends. For this figure and those that follow, (+) indicates differences between perturbed trials and the NP condition; (*) indicates differences between that amplitude and the next lower amplitude.
Mean stride times (STmn) were shorter and stride time variability (STsd) increased with perturbation amplitude (p<0.001 for both), but the only significant post-hoc differences were between NP and perturbed trials (Fig. 2A and C). Between-trial differences were significant for both STmn and STsd (p<0.003). However, STmn was only 4.0 ms shorter and STsd was just 3.0 ms larger for Trial 1 versus Trial 2, both less than 0.4% of the mean stride time (1.06 s). Additionally, post-hoc between-trial differences were inconsistent for each amplitude, significant only for P2 and P3 for STmn (p<0.012) and P1 and P3 for STsd (p<0.034). There were a number of instances for both stride time parameters where individual trends for STmn and STsd did not always follow the monotonic increases seen in group trends (Fig. 2B and D).
Fig. 2.
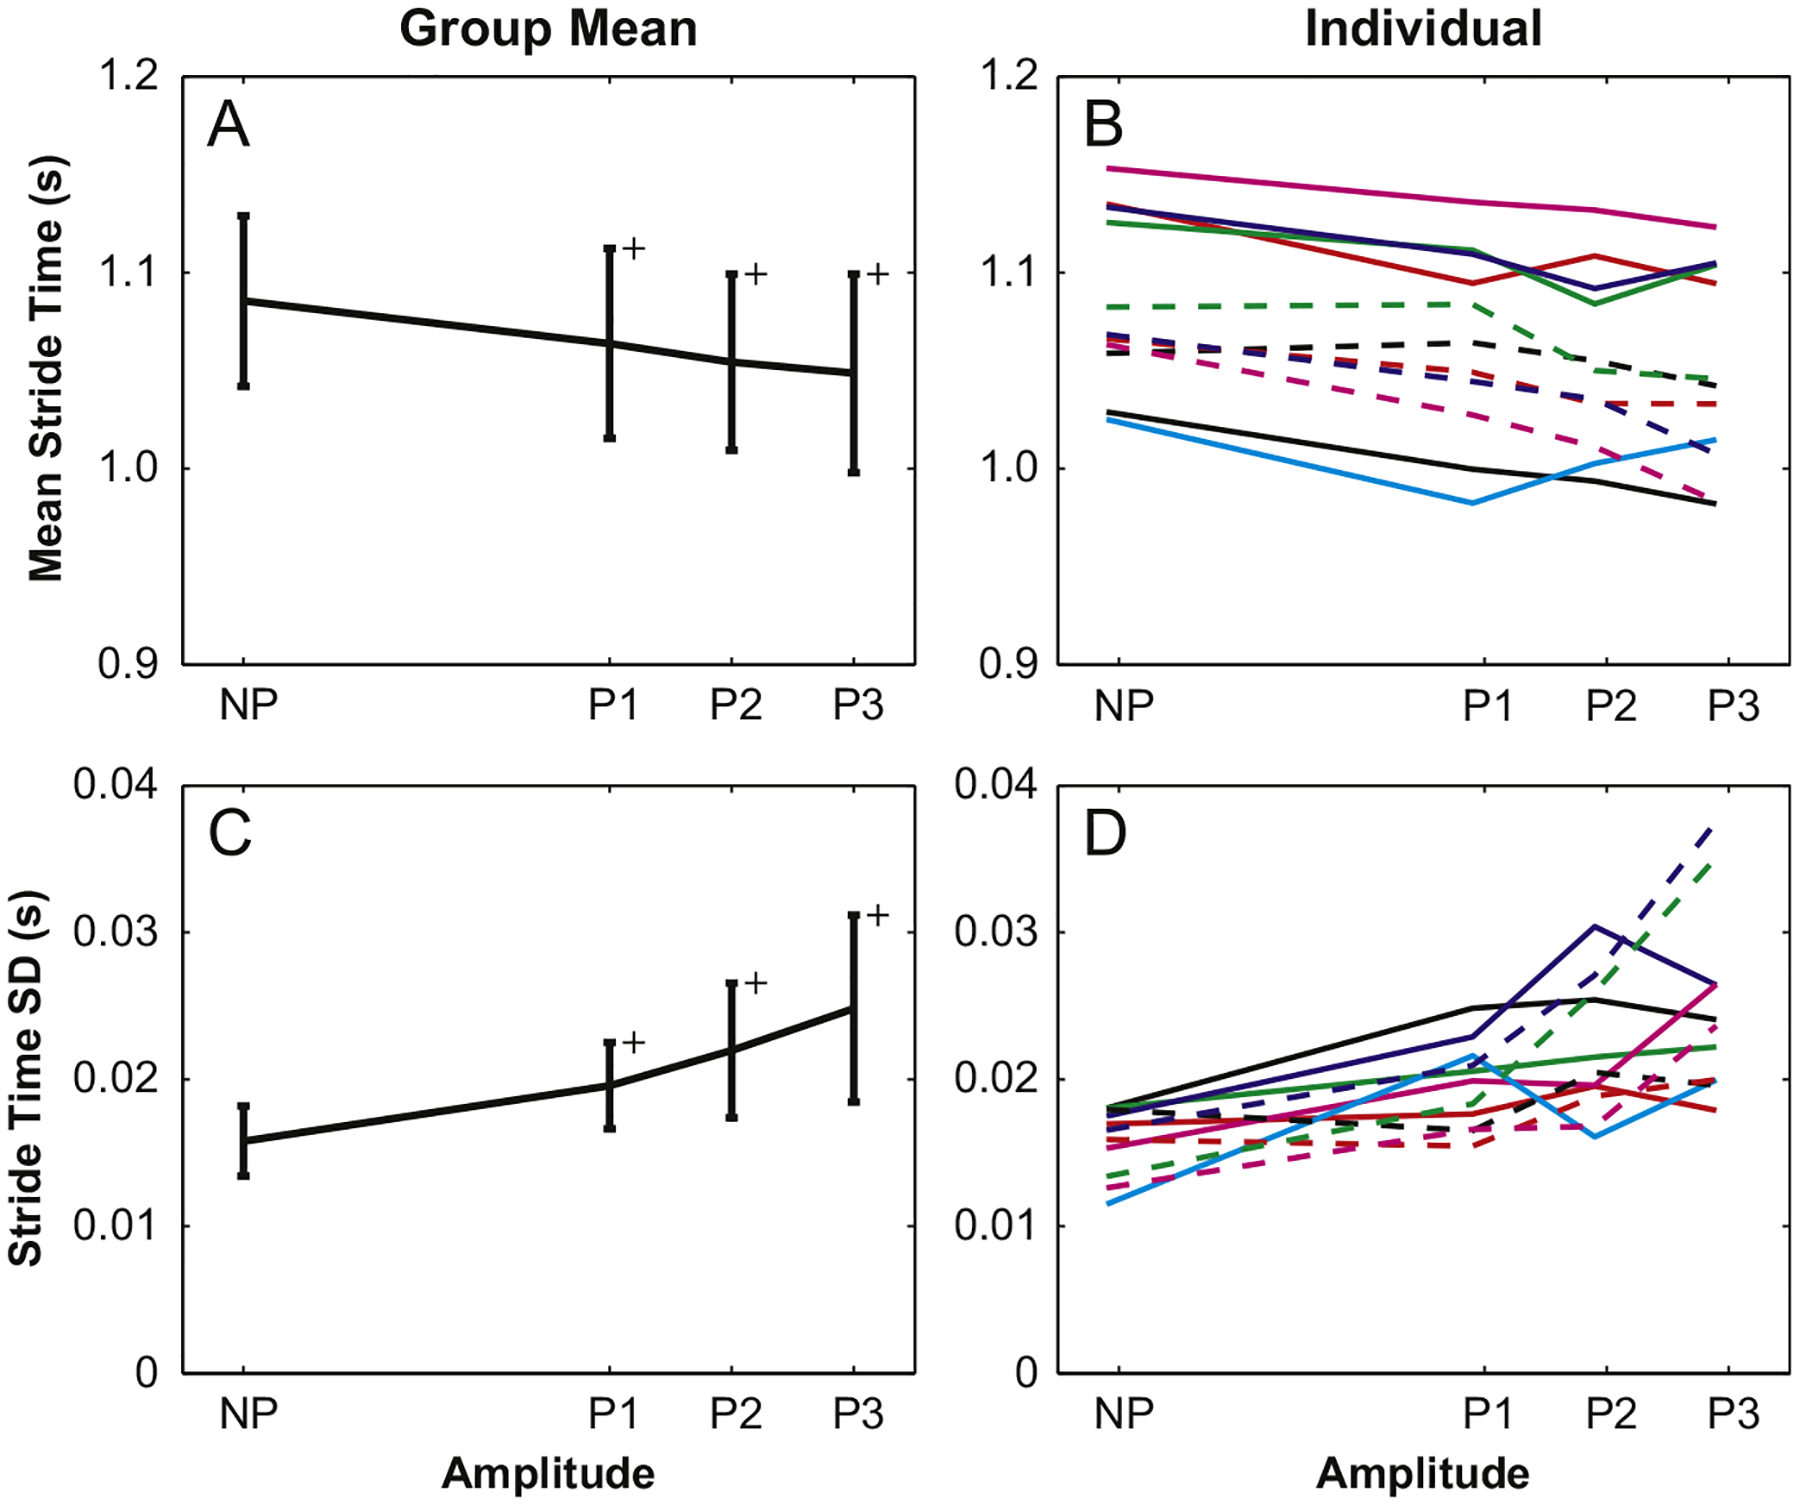
Group mean stride time decreased and stride time variability increased significantly for perturbed trials versus the NP condition, but are not different for each increase in perturbation amplitude. Individual trends were similar; however, several subjects had notable increases in stride time variability for higher amplitudes.
COM position and velocity variability (MeanSDpos and MeanSDvel) both increased with each increase in platform perturbation amplitude (Fig. 3A and C) from the NP condition through P3 (p<0.001 for both parameters). Post-hoc analyses showed that the differences in MeanSDvel between each perturbation amplitude were highly significant for each step increase in perturbation amplitudes (p<0.002). However, the statistical differences in MeanSDpos for increases from P1 to P2 (p=0.036) and P2 to P3 (p=0.025) were not as strong. Additionally, the main effect difference between MeanSDpos values for the first and second trials approached significance (p=0.051). However, post-hoc analyses revealed no between-trial differences at any amplitude. Like SWsd, individual trends for MeanSDpos and MeanSDvel generally followed the group trends, with a few exceptions for MeanSDpos (Fig. 3B and D).
Fig. 3.
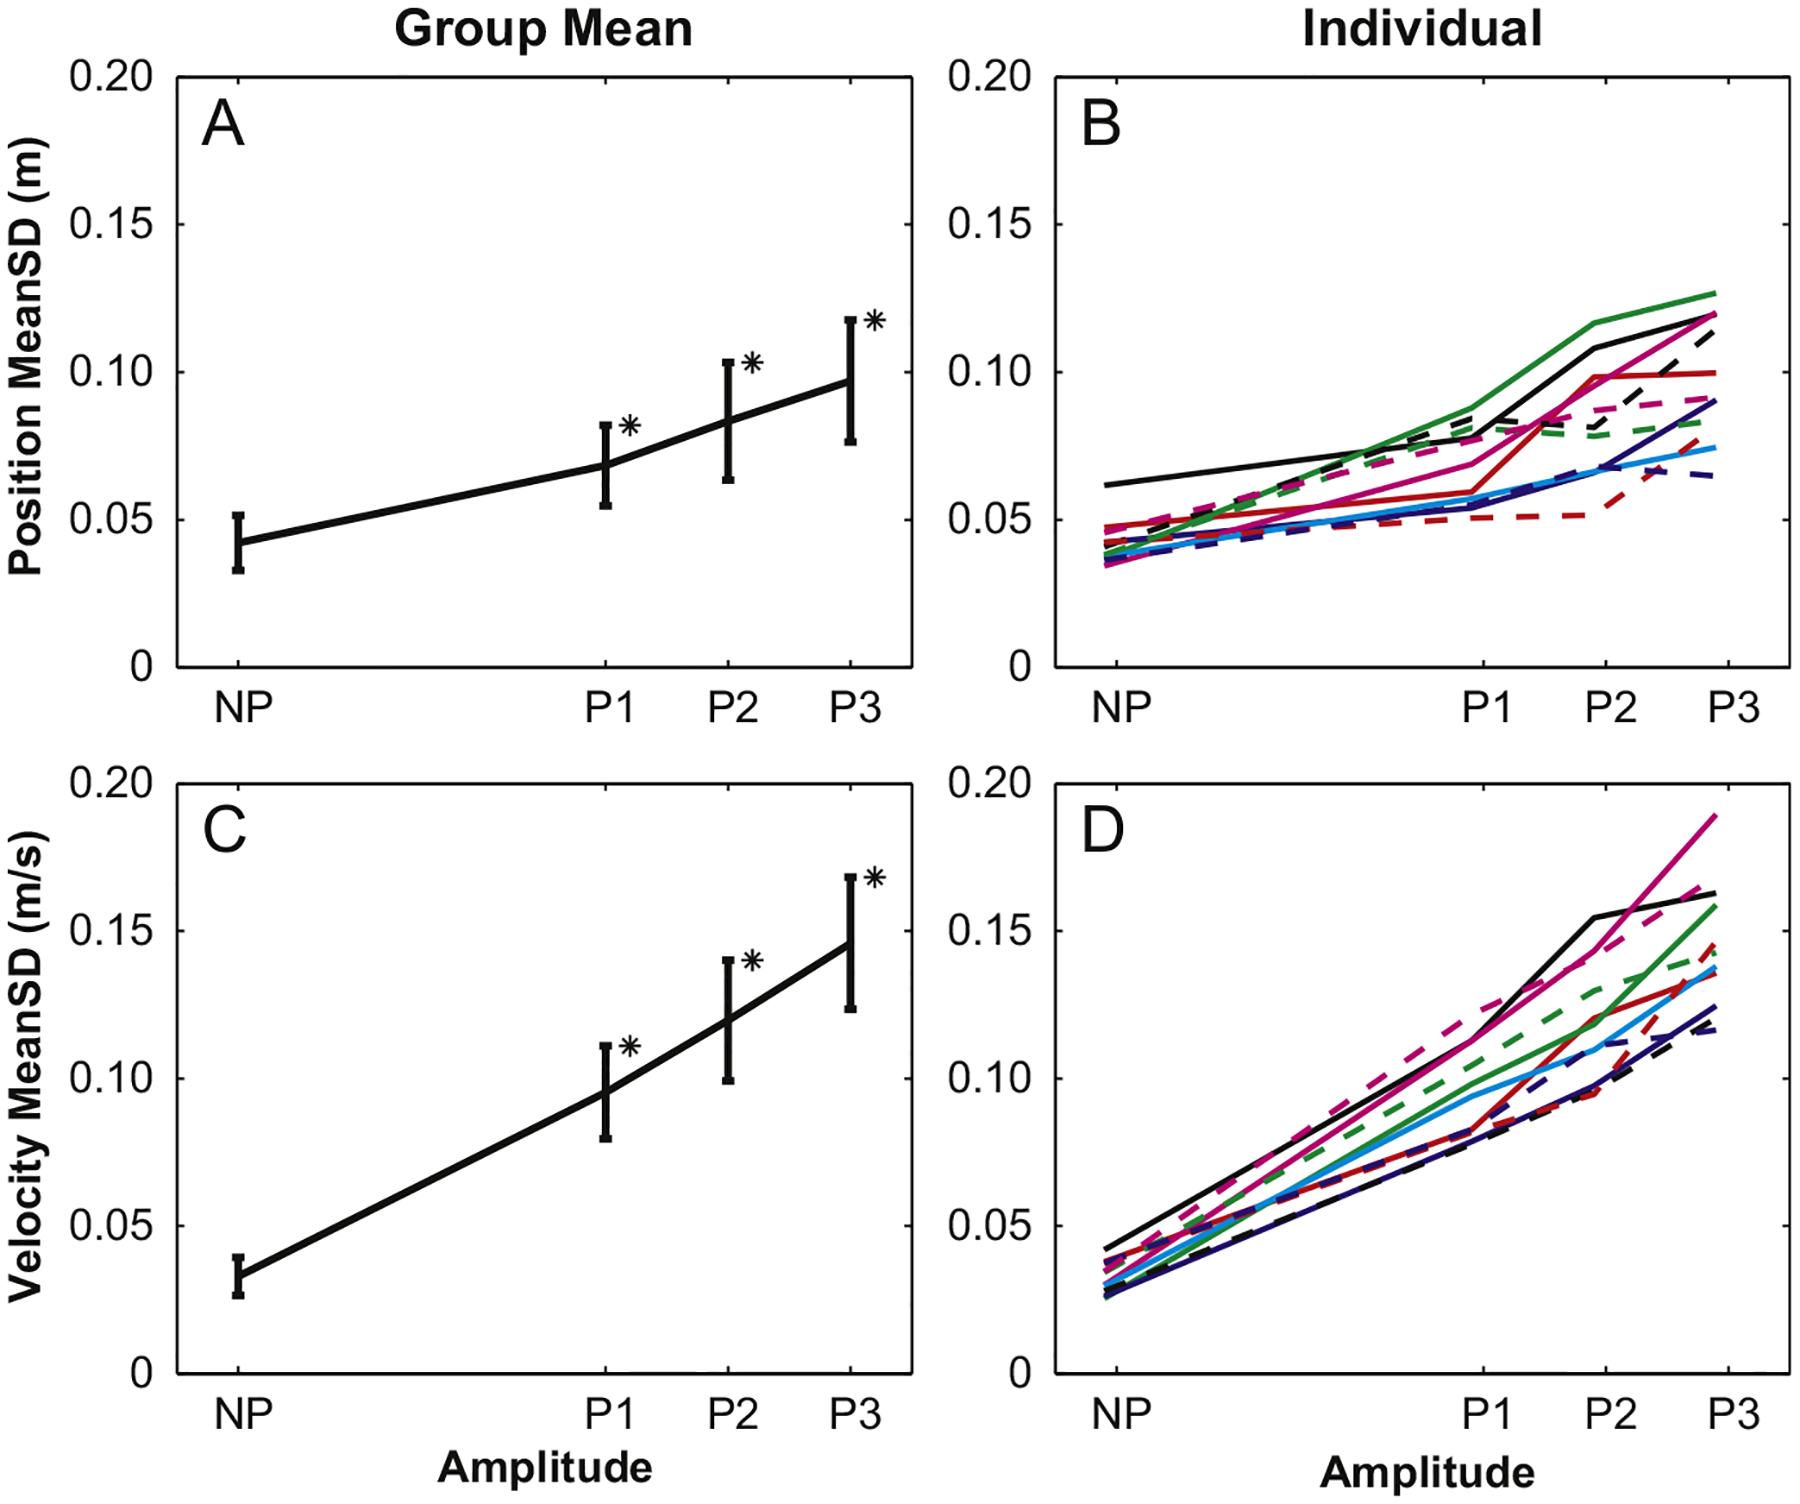
Group MeanSD values for platform perturbations were significantly larger for each increase in amplitude for both position and velocity. Individual results also reflect these trends.
3.2. Visual perturbations
Compared to platform perturbation results, all gait parameters were less sensitive to visual perturbation amplitudes (V1–V5) and several were not sensitive to visual perturbations at all. Both SWmn and SWsd had significant main amplitude effects (p=0.006 and p=0.003, respectively), but only SWsd revealed differences between each perturbation amplitude and the NP condition (Fig. 4A and C), except for the highest amplitude (V5). SWsd was larger for V4 than it was for V2 (p=0.025), but this was the only difference for visually perturbed trials. Individual responses (Fig. 4B and D) reveal that not only did SWmn and SWsd change erratically with amplitude, but also several participants exhibited little to no response to visual perturbations at any amplitude.
Fig. 4.
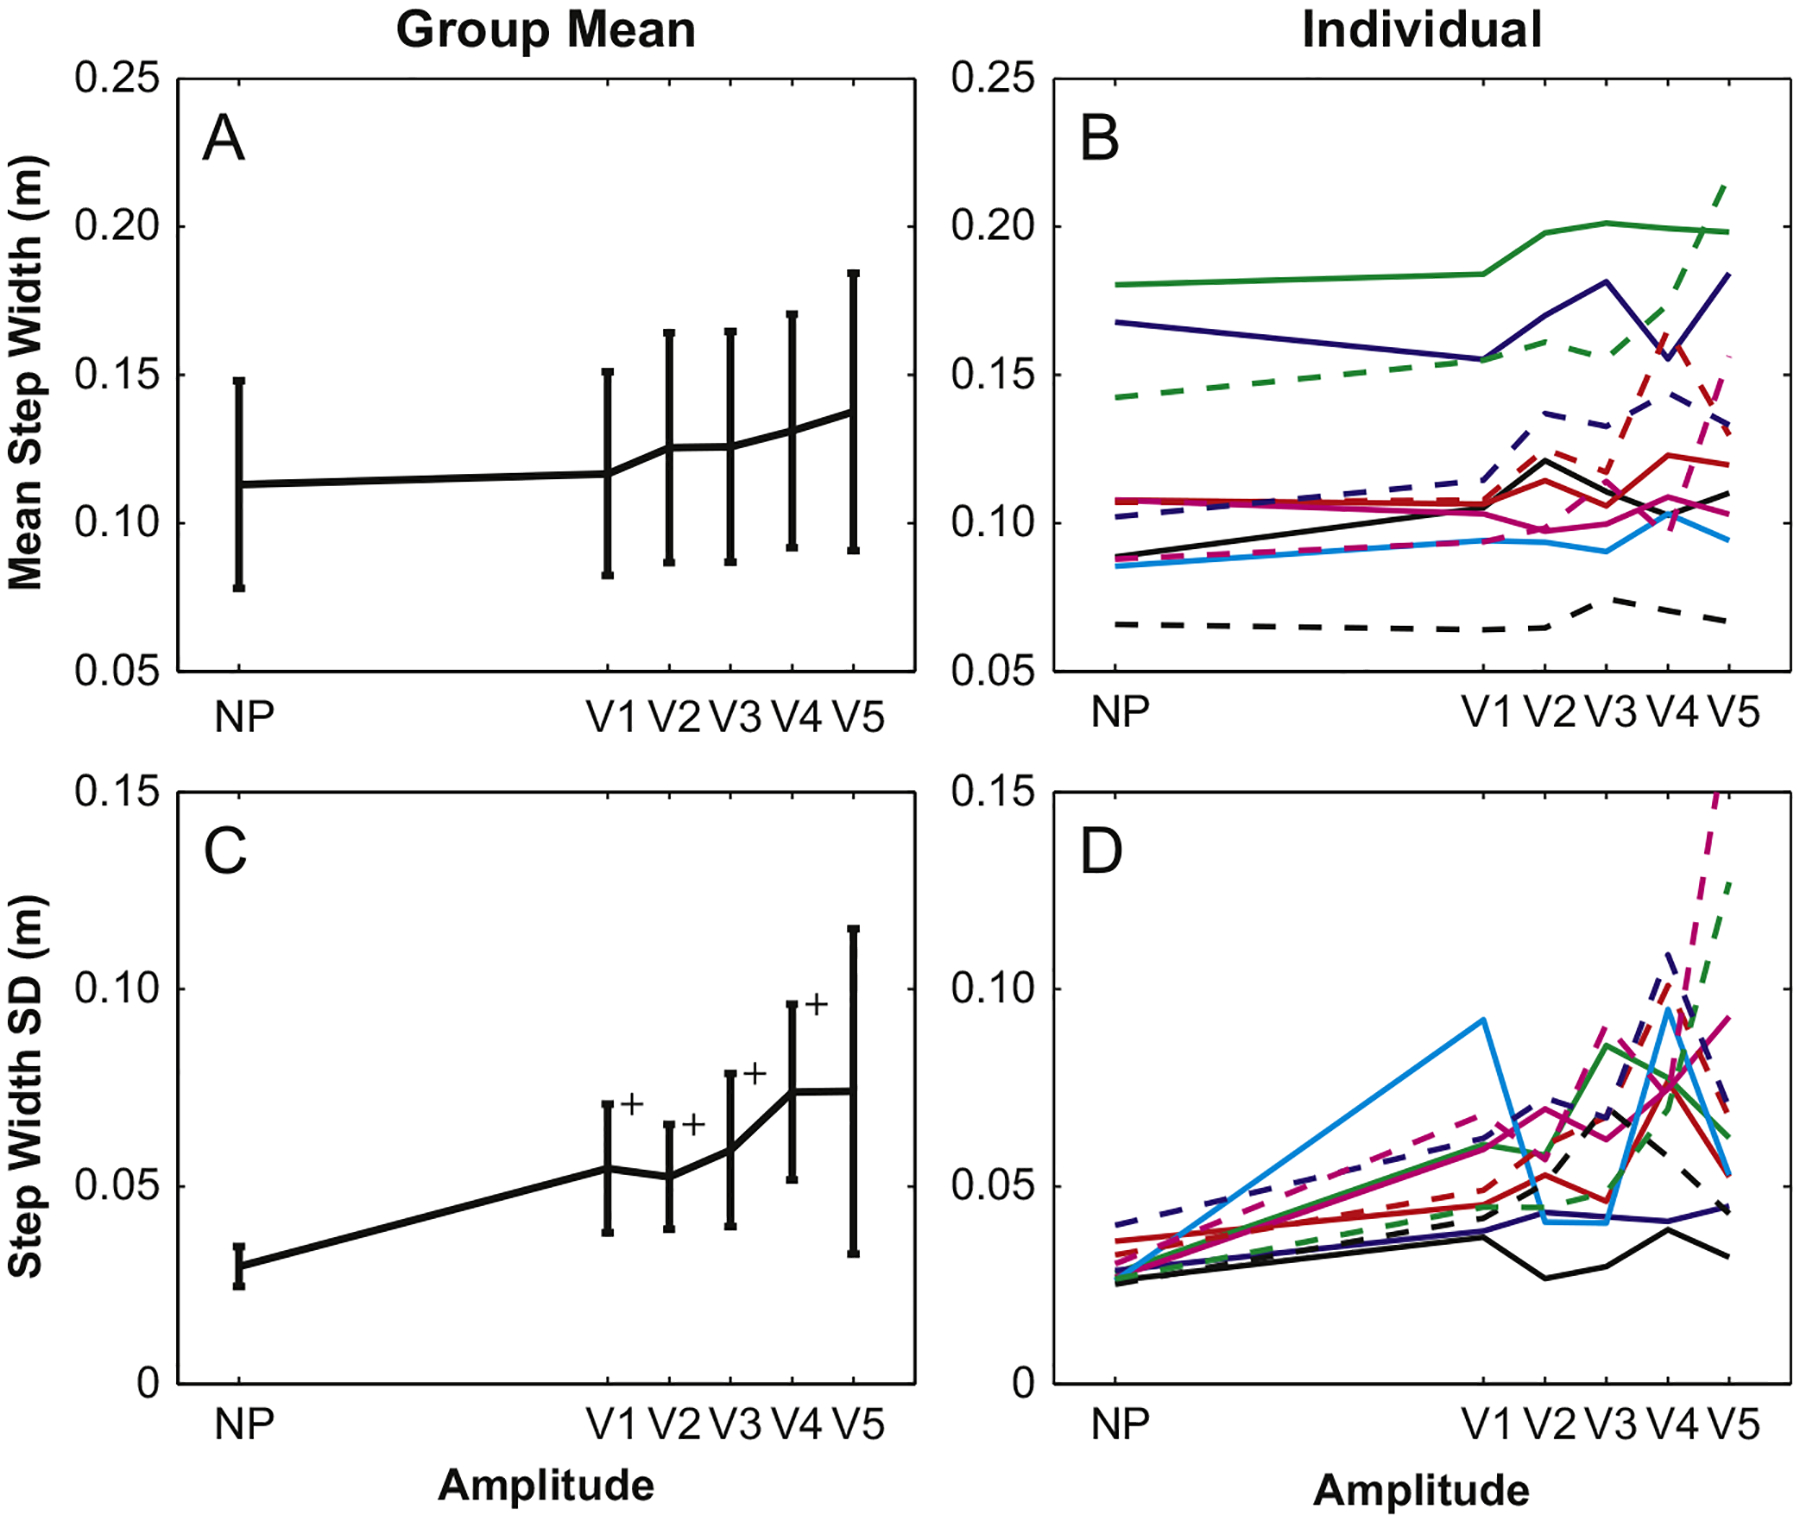
Group mean step width values for visual perturbations were not significantly different from that for the NP condition. However, step width variability was significantly larger for amplitudes V1–V4 as compared to the NP condition. Large variabilities in group means are caused by individual variability across all five perturbation amplitudes.
The main amplitude effect on mean stride time (STmn) was significant (p=0.028); however, the only post-hoc differences were between the NP condition and amplitudes V2 and V4 (Fig. 5A). Stride time variability (STsd) had a nearly significant (p=0.054) main amplitude effect, but none of the post-hoc differences approached significance (Fig. 5C). Individual trends for stride time measures, like those for step width, were highly erratic with several participants exhibiting little responsiveness to visual perturbation (Fig. 5B and D).
Fig. 5.
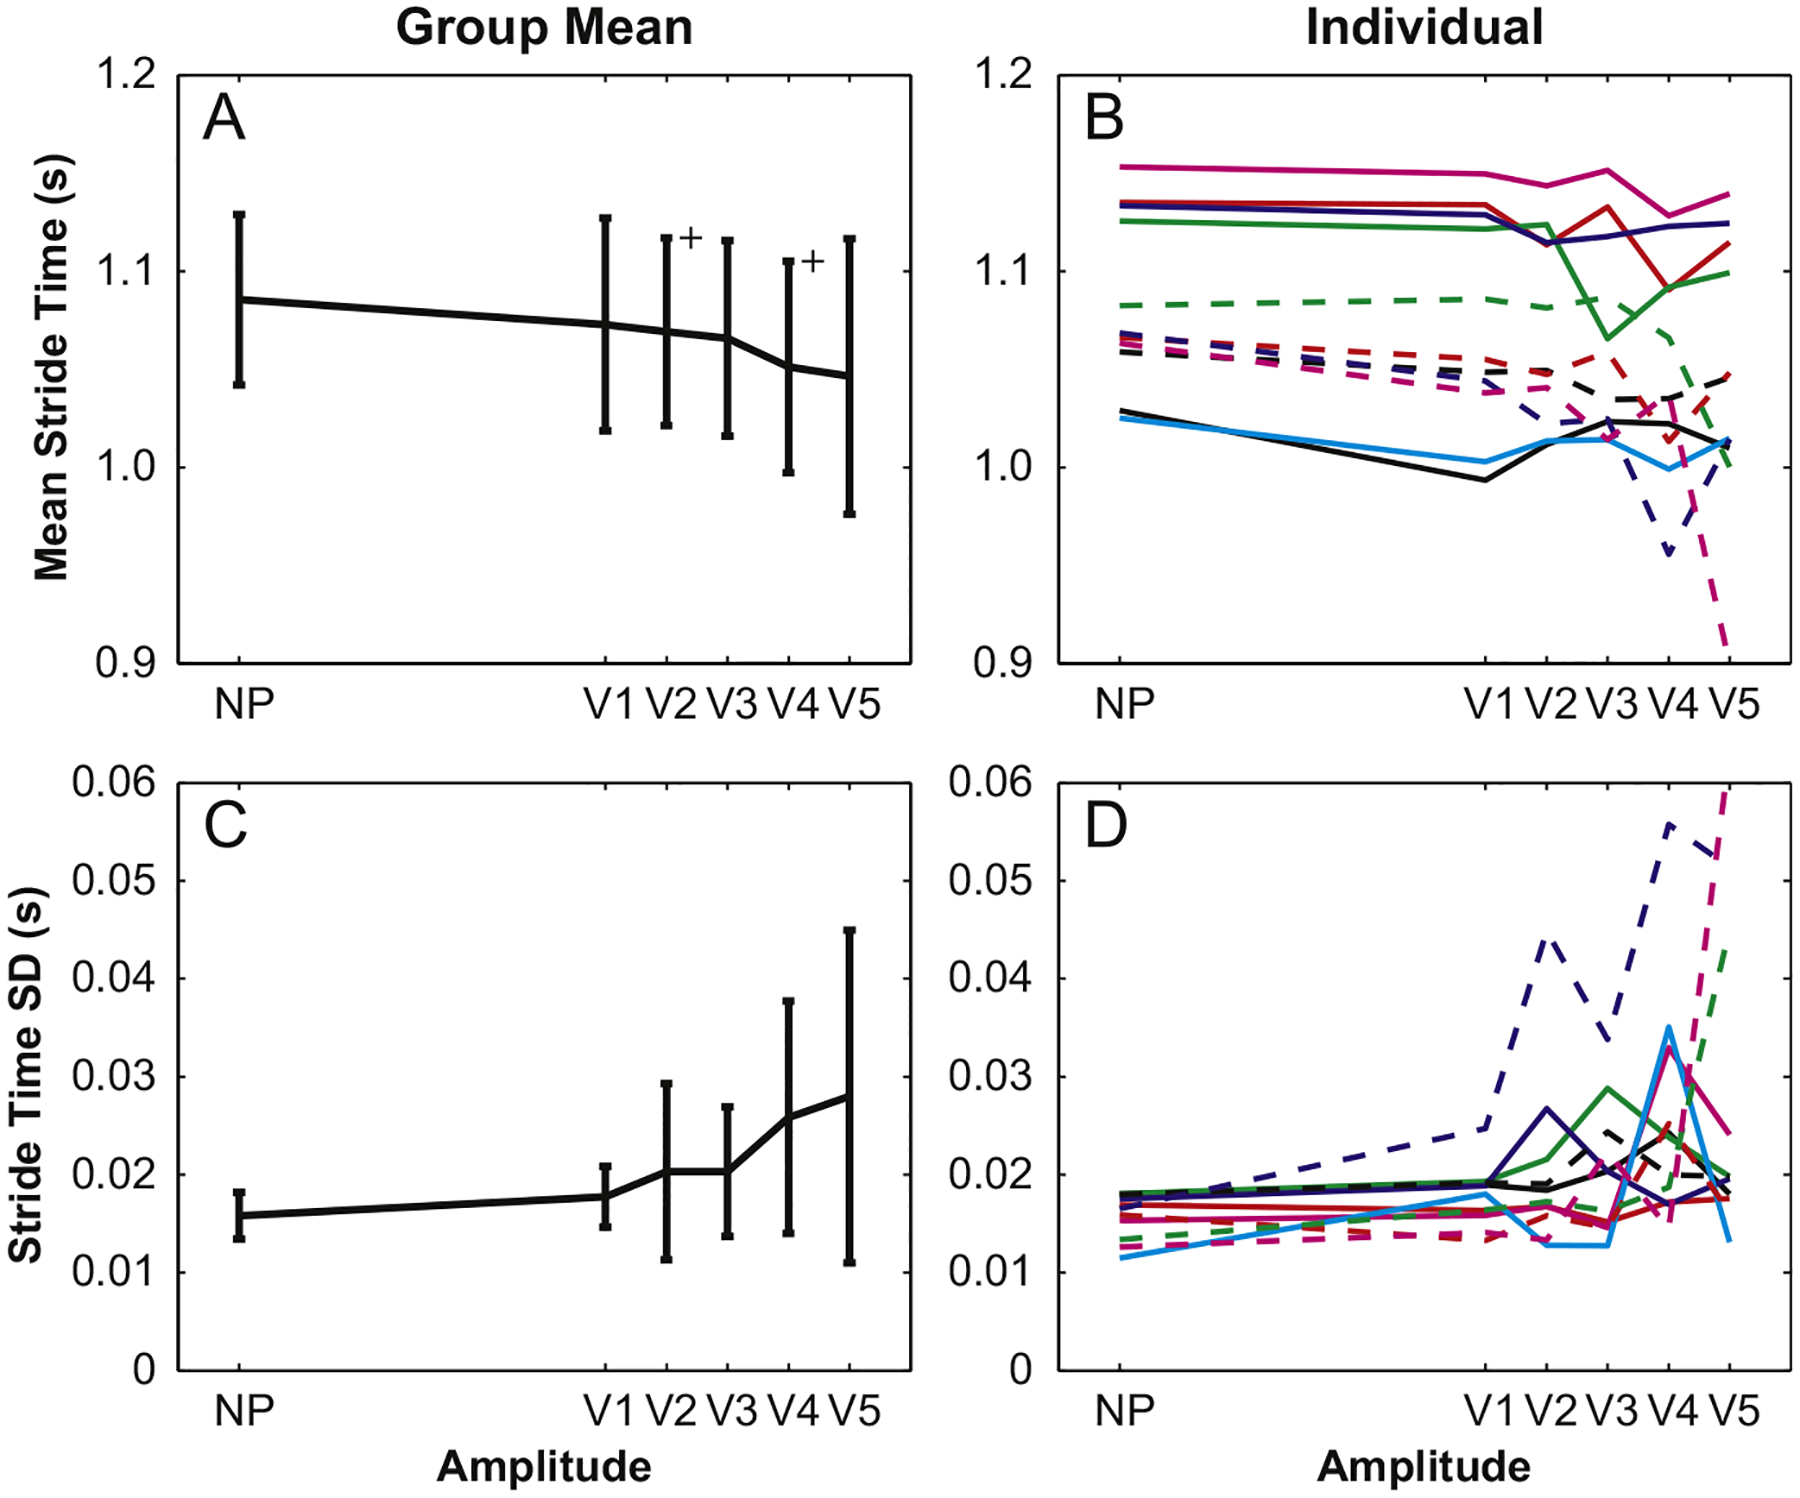
In general, mean stride time and stride time variabilities were not significantly different across visual perturbation amplitudes. Mean stride times for V2 and V4 amplitudes were significantly shorter than those for NP trials, but this difference is less than 0.05 s.
Kinematic measures of stride-to-stride position and velocity variability (MeanSDpos and MeanSDvel) were both significantly smaller for NP trials as compared to all five amplitudes (p<0.004), but there were no differences between perturbed conditions (Fig. 6A and C). The single exception was the V5 MeanSDvel, which was not significantly larger than that for the NP condition, due to its large variability across subjects. Once again, individual trends in both the position and velocity MeanSD show that values were larger for perturbed gait, but did not show the systematic changes with perturbation amplitude as seen for platform perturbations.
Fig. 6.
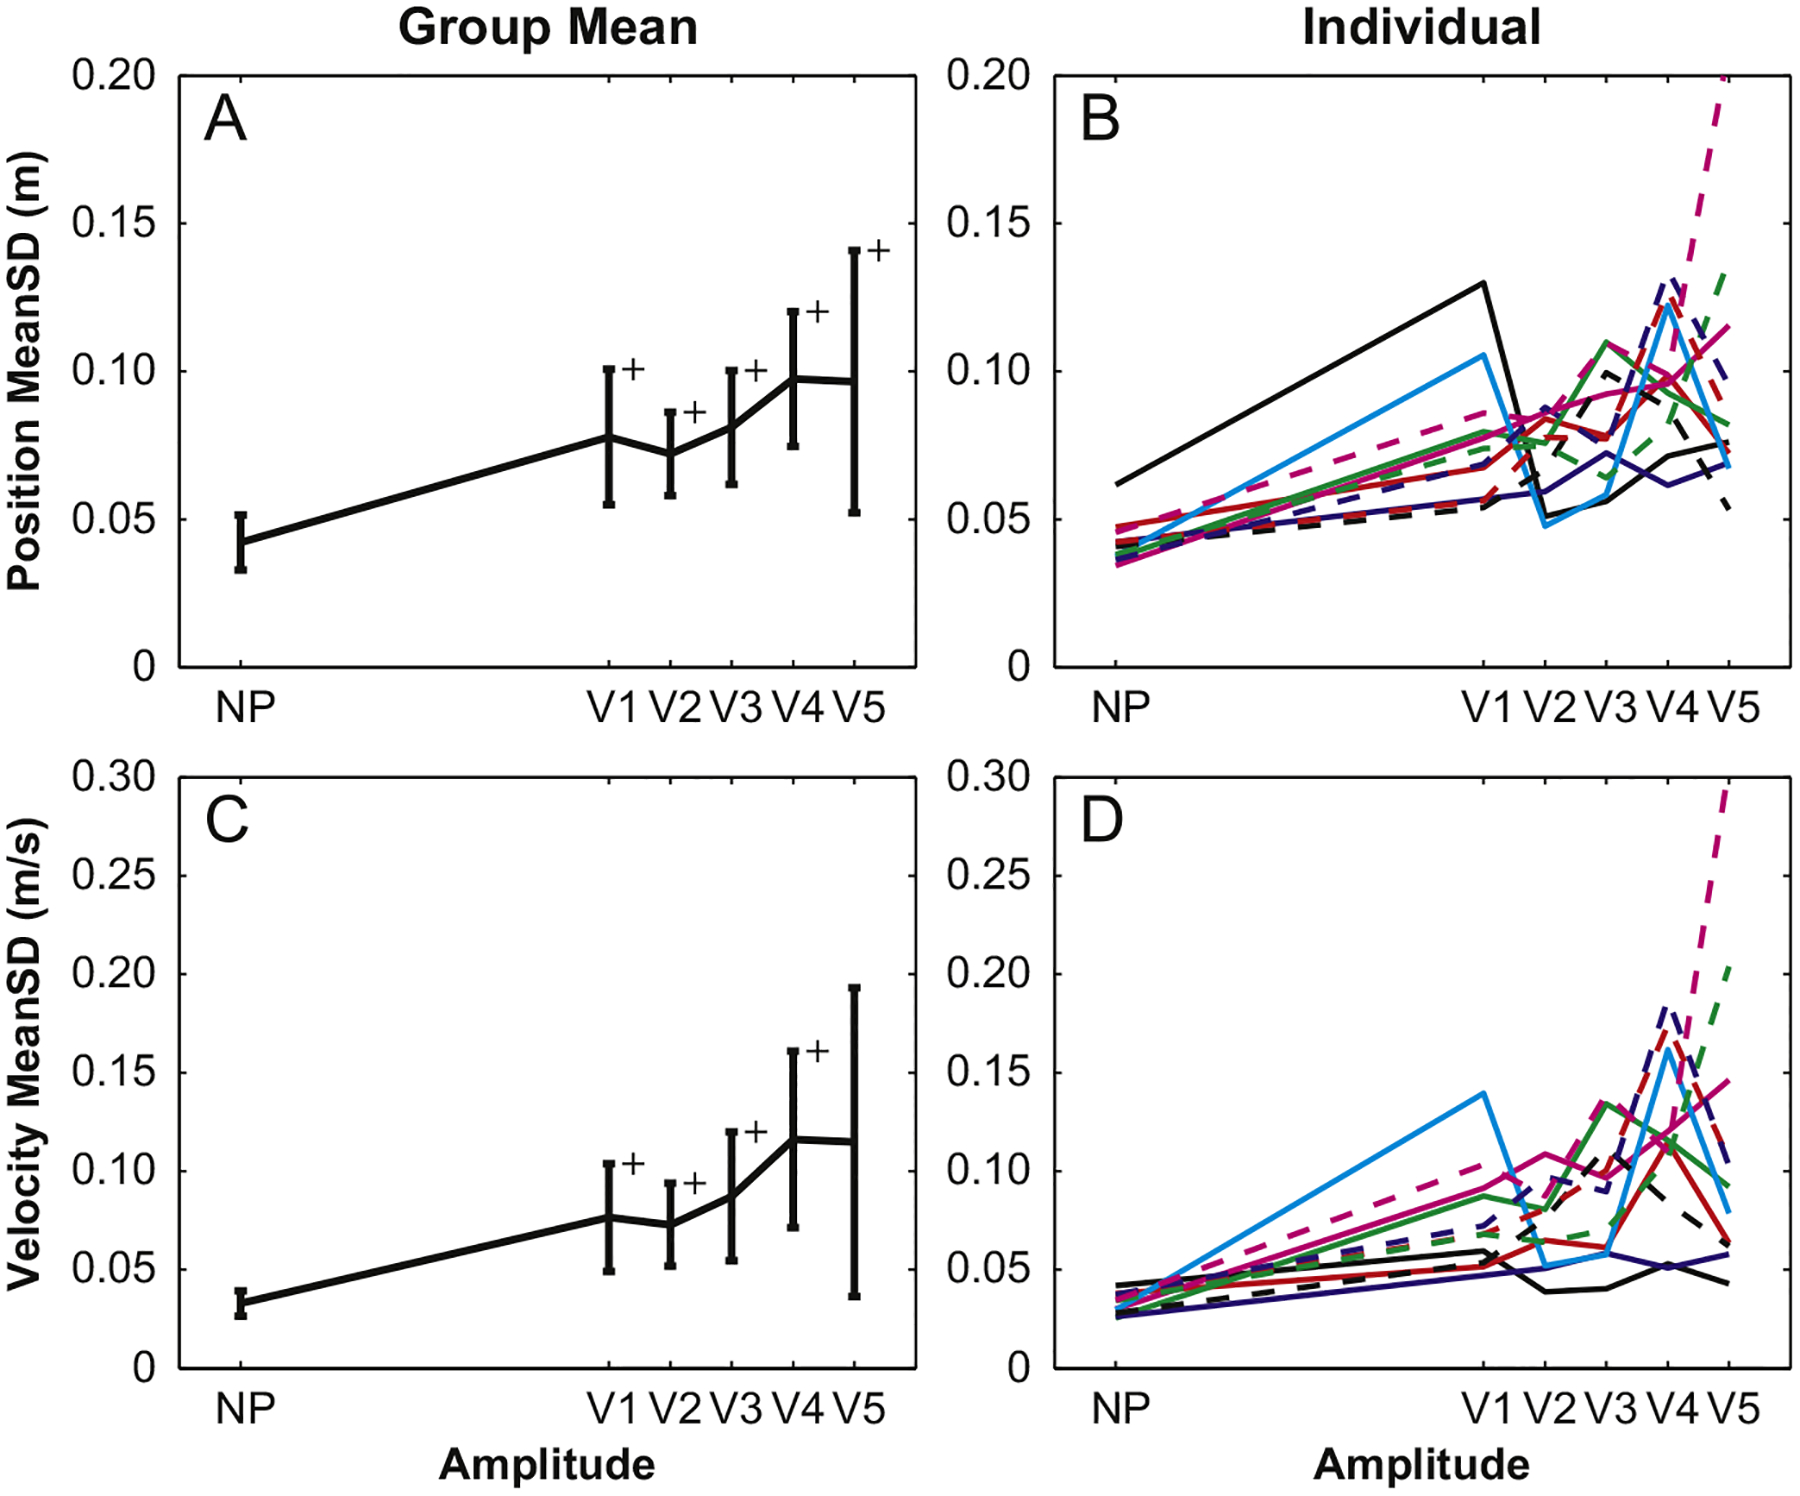
All visually perturbed position and velocity MeanSD values were larger than those for the NP condition, but were not significantly different from each other. These were the only parameters that detected the presence of visual perturbations for all five perturbation amplitudes.
MeanSD parameters were calculated to reflect the overall variability of a gait cycle. However, it is also important to understand how this variability changes with respect to stride cycle progression. For platform perturbations, COM displacement and velocity confidence intervals progressively increased with amplitude throughout the stride cycle (Fig. 7A and C), reflecting the systematic increases seen for the MeanSD parameters. Conversely, there was little difference between these CIs for the five visual perturbation amplitudes (Fig. 7B and D), although there was a slight separation near 5% and 55% of the gait cycle.
Fig. 7.
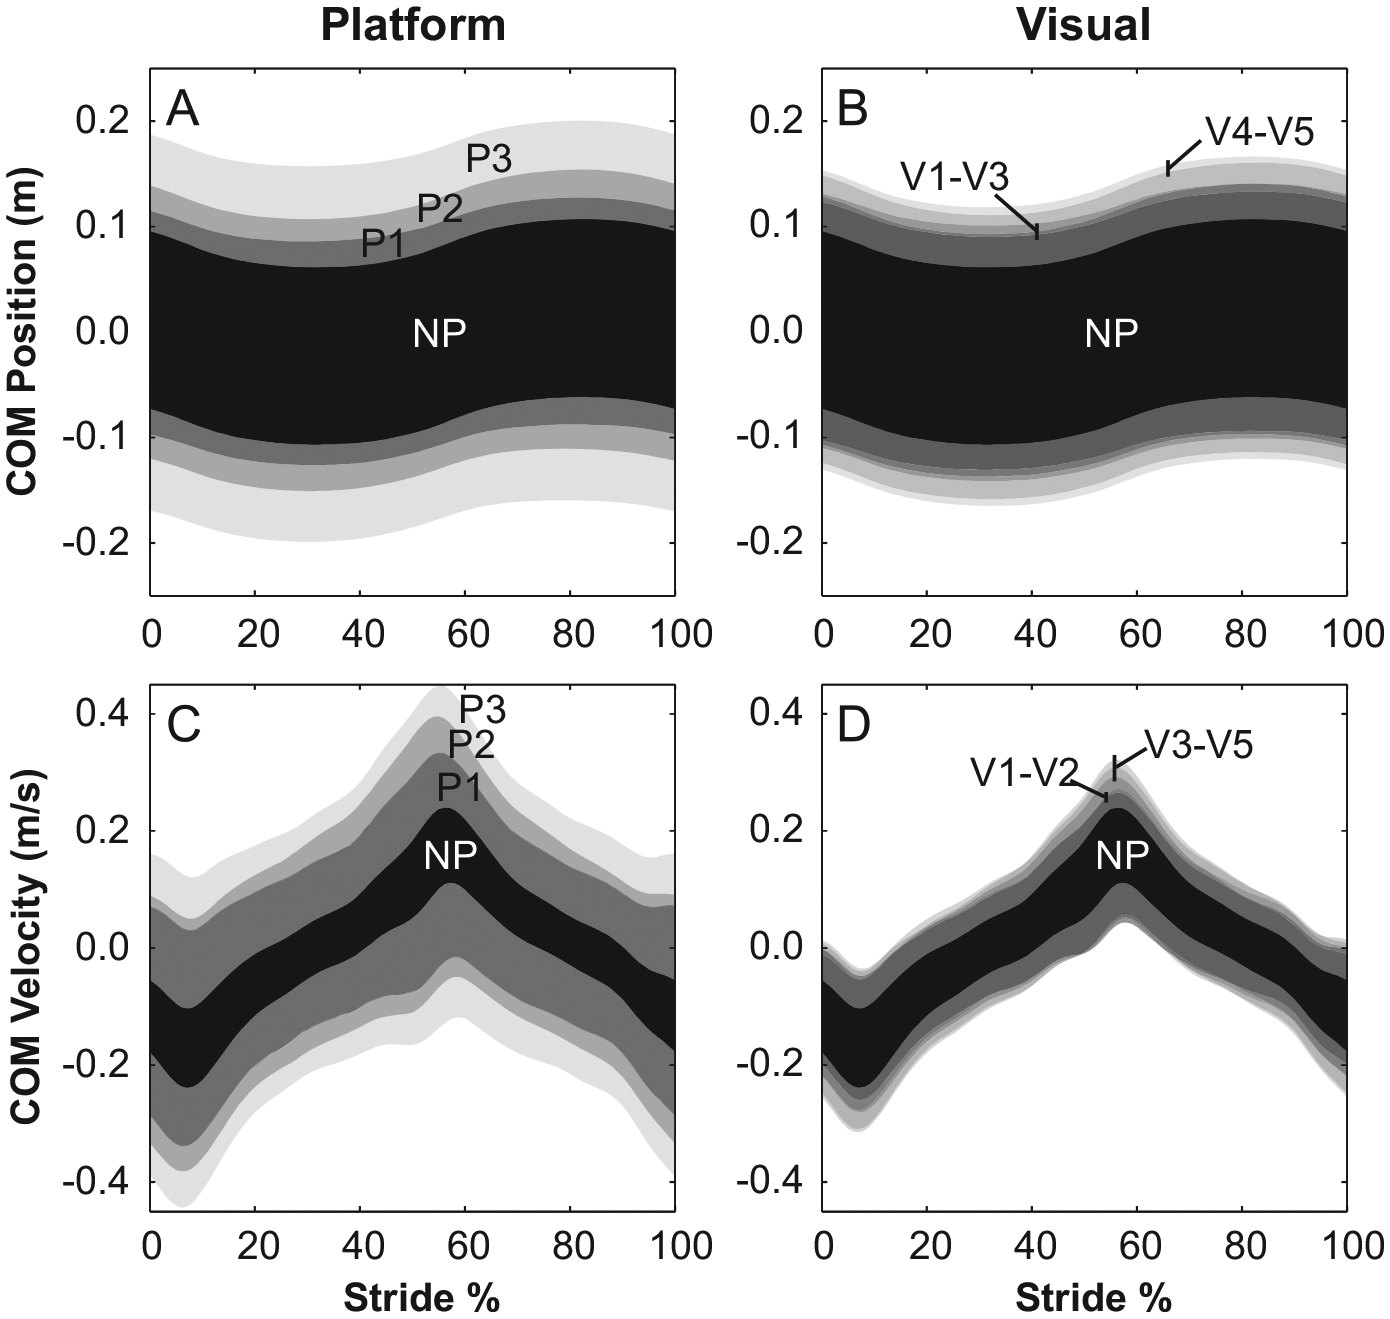
Group COM position and velocity confidence intervals with respect to stride progression show systematic increases driven by platform perturbation amplitude (P1–P3) throughout the stride cycle. Conversely, visual perturbations produce amplitude-driven differences only at ~5% and ~55% of the stride cycle, just before toe-off on each side. Additionally, these differences are smaller than those for platform perturbations. For this figure, stride cycles begin at right heel strike.
4. Discussion
This study was the first to establish the amplitude effects of visually and mechanically perturbed gait in the same environment. In doing so, we demonstrated that responses to mechanical perturbations differ from responses to visual perturbations in overall sensitivity to perturbation amplitude and consistency across individuals. There was little adaptation within each condition, as indicated by non-significant or negligible between-trial differences. Of six gait parameters, only measures of stride-to-stride position and velocity variability (MeanSDpos, MeanSDvel) and step width variability (SWsd) were effective in detecting the presence of both mechanical and visual perturbations; however, they were generally insensitive to differences in visual perturbation amplitude. The remaining parameters (SWmn, STmn, and STsd) were mostly insensitive to the presence of visual perturbation, even at the largest amplitude (Fig. 4B, Fig. 5B and D).
Although mean visual responses tended to increase with perturbation amplitude, the variability of these responses increased in parallel, most likely precluding the finding of significant differences between responses at different perturbation amplitudes. Because the visual and platform responses were of the same order of magnitude, larger visual perturbation variabilities are the most likely reason these parameters were either insensitive to amplitude differences or, in some cases, insensitive to the presence of visual perturbations altogether. The proportionally smaller increments for the five visual perturbation amplitudes could have been a factor in detecting response differences. However, supplemental statistical tests using only NP, V1, V3, and V5 amplitudes yielded only a few novel differences between NP and V3 mean step width (p=0.028) and between NP and V1 mean stride time (p=0.040). Notably, there were still no significant differences in dependent measures between any two visual perturbation amplitudes and SWsd was still the only measure that was different between NP and visually perturbed conditions.
An earlier visual perturbation study (O’Connor and Kuo, 2009) showed progressively larger increases in gait variability in response to increased amplitudes, but those amplitudes were smaller than those used for this study. Therefore, there may be an amplitude ‘ceiling effect’ that limits responses above a threshold amplitude. Visual perturbation effects were also largely individual, as indicated by the large visual response variabilities. Notably, several participants were largely insensitive to visual perturbations, as indicated by kinematic and temporospatial parameters that remained at the same relatively low amplitudes, regardless of perturbation amplitude. It is these differences in individual responsiveness that cause the large overall response variability and most likely reduce parameter sensitivity to differences in visual perturbation amplitude.
In comparing the responses to mechanical and visual perturbations, one must keep in mind the nature of these responses. Responses to mechanical perturbations are driven by inertial effects that will change the body’s position relative to the support surface. If this change brings the COM near or beyond the boundaries of the base of support, it will cause a corrective response that results in additional work needed to maintain balance and recover natural gait patterns (Eng et al., 1997). In contrast, visual perturbations do not impose physical perturbations directly on the body, but instead create the illusion that a correction is needed. This difference in actual versus perceived needs for corrective actions is most likely why there are such consistent individual responses to platform perturbations, whereas responses to visual perturbations are highly idiosyncratic. It also explains, at least to some degree, the tendency for some to respond to visual stimuli while others do not, a phenomenon reported in at least one other study of visually perturbed gait (Warren et al., 1996).
Awareness of the different responses is important for designing studies of perturbed gait because the intended effects of perturbation type and amplitude will directly affect the study’s outcomes. For instance, if the intent of the study is to investigate falling, platform perturbation amplitudes can be driven increasingly higher with correspondingly greater responses (until a stumble or fall occurs). However, responses to visual perturbations are much more individual and will likely vary from sizeable to negligible, precluding the simple scaling protocol that is possible with platform perturbations. Additionally, the difference in visual responses may be instrumental in determining the degree of fall risk based on an individual’s dependency on visual feedback. The difference between a visual ‘responder’ and a ‘non-responder’ may also provide insight into visual processing, depending on whether responsiveness is driven by the level of visual dependence or the ability to disregard this type of false visual information. Further exploration of these different response levels could also aid in the development of therapeutic techniques that address vision-driven balance deficiencies.
For both perturbation types, the parameters most sensitive and reliable to M-L perturbations were those that measured variabilities of COM position, COM velocity and step width. These parameters revealed that M-L platform perturbations produced responses that were generally consistent across individuals and proportional to perturbation amplitude. Conversely, M-L visual field perturbations produced some significant responses compared to unperturbed gait, but the response magnitudes were neither consistent nor proportional. Because of this variability and the fact that visual processing is a critical component of balance and gait balance, more in-depth investigations of this perturbation type are clearly warranted. Incorporating a broader range of perturbation amplitudes that include those used in this study and the lower levels of earlier studies would also help determine if a response ceiling existed. Variabilities caused by the existence and low incidence of unresponsive or minimally responsive participants mean that a larger sample size will be needed to isolate and explore ‘non-responder’ characteristics. Furthermore, future studies should be accompanied by other visual tests to help determine whether the degree of individual responsiveness is a function of visual dependence, cortical processing that enables some individuals to disregard false visual input, or some other factor(s). This additional knowledge could enable breakthroughs in understanding and identifying fall susceptibility, which would lead to more personalized therapy to improve deficient balance.
Acknowledgments
This research was supported by NIH Grant R01-HD059844. The views expressed herein are those of the authors and do not reflect the official policy or position of Brooke Army Medical Center, the US Army Medical Department, the US Army Office of the Surgeon General, the Department of the Army, Department of Defense or the US Government.
Footnotes
Conflict of interest statement
No benefits in any form have been or will be received from a commercial party related directly or indirectly to the subject of this manuscript.
References
- Brady RA, Peters BT, Bloomberg JJ, 2009. Strategies of healthy adults walking on a laterally oscillating treadmill. Gait and Posture 29 (4), 645–649. [DOI] [PubMed] [Google Scholar]
- Collins TD, Ghoussayni SN, Ewins DJ, Kent JA, 2009. A six degrees-of-freedom marker set for gait analysis: repeatability and comparison with a modified Helen Hayes set. Gait and Posture 30 (2), 173–180. [DOI] [PubMed] [Google Scholar]
- Centers for Disease Control and Prevention. Web-based Injury Statistics Query and Reporting System (WISQARS) [Online]. (2003). National Center for Injury Prevention and Control, Centers for Disease Control and Prevention (producer). Available from: 〈www.cdc.gov/ncipc/wisqars〉 2011. (31/08/11). [Google Scholar]
- Dingwell JB, Marin LC, 2006. Kinematic variability and local dynamic stability of upper body motions when walking at different speeds. Journal of Biomechanics 39 (3), 444–452. [DOI] [PubMed] [Google Scholar]
- Eng JJ, Winter DA, Patla AE, 1997. Intralimb dynamics simplify reactive control strategies during locomotion. Journal of Biomechanics 30 (6), 581–588. [DOI] [PubMed] [Google Scholar]
- Hollman JH, Brey RH, Bang TJ, Kaufman KR, 2007. Does walking in a virtual environment induce unstable gait? An examination of vertical ground reaction forces. Gait and Posture 26 (2), 289–294. [DOI] [PubMed] [Google Scholar]
- Hollman JH, Brey RH, Robb RA, Bang TJ, Kaufman KR, 2006. Spatiotemporal gait deviations in a virtual reality environment. Gait and Posture 23 (4), 441–444. [DOI] [PubMed] [Google Scholar]
- Lamontagne A, Fung J, McFadyen BJ, Faubert J, 2007. Modulation of walking speed by changing optic flow in persons with stroke. Journal of Neuroengineering and Rehabilitation 4, 22. [DOI] [PMC free article] [PubMed] [Google Scholar]
- McAndrew PM, Dingwell JB, Wilken JM, 2010. Walking variability during continuous pseudo-random oscillations of the support surface and visual field. Journal of Biomechanics 43 (8), 1470–1475. [DOI] [PMC free article] [PubMed] [Google Scholar]
- McAndrew PM, Wilken JM, Dingwell JB, 2011. Dynamic stability of human walking in visually and mechanically destabilizing environments. Journal of Biomechanics 44 (4), 644–649. [DOI] [PMC free article] [PubMed] [Google Scholar]
- Nyberg L, Lundin-Olsson L, Sondell B, Backman A, Holmlund K, Eriksson S, Stenvall M, Rosendahl E, Maxhall M, Bucht G, 2006. Using a virtual reality system to study balance and walking in a virtual outdoor environment: a pilot study. Cyberpsychology and Behavior 9 (4), 388–395. [DOI] [PubMed] [Google Scholar]
- O’Connor SM, Kuo AD, 2009. Direction-dependent control of balance during walking and standing. Journal of Neurophysiology 102 (3), 1411–1419. [DOI] [PMC free article] [PubMed] [Google Scholar]
- Oddsson LIE, Wall C, McPartland MD, Krebs DE, Tucker CA, 2004. Recovery from perturbations during paced walking. Gait and Posture 19 (1), 24–34. [DOI] [PubMed] [Google Scholar]
- Warren WH, Kay BA, Yilmaz EH, 1996. Visual control of posture during walking: functional specificity. Journal of Experimental Psychology: Human Perception and Performance 22 (4), 818–838. [DOI] [PubMed] [Google Scholar]
- Wu Q, Swain R, 2002. A mathematical model of the stability control of human thorax and pelvis movements during walking. Computer Methods in Biomechanics and Biomedical Engineering 5 (1), 67–74. [DOI] [PubMed] [Google Scholar]
- Zeni JA Jr., Richards JG, Higginson JS, 2008. Two simple methods for determining gait events during treadmill and overground walking using kinematic data. Gait and Posture 27 (4), 710–714. [DOI] [PMC free article] [PubMed] [Google Scholar]


