Abstract
Three crude oil bioremediation techniques were applied in a randomized block field experiment simulating a coastal oil spill. Four treatments (no oil control, oil alone, oil plus nutrients, and oil plus nutrients plus an indigenous inoculum) were applied. In situ microbial community structures were monitored by phospholipid fatty acid (PLFA) analysis and 16S rDNA PCR-denaturing gradient gel electrophoresis (DGGE) to (i) identify the bacterial community members responsible for the decontamination of the site and (ii) define an end point for the removal of the hydrocarbon substrate. The results of PLFA analysis demonstrated a community shift in all plots from primarily eukaryotic biomass to gram-negative bacterial biomass with time. PLFA profiles from the oiled plots suggested increased gram-negative biomass and adaptation to metabolic stress compared to unoiled controls. DGGE analysis of untreated control plots revealed a simple, dynamic dominant population structure throughout the experiment. This banding pattern disappeared in all oiled plots, indicating that the structure and diversity of the dominant bacterial community changed substantially. No consistent differences were detected between nutrient-amended and indigenous inoculum-treated plots, but both differed from the oil-only plots. Prominent bands were excised for sequence analysis and indicated that oil treatment encouraged the growth of gram-negative microorganisms within the α-proteobacteria and Flexibacter-Cytophaga-Bacteroides phylum. α-Proteobacteria were never detected in unoiled controls. PLFA analysis indicated that by week 14 the microbial community structures of the oiled plots were becoming similar to those of the unoiled controls from the same time point, but DGGE analysis suggested that major differences in the bacterial communities remained.
The study of microbial diversity and community dynamics is rapidly growing in microbial ecology. Interest in this area has been catalyzed by the rapid advancement of molecular ecological methodologies. Through the use of culture-independent molecular techniques, new insights into the composition of uncultivated microbial communities have been gained (see reference 11 for an excellent review). It is now becoming possible to define the causes of time-dependent changes in the health of a stressed ecosystem on the basis of the structural composition of the ecosystem population (11).
In particular, analysis of the microbial communities that take part in in situ hydrocarbon biodegradation activities has been a challenge to microbiologists. The reason for this is that most (∼90 to 99%) of the species making up competent degrading communities do not form colonies when current laboratory-based culture techniques are used (24, 25, 38). The measurement of lipid biomarkers, specifically, phospholipid fatty acids (PLFA), together with nucleic acid-based molecular techniques for fingerprinting the 16S ribosomal DNA (rDNA) component of microbial cells is a powerful combination of techniques for elucidating the microbial ecology of actively bioremediating communities (29). Lipid biomarker-based techniques measure the lipid profiles of microbes in the environment irrespective of culturability, thereby avoiding culture bias (36, 37). These methods provide insight into several important characteristics of microbial communities, specifically the viable biomass, community structure, and nutritional status or physiological stress responses of the gram-negative bacteria (37, 38).
Microbial communities within contaminated ecosystems tend to be dominated by those organisms capable of utilizing and/or surviving toxic contamination. As a result, these communities are typically less diverse than those in nonstressed systems, although the diversity may be influenced by the complexity of chemical mixtures present and the length of time the populations have been exposed. However, when gram-negative bacteria dominate the system (as is usually the case in hydrocarbon-contaminated environments), the insight gained from lipid biomarker analysis primarily concerns nutritional or physiological status with little differentiation among bacterial species. A complementary method by which the shift in such a microbial community structure can be monitored in greater detail is denaturing gradient gel electrophoresis (DGGE). This method makes use of the 16S rDNA molecule carried by all bacteria, the sequences of which provide molecular markers for species identification (for historical reviews on the use of rRNA sequences for studying microbial communities, see references 1, 20, and 22). The method was originally used for profiling microbial populations in environmental samples by Muyzer et al. (19). Recent examples of its application can be found in references 6, 8, 17, 21, 28, and 32.
This study was undertaken to gain insight on the progress of natural attenuation and enhanced bioremediation during a controlled oil spill field experiment in Delaware (33). Frozen samples from the field study were extracted and analyzed for PLFA and 16S rDNA DGGE profiles. Nonfrozen samples were analyzed by most-probable-number (MPN) techniques, to quantify the alkane- and aromatic hydrocarbon-degrading population changes over time. Results were used to determine how the degrading and nondegrading communities changed during the course of the 14-week experimental investigation and whether the community structure of the oiled plots was returning to the background control structure by the end of the test period. Such a return to prespill conditions would strongly indicate that the site was restored and that cleanup activities could cease.
MATERIALS AND METHODS
Experimental design.
The site for the field study was located at Fowler Beach, Del., approximately midway between Dover and Rehoboth Beach. The bioremediation experiment was a randomized complete block design. Five replicate blocks of beach were marked off, each large enough (minimum length, 60 m) to accommodate four experimental units or test plots (each measuring 4 by 9 m). Treatments consisted of an unoiled control, a natural attenuation control (oiled with no amendments), an oiled treatment receiving nutrients, and an oiled treatment receiving nutrients and an indigenous inoculum of hydrocarbon-degrading microorganisms derived from the site. The four treatments were randomized in each of the five blocks. Details of the block layout, nutrient and oil application methods, and sampling procedures used are reported elsewhere (33, 34).
Mineral nutrients (NaNO3 and Na5P3O10) predissolved in about 800 liters of seawater were applied daily via a sprinkler system. The amounts applied were 2 kg of technical-grade NaNO3 (330 g of N) and 128 g of Na5P3O10 per plot. Once a week, 30 liters of a suspended mixed population of hydrocarbon-degrading bacteria was also added to each of the inoculum plots (see below). For the unoiled and the natural attenuation plots, only seawater was applied through the sprinkler system. Nigerian Bonny light crude oil, previously weathered by aeration for 2 days, was applied at the rate of 136 liters/plot, resulting in a calculated crude oil contamination level of approximately 5 g/kg of sand. The oil was weathered by placing about 3 m3 in a 3.6-m-diameter plastic tank, connecting a pump and hose, and continuously spraying and recirculating the oil within the tank for 2 days to evaporate the light fraction.
Inoculum preparation.
The original culture consisted of a mixed consortium isolated from a nearby beach several months prior to the experiment and grown in the laboratory on Alaska North Slope crude oil previously weathered at 272°C to remove the light hydrocarbons. The culture was isolated by collecting a 500-g sample of sand from the surface of Slaughter Beach, approximately 1.5 km north of Fowler Beach, refrigerating it in a cooler, and shipping it to the laboratory for growth on the weathered Alaska North Slope crude oil in shake flasks containing Bushnell Haas medium supplemented with 20 g of NaCl per liter and 2 g of KNO3 per liter as the nitrogen source. The indigenous inoculum was prepared in the field by inoculating a portion of this culture into two 210-liter stainless steel drums containing 170 liters of seawater from Delaware Bay, the weathered Bonny Light crude oil (600 ml), and the same nutrients as used on the beach. Constant aeration and mixing were provided by a diffuser attached to an air pump. These enrichments were grown for 2 weeks at an ambient temperature. To allow weekly inoculation with fresh 2-week cultures, each drum was offset in time from the other by 1 week.
Sampling.
For hydrocarbon measurement, samples were collected from four separate sectors of each plot during each sampling event. Samples were collected in soil corers every 2 weeks for 14 weeks. Each sample was a composite of two cores, each measuring 7.6 cm in diameter and 15.2 cm in length, giving a sample wet volume of approximately 3 liters. The four samples from each plot were frozen on dry ice, shipped to Cincinnati, Ohio, and split into two subsamples, one for oil analysis and the other for archiving at −70°C. When the PLFA and DGGE analyses were performed, 25-g subsamples from the four archived samples from each plot were composited. Only three of the five replicate samples from weeks 0, 8, and 14 were analyzed for 16S rDNA, while all five replicate samples from weeks 0, 2, 4, 8, 10 and 14 were analyzed for PLFA.
MPN analysis.
Sediment subsamples (∼300 g [wet weight]) from each plot were placed in Whirlpak bags, brought back under ice to the on-site mobile laboratory trailer, and immediately processed for MPN analysis of alkane- and polynuclear aromatic hydrocarbon (PAH)-degrading bacteria (39).
Petroleum analyses.
Sand samples from the field were collected every 14 days, frozen on dry ice, and shipped to Cincinnati for processing. The 100-g sand subsamples were mixed with an equal volume of anhydrous Na2SO4, the mixture was extracted by sonicating it three times for 10 min with dichloromethane (DCM), and the final dichloromethane extract was solvent exchanged to hexane (33). A Hewlett-Packard model 5890 Series II gas chromatograph (GC) equipped with a Hewlett-Packard model 5971A mass selective detector was used for measuring the oil analytes. The mass selective detector was operated in the selected ion monitoring mode for quantifying specific saturated hydrocarbons, PAHs, and sulfur heterocyclic constituents. Operating conditions of the GC-mass spectrometry instrument have been described (33). Nitrate was analyzed by the cadmium reduction method (2) with an autoanalyzer (Technicon Instruments Corp., Tarrytown, N.Y.).
DNA extraction and PCR amplification.
Nucleic acid was extracted directly from triplicate 0.5-g composite samples (0, 8, and 14 weeks) as described previously (29). PCR amplification of the 16S rDNA fragments prior to DGGE was performed as described by Muyzer et al. (19). Briefly, thermocycling consisted of 35 cycles at 92°C for 45 s, 55°C for 30 s, and 68°C for 45 s, with 1.25 U of Expand HF polymerase (Boehringer, Indianapolis, Ind.) and 10 pmol of each of the primers described in the work of Muyzer et al. (19) (the forward primer carried the 40-bp GC clamp) in a total volume of 25 μl. Thermocycling was performed with a Robocycler PCR block (Stratagene, La Jolla, Calif.). The primers targeted eubacterial 16S regions corresponding to Escherichia coli nucleotide positions 341 to 534 (3).
DGGE analysis.
DGGE was performed by using a D-Code 16/16-cm gel system with a 1.5-mm gel width (Bio-Rad, Hercules, Calif.) maintained at a constant temperature of 60°C in 6 liters of 0.5× TAE buffer (20 mM Tris acetate, 0.5 mM EDTA [pH 8.0]). Gradients were formed between 20 and 55% denaturant (with 100% denaturant defined as 7 M urea plus 40% [vol/vol] formamide). Gels were run at 35 V for 16 h. Gels were stained in purified water (Milli-Ro; Millipore, Bedford, Mass.) containing ethidium bromide (0.5 mg/liter) and destained twice in 0.5× TAE buffer for 15 min each. Images were captured with the Alpha-Imager software (Alpha Innotech, San Leandro, Calif.).
Extraction of DNA from acrylamide gels and sequence analysis.
The central 1-mm2 portions of strong DGGE bands were excised with a razor blade and soaked in 50 μl of purified water (Milli-Ro; Millipore) overnight. A portion (15 μl) was removed and used as the template in a PCR as described above. The products were purified by electrophoresis through a 1.2% agarose–TAE gel followed by glass-milk extraction (Gene-Clean kit; Bio 101). Purified DNA was sequenced with an ABI-Prism model 373 automatic sequencer. Sequence identification was performed by use of the BLASTN facility of the National Center for Biotechnology Information (2a) and the Sequence Match facility of the Ribosomal Database Project (18, 25a).
Cloning of PCR-amplified products.
Amplification products that failed to generate legible sequences directly were cloned into the PCR-TOPO 2.1 cloning vector (Invitrogen, Carlsbad, Calif.) according to the manufacturer’s instructions. Recombinant (white) colonies were screened by using a two-stage procedure to ensure recovery of the DGGE band of interest. First, plasmid inserts (12 for each band) were reamplified by PCR with vector-specific primers (M13 reverse and T7; Invitrogen Corp.). The products were digested with restriction endonuclease MspI and analyzed by agarose gel electrophoresis (2% agarose, 1× TAE buffer). Two products from each digestion pattern group were reamplified with the 16S-specific PCR primers described above (19) and subjected to DGGE analysis to ensure comigration with the original band of interest. Sequences that were of high frequency in clone libraries (at least 8 of 12 clones as defined by digestion pattern) and comigrated with the original band of interest were selected for sequence analysis (two clones band−1).
Lipid analysis.
All solvents used were of GC grade and were obtained from Fisher Scientific (Pittsburgh, Pa.). Triplicate subsamples from each plot composite were extracted by using the modified Bligh/Dyer method as described previously by White et al. (35, 36, 37). The total lipids obtained were fractionated into glyco-, neutral, and polar lipids (9). The polar lipid fraction was transesterified with mild alkali to recover the PLFA as methyl esters in hexane (9). The PLFAs were separated and quantified by GC-flame ionization detection and identified by GC-mass spectrometry as follows. The fatty acid methyl esters were analyzed by capillary GC with flame ionization detection on a Hewlett-Packard model 5890 series 2 chromatograph with a 50-m nonpolar column (0.2-mm inside diameter and 0.11-μm film thickness). The injector and detector were maintained at 270°C and 290°C, respectively. The column temperature was programmed at 60°C for 2 min, then ramped at 10°C per min to 150°C, and then ramped to 312°C at 3°C per min. The preliminary peak identification was done by comparison of retention times with known standards. Detailed identification of peaks was by GC-mass spectroscopy of selected samples with a Hewlett-Packard model 5890 series 2 gas chromatograph interfaced to a Hewlett-Packard model 5971 mass selective detector by using the same column and temperature program previously described. Mass spectra were determined by electron impact at 70 eV. Methyl nonodecanoate was used as the internal standard, and the PLFAs were expressed as equivalent peak responses to the internal standard. Fatty acid nomenclature is in the form of A:BωC, where A designates the total number of carbons, B the number of double bonds, and C the distance of the closest unsaturation from the aliphatic end of the molecule. The suffixes “-c” for cis and “-t” for trans refer to geometric isomers. The prefixes “i-,” “a-,” and “me-” refer to iso-, anteisomethyl branching, and mid-chain methyl branching, respectively, with cyclopropyl rings indicated by “cy” (15).
Statistical analysis.
Analysis of variance (ANOVA) was used to determine whether there were significant differences among lipid biomarker data obtained for the four treatments (6 sampling events × 5 replicates [n = 30]), with time (5 replicates × 4 treatments [n = 20]), oiled (3 treatments × 6 events × 5 replicates [n = 90]), and unoiled (1 treatment × 6 sampling events × 5 replicates [n = 30]) samples. ANOVAs were performed with Statistica, version 5.1, for Windows (Statsoft Inc., Tulsa, Okla.). For chromatographic peak analysis, plots of log (average) versus log (variance) were used to determine the appropriate transformation of the variables (4). The square root transformation was chosen. A hierarchical cluster analysis (incremental linkage method) based on euclidean distance was performed on the means (n = 5) of the transformed data. Hierarchical and principal component analysis were performed with the statistical package Einsight (Infometrix Inc., Seattle, Wash.).
Nucleotide sequence accession numbers.
All unique partial rDNA sequences were submitted to GenBank as Dw1 to Dw22 (for Delaware) with accession no. AF128774 to AF128795, respectively.
RESULTS
Bioremediation.
The first-order rate coefficients of the biodegradation results for the oiled plots are summarized in Table 1. The nitrate-N concentrations naturally present within the interstitial pore water on Fowler Beach, Del., were high enough (mean = 0.8 ± 0.3 mg/liter [n = 96]) to sustain rapid natural attenuation rates in the unamended plots (−0.026 day−1 for alkanes compared to −0.056 day−1 for nutrient-amended plots; −0.021 day−1 for PAHs compared to −0.031 day−1 for nutrient-amended plots). Despite the high intrinsic biodegradation rates in the oiled controls, results from the biweekly samplings indicated that both the alkane and the PAH biodegradation rates in the nutrient- and inoculum-treated plots were significantly higher (P < 0.05) than that of the unamended control but were not significantly different from each other (see reference 33 for a detailed discussion). Less than 10% of the alkanes and 30% of the PAHs remained in the nutrient-amended plots after 6 weeks of exposure compared to approximately 35 and 45%, respectively, in the natural attenuation plots.
TABLE 1.
Rate coefficients and coefficients of determination for the biodegradation of total alkanes and total aromatics
| Oiled treatment | Alkanes
|
Aromatics
|
||
|---|---|---|---|---|
| k (day−1) | r2 | k (day−1) | r2 | |
| Control | −0.026 | 0.88 | −0.021 | 0.84 |
| Nutrients | −0.056a | 0.90 | −0.031a | 0.89 |
| Inoculum + nutrients | −0.045a | 0.91 | −0.026a | 0.83 |
Rate coefficient significantly different from control (P < 0.05; n = 40).
MPN analysis.
Data showing changes in densities of alkane and PAH degraders have been reported elsewhere (34). Briefly, the alkane degraders on the oiled plots were already at their maximum carrying capacity at T0 (defined as the day on which amendments were first added, which was 4 days after oil had been applied to the plots), whereas on the unoiled plots they were about 2 orders of magnitude lower. They slowly declined in the oiled plots over the course of the next 14 weeks, and no significant differences were noted among the three oiled treatments (P > 0.05). The PAH degraders in the oiled plots increased by about 3 orders of magnitude within 2 weeks after the experiment was started, but they also slowly declined with time thereafter.
Lipid analysis.
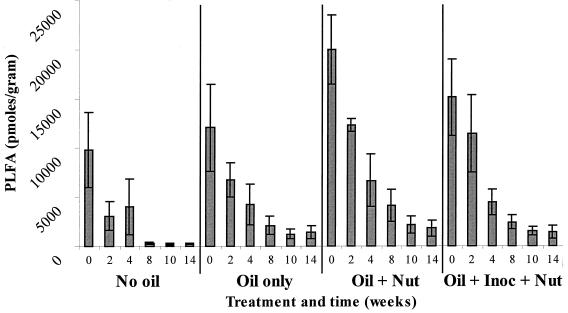
Analysis of the PLFA profiles was carried out on replicate samples (n = 5) from all four treatments from weeks 0, 2, 4, 8, 10, and 14. The PLFA contents for these samples ranged from a minimum of 239 ± 79 pmol per g for the unoiled plot (week 14) to a maximum of 19,974 ± 3,504 pmol per g for the nutrient-amended oiled plot at T0 (Fig. 1). Biomass content decreased over time in all treatments (P < 0.05). At weeks 0 and 2, the biomass measured on the nutrient-amended plots was significantly higher than those on the unoiled plots and the natural attenuation plots. For weeks 8 through 14, all oiled plots contained significantly more biomass (P < 0.05) than the unoiled plots (Fig. 1) on the basis of results determined by ANOVA.
FIG. 1.
Biomass content (picomoles of PLFA/gram of soil) of samples of the unoiled control, oil only, oil plus nutrient, and oil plus inoculum plus nutrient from weeks 0 through 14 (n = 5). Error bars represent standard deviations.
Community structure.
The community structures of all oiled samples, measured by using PLFA analysis, shifted away from that of the unoiled (background) samples with time. The major difference in the PLFA profiles was that the microbial communities in the oiled samples contained significantly more monoenoic PLFA (specifically, 16:1ω7c, 18:1ω7c, 16:1ω7t, and 18:1ω7t [P < 0.05]), indicative of gram-negative bacteria (31, 37), than those in the unoiled samples. At all plots and for all treatments, the relative proportion of PLFAs indicative of eukaryote biomass (37), specifically, 18:1ω9c, 20:1ω9c, 20:0, and 22:1ω9c, decreased over time. This change in eukaryotic biomass coincided with the disappearance of horseshoe crab eggs that had been deposited in the sand during the mating season prior to experimental startup.
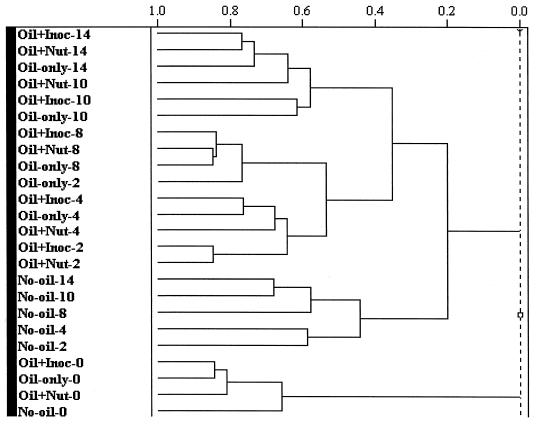
A hierarchical cluster analysis of the PLFA profiles (arc sine-transformed mole percent data) showed the major trends within the data set (Fig. 2). Due to the presence of a high relative proportion of 18:1ω9c, all the samples from week 0 clustered together. The natural attenuation, nutrient-amended, and inoculum-amended plot samples from weeks 4 through 14 clustered according to time, as did the nutrient- and inoculum-amended samples from week 2. The profiles from the unoiled background plots (weeks 2 through 14) also clustered together (Fig. 2) but were separate from the oiled samples.
FIG. 2.
A dendrogram representation of a hierarchical cluster analysis (incremental euclidean distance) of the PLFA contents described in Fig. 1. Inoc, inoculum; Nut, nutrient.
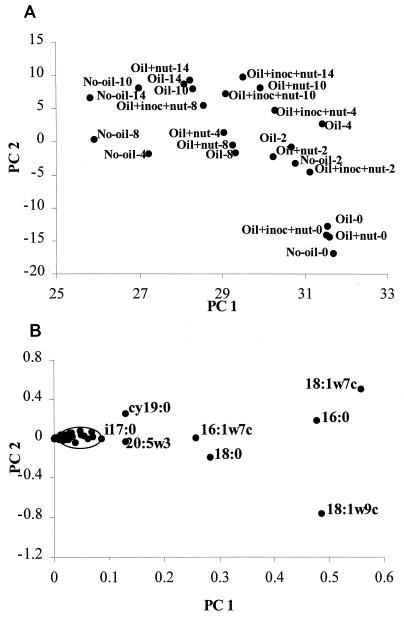
A principal-component analysis (PCA) of the PLFA profiles showed similar results; i.e., all the week 0 treatments and the unoiled background samples from weeks 4 through 14 formed distinct clusters (Fig. 3A). Two principal components were derived that accounted for 92 and 6.6% of the variance inherent in the data set. The first principal component was influenced most strongly by 18:1ω9c and to a lesser extent 18:0 (eukaryote biomass) (Fig. 3B) (in this case most likely indicative of eukaryote [horseshoe crab egg] biomass) and accounted for the tight clustering of the week 0 samples. The second principal component was most strongly influenced by 18:1ω7c (indicative of gram-negative bacteria) (Fig. 3B) and to a lesser extent cy19:0 (again gram-negative bacteria). This second principal component accounted for the separation of the oiled samples from weeks 2 through 14 from the unoiled background samples.
FIG. 3.
(A) A scatter plot of the results from the PCA of the PLFA contents described in Fig. 1. (B) A scatter plot of the coefficient of loading derived from the PCA in panel A. PLFAs that are not heavily influential are circled but not labeled. inoc, inoculum; nut, nutrient.
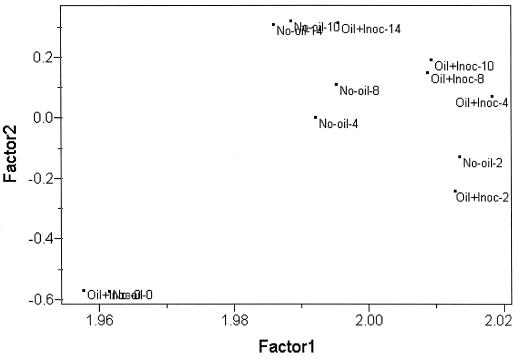
To investigate more fully the shifts within the microbial communities of the oiled samples compared to the background sample, PCA was used to analyze paired samples (i.e., unoiled versus oiled and unamended, unoiled versus oiled and nutrient-treated, and unoiled versus oiled and inoculated plots). The analyses comparing the PLFA profiles of the unoiled samples with those from each of the different treatments consistently revealed the same patterns. At week 0, the profiles clustered together; at week 2, a greater distance occurred between the oiled and unoiled sample profiles; by weeks 4 and 8, the oiled plot samples had separated from the background samples. By week 10 the PLFA profiles of the oiled unamended samples more closely resembled those of the unoiled controls. A similar shift was observed for the PLFA profiles of the nutrient- and inoculum-amended plots by week 14. The best example of this was in the background unoiled versus inoculated PCA (Fig. 4). The scatter plots for the loadings of the individual PLFA showed the same patterns as those described for the whole data set in Fig. 3.
FIG. 4.
A scatter plot of results from the PCA of the PLFA contents from the unoiled samples and the inoculum (Inoc)-plus-nutrient-amended oiled samples.
Physiological status.
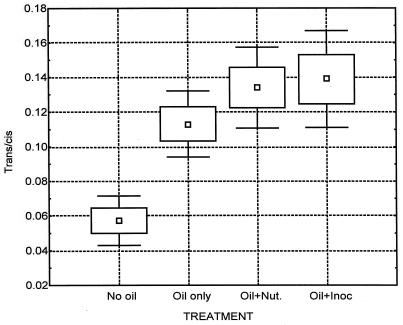
The lipid profiles of microorganisms are a product of the metabolic pathways and consequently reflect the phenotypic response of the organism to its environment and any changes therein (38). Gram-negative bacteria make trans-monounsaturated fatty acids as a result of changes in their environment, e.g., exposure to solvent (12, 23, 26, 27), toxic metals (7), or starvation (10, 16). The physiological status of gram-negative communities can be assessed from the trans/cis ratios of the PLFA, with ratios of less than 0.05 shown to be representative of healthy, nonstressed communities (37). Irrespective of sampling time, the trans/cis ratios for the oiled samples were significantly higher (P < 0.05) than for the unoiled background samples (Fig. 5).
FIG. 5.
A box and whisker plot of the summed ratios of the trans and cis isomers of the 16:1ω7 and 18:1ω7 PLFAs in the treated samples (n = 30 [for each treatment]). Boxes indicate standard errors and error bars indicate standard deviations. Nut., nutrient; Inoc, inoculum.
PCR-DGGE analysis of bacterial community structures.
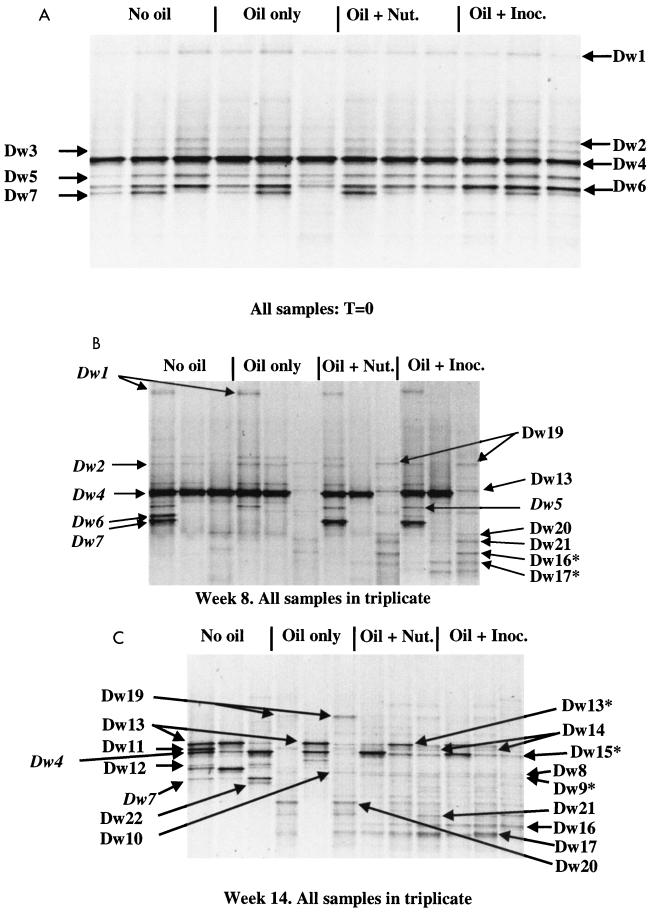
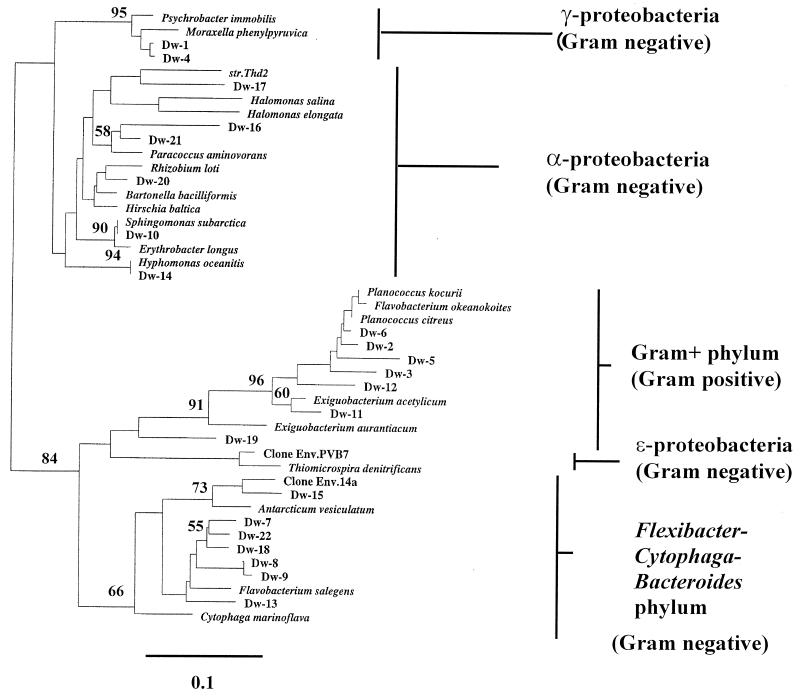
PCR-DGGE analysis of bacterial community structure was carried out on three of the five replicate plots at weeks 0, 8, and 14. Banding patterns are shown in Fig. 6A, B, and C. A neighbor-joining dendrogram showing the relationships of the sequences recovered from prominent bands is shown in Fig. 7. At time zero (Fig. 6A) all samples generated a simple banding pattern of no more than seven visible bands. The derived sequences from these bands (Dw1 to Dw7) suggested dominance of the community by gram-positive microorganisms related to the genus Planococcus (Dw2, Dw3, Dw5, and Dw6). Gram-negative microorganisms were represented by three bands, either within the Flexibacter-Cytophaga-Bacteroides phylum (Dw7) or closely related to the genera Psychrobacter and Moraxella within the γ subgroup of the proteobacteria (Dw1 and Dw4). At week 8, reproducibility among the replicates from the oil-treated samples was at a low level and showed no obvious relation to additional treatment. Representative patterns are shown in Fig. 6B, derived from three of the plots treated with both nutrients and inocula. All bands visible at time zero remained strong in some plots within each treatment but had disappeared from others to be replaced by highly complex banding patterns. Novel bands that appeared during the course of the experiment are shown in Fig. 6B and C. The appearance of novel bands in the unoiled plots consisted of four bands (Dw11, Dw12, Dw13, and Dw22). Dw11 and Dw12 showed relationship to the gram-positive genera Exiguobacterium and Planococcus, respectively, and appeared in one or more of the unoiled sample plots at week 14 (Fig. 6C). Dw13 and Dw22 represented members of the Bacteroides-Flexibacter-Cytophagales phylum. Dw13 also appeared in the unoiled plots at week 8.
FIG. 6.
DGGE analysis of bacterial communities at three time points. Amplified products were separated on a gradient of 15 to 55% denaturant. The region shown represents approximately 20 to 45% denaturant, in which all visible bands formed. All labeled bands were excised from the gel, reamplified, and subjected to sequence analysis. Bands marked with an asterisk failed to generate legible sequences by direct analysis. These reamplification products were cloned, and the clones were screened as described in the text. Italicized labels indicate bands that were also derived from earlier time points and are noted to allow visual comparison between gels. (A) Community structures at time zero. Time zero was defined as 4 days after oil was added to the plots and was the time point at which accelerated remediation techniques were initiated (amendment with nutrients [Nut.] or nutrients plus inoculum [Inoc.]). No obvious differences between the community structures of the oil-treated and unoiled control plots had been induced at this time, because all plots appeared to be dominated by a small number of species. (B) Community structures after 8 weeks of treatment. Most, but not all, oiled plots had developed complex banding patterns compared to the unoiled control samples, indicating an even distribution of numerous dominant species. (C) Community structures after 14 weeks of treatment. The banding patterns of all oiled plots were complex compared to unoiled plots. Two bands (Dw8 and Dw9) were visible only in oiled plots that had also received nutrient amendment.
FIG. 7.
Relationships of sequences derived from DGGE bands to partial 16S rDNA sequences of reference organisms and environmental clones. A neighbor-joining analysis with Jukes and Cantor (14) correction and bootstrap support was performed on DGGE band-derived sequences and reference sequences gathered from the Ribosomal Database Project (18) by using the PHYLIP suite of programs (5) within the ARB sequence management system (30). Bootstrap values are given at nodes when they exceeded 50% and refer to the clusters to the right of each number. Scale, 10% estimated change. Dw19 could not be assigned to a recognized clade below the ranking of bacteria.
Phylogenetic analysis of the sequences derived from bands that appeared specifically in oil-treated plots revealed that one was related to gram-negative species within the Flexibacter-Cytophaga-Bacteroides phylum (Dw15). Dw15 may also have been abundant in unoiled plots but may have been obscured by the comigrating band Dw4. The sequence of the single band Dw19 could not be placed firmly within any established bacterial grouping. Five other novel bands, with relationship to microorganisms of the gram-negative α subgroup of the proteobacteria, were recovered only from oiled plots (Dw14, Dw16, Dw17, Dw20 and Dw21). No sequences indicative of the presence of α-proteobacteria were recovered from unoiled plots at any time point. Fig. 6C shows the patterns derived from all sample plots at week 14. No novel bands had appeared in the background samples, compared to those from week 8, and all bands sequenced were identical to those recovered at week 8 (Fig. 7). A single novel band loosely related to the genus Sphingomonas in the α-subgroup proteobacteria was detected uniquely in one oil-only control plot (Dw10). Two novel bands appeared as minor components of the banding patterns derived from all replicates of all plots treated with nutrients, irrespective of the addition of inocula (Dw8 and Dw9). These represented two closely related sequences within the gram-negative Flexibacter-Cytophaga-Bacteroides phylum; it might be significant that these two bands did not appear in any of the natural attenuation plots, but the contribution of these species to the enhanced bioremediation of hydrocarbons remains speculative. Although PLFA analysis suggested the presence of actinomycetes and sulfate-reducing bacteria, no sequences related to cultured members of either group were recovered from any sample plot, indicating that both groups were present below PCR-DGGE detection levels as applied.
PCR-DGGE analysis of the enrichment culture inoculum.
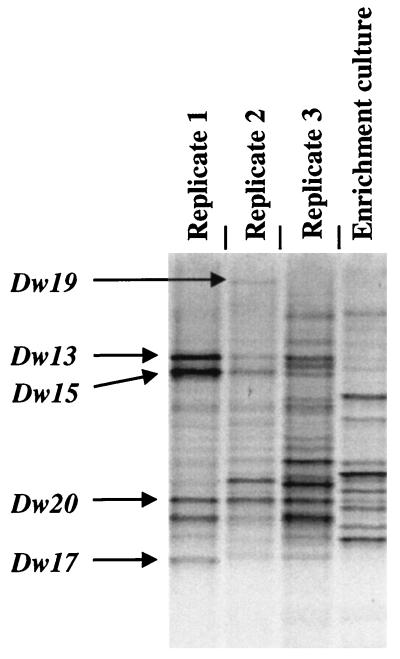
PCR-DGGE comparison of the bacterial communities of the enrichment inoculum with the bacterial communities recovered from those test plots at week 14 showed little commonality in banding pattern (Fig. 8). Only a single band, comigrating with Dw20, was common to the inoculum and the inoculated plots, but this band was also common to uninoculated plots. Thus, PCR-DGGE did not suggest that any part of the inoculum had become established as detectable components of the bacterial community.
FIG. 8.
PCR-DGGE comparison of the inoculum and inoculated beach samples at week 14. Few if any common bands could be discerned between the DGGE pattern derived from the inoculum and the patterns derived from the three plots onto which it was sprayed, indicating that the inoculated bacteria did not compete well with the indigenous bacterial community. No bands derived from the inoculum were excised for sequence analysis.
DISCUSSION
The results of PCR-DGGE analysis coupled with band excision and sequence analysis were in good agreement with the PLFA analysis as it applied to the bacterial community. DGGE analysis suggested that the bacterial communities of the unoiled plots were dominated by gram-positive microorganisms during the 14-week study. The bacterial community structures revealed by PCR-DGGE of all oiled plots demonstrated a marked rise in the proportion of species belonging to the α subgroup of the proteobacteria and also a less pronounced increase in species of the Flexibacter-Cytophaga-Bacteroides phylum. By week 14, no strong bands representing gram-positive microorganisms were detectable in any oiled plot. Thus, the increase in the relative abundance of gram-negative biomass detected in oiled plots by PLFA analysis could be tentatively ascribed to the growth of a limited number of species related to these two groups. This conclusion is in close agreement with the viable MPN observations showing that both alkane and PAH degraders increased significantly within the first 2 weeks after oil was applied to the plots, compared to the unoiled plots. The disappearance of γ-subgroup proteobacterial species as a major component of the bacterial community after time zero was common to all samples and therefore not related to oiling.
The only apparent differences between oiled treatments that were related to the abundance of gram-negative bacteria were between plots receiving nutrients and those that did not. An α-proteobacterium related to the genus Sphingomonas reached detection levels in at least one natural attenuation plot but was not detected in plots receiving nutrients. In all plots receiving nutrients, two closely related sequences, derived from members of the Flexibacter-Cytophaga-Bacteroides phylum and differing by a single base pair over the region recovered, were detected. It is noteworthy that these two bands appeared only in the nutrient-amended plots and not in the natural attenuation plots. It is possible that the appearance of the source microorganism(s) of these bands was directly related to the addition of biostimulating nutrients, which may have been limiting in the natural attenuation plots, thus precluding their development. If this was the case, then this would be evidence that nutrient addition brought about a change in the microbial ecology in the treated plots that may, at least partially, have caused the significantly higher biodegradation rates in these plots. Although PLFA analysis indicated that the overall microbial community structures of all plots were becoming more similar by week 14, PCR-DGGE analysis indicated that at a finer scale, considerable differences between the bacterial communities of oiled and unoiled samples persisted. It is well established that PCR-DGGE as applied can detect microorganisms which represent only 1 to 2% of the target group (19, 28). Therefore, the method used is incapable of detecting minor community components that may be essential in the degradation of specific hydrocarbon classes.
When the plots treated by addition of nutrients and those treated by addition of nutrients and a hydrocarbon-degrading inoculum derived from the same site were compared, no differences in the rate of bioremediation of crude oil or community structure as determined by either PLFA, PCR-DGGE, or MPN analysis were detected. In an attempt to explain this, PCR-DGGE was used to compare the bacterial community structures of the inoculum with those of the plot to which it was added. Although the results are not definitive, few if any of the bands recovered from the inoculum comigrated with any of the visible bands recovered from the inoculation plots, indicating that the inoculated bacteria did not compete favorably with the indigenous bacterial community, even though they were originally derived from a nearby beach. This may be one explanation for the ineffectiveness of the inoculum. Another explanation would be the relatively low numbers of degraders present in the inoculum to begin with. The density of viable alkane and PAH degraders in the drums as measured by MPN techniques was approximately 1.9 × 10⁵ ml−1 and 2.5 × 10⁴ ml−1, respectively (33). For bioaugmentation to be a viable bioremediation technology, the inoculum size should be at least equal to if not greater than the indigenous population (13) after inoculation.
ACKNOWLEDGMENTS
This research was supported by U.S. Environmental Protection Agency research contract 7C-R374-NASX and National Science Foundation grant DEB9814813. Oak Ridge National Laboratory is managed for the U.S. Department of Energy by Lockheed Martin Energy Research Corporation under contract DE-AC05-96OR22464.
We thank Aaron Peacock for proofreading the manuscript.
REFERENCES
- 1.Amann R T. Fluorescently labelled, rRNA-targeted oligonucleotide probes in the study of microbial ecology. Mol Ecol. 1995;4:543–554. [Google Scholar]
- 2.American Public Health Association. Standard methods for the examination of water and wastewater. 19th ed. Washington, D.C: American Public Health Association; 1995. [Google Scholar]
- 2a.BLASTN. 1997, posting date. [Online.] National Center for Biotechnology Information, Bethesda, Md. http://www.ncbi.nlm.nih.gov/BLAST. [February 1999, last date accessed.]
- 3.Brosius J, Dull T L, Sleeter D D, Noller H F. Gene organisation and primary structure of a ribosomal RNA operon from Escherichia coli. J Mol Biol. 1981;148:107–127. doi: 10.1016/0022-2836(81)90508-8. [DOI] [PubMed] [Google Scholar]
- 4.Downing J A. Aggregation, transformation and the design of benthic sampling programs. J Fish Res Board Can. 1979;36:1454–1463. [Google Scholar]
- 5.Felsenstein J. PHYLIP—phylogeny inference package (version 3.2) Cladistics. 1989;5:164–166. [Google Scholar]
- 6.Felske A, Akkermans A D L, De Vos W M. Quantification of 16S rRNAs in complex bacterial communities by multiple competitive reverse transcription-PCR in temperature gradient gel electrophoresis fingerprints. Appl Environ Microbiol. 1998;64:4581–4587. doi: 10.1128/aem.64.11.4581-4587.1998. [DOI] [PMC free article] [PubMed] [Google Scholar]
- 7.Frostegård A, Tunlid A, Bååth E. Changes in microbial community structure during long-term incubation in two soils experimentally contaminated with metals. Soil Biol Biochem. 1996;28:55–63. [Google Scholar]
- 8.Gillan D C, Speksnijder A G C L, Zwart G, De Ridder C. Genetic diversity of the biofilm covering Montacuta ferruginosa (Mollusca, Bivalvia) as evaluated by denaturing gradient gel electrophoresis analysis and cloning of PCR-amplified gene fragments coding for 16S rRNA. Appl Environ Microbiol. 1998;64:3464–3472. doi: 10.1128/aem.64.9.3464-3472.1998. [DOI] [PMC free article] [PubMed] [Google Scholar]
- 9.Guckert J B, Antworth C P, Nichols P D, White D C. Phospholipid ester-linked fatty acid profiles as reproducible assays for changes in prokaryotic community structure of estuarine sediments. FEMS Microbiol Ecol. 1985;31:147–158. [Google Scholar]
- 10.Guckert J B, Hood M A, White D C. Phospholipid ester-linked fatty acid profile changes during nutrient deprivation of Vibrio cholerae: increases in the trans/cis ratio and proportions of cyclopropyl fatty acids. Appl Environ Microbiol. 1986;52:794–801. doi: 10.1128/aem.52.4.794-801.1986. [DOI] [PMC free article] [PubMed] [Google Scholar]
- 11.Head I M, Saunders J R, Pickup R W. Microbial evolution, diversity, and ecology: a decade of ribosomal RNA analysis of uncultivated microorganisms. Microb Ecol. 1998;35:1–21. doi: 10.1007/s002489900056. [DOI] [PubMed] [Google Scholar]
- 12.Heipieper H-J, Diefenbach R, Keweloh H. Conversion of cis unsaturated fatty acids to trans, a possible mechanism for the protection of phenol-degrading Pseudomonas putida P8 from substrate toxicity. Appl Environ Microbiol. 1992;58:1847–1852. doi: 10.1128/aem.58.6.1847-1852.1992. [DOI] [PMC free article] [PubMed] [Google Scholar]
- 13.Jobson A M, McLaughlin M, Cook F D, Westlake D W S. Effect of amendments on the microbial utilization of oil applied to soil. Appl Microbiol. 1974;27:166–171. doi: 10.1128/am.27.1.166-171.1974. [DOI] [PMC free article] [PubMed] [Google Scholar]
- 14.Jukes T H, Cantor C R. Evolution of protein molecules. In: Munro H N, editor. Mammalian protein metabolism. New York, N.Y: Academic Press; 1969. pp. 21–132. [Google Scholar]
- 15.Kates M. Techniques in lipidology: isolation, analysis and identification of lipids. 2nd ed. Amsterdam, The Netherlands: Elsevier Press; 1986. [Google Scholar]
- 16.Keift T L, Ringelberg D B, White D C. Changes in ester-linked phospholipid fatty acid profiles of subsurface bacteria during starvation and desiccation in a porous medium. Appl Environ Microbiol. 1994;60:3292–3299. doi: 10.1128/aem.60.9.3292-3299.1994. [DOI] [PMC free article] [PubMed] [Google Scholar]
- 17.Kowalchuk G A, Naoumenko Z S, Derikx P J L, Felske A, Stephen J R, Arkhipchenko I A. Molecular analysis of ammonia-oxidizing bacteria of the β subdivision of the class Proteobacteria in compost and composted materials. Appl Environ Microbiol. 1999;65:396–403. doi: 10.1128/aem.65.2.396-403.1999. [DOI] [PMC free article] [PubMed] [Google Scholar]
- 18.Maidak B L, Cole J R, Parker C T, Jr, Garrity G M, Larsen N, Li B, Lilburn T G, McCaughey M J, Olsen G J, Overbeek R, Pramanik S, Schmidt T M, Tiedje J M, Woese C R. A new version of the RDP (Ribosomal Database Project) Nucleic Acids Res. 1999;27:171–173. doi: 10.1093/nar/27.1.171. [DOI] [PMC free article] [PubMed] [Google Scholar]
- 19.Muyzer G, De Waal E C, Uitterlinden A G. Profiling of complex microbial populations by denaturing gradient gel electrophoresis analysis of polymerase chain reaction-amplified genes coding for 16S rRNA. Appl Environ Microbiol. 1993;59:695–700. doi: 10.1128/aem.59.3.695-700.1993. [DOI] [PMC free article] [PubMed] [Google Scholar]
- 20.Olson G J, Lane D J, Giovannoni S J, Pace N R. Microbial ecology and evolution: a ribosomal RNA approach. Annu Rev Microbiol. 1986;40:337–365. doi: 10.1146/annurev.mi.40.100186.002005. [DOI] [PubMed] [Google Scholar]
- 21.Ovreas A, Torsvik V. Microbial diversity and community structure in two different agricultural soil communities. Microb Ecol. 1998;36:303–315. doi: 10.1007/s002489900117. [DOI] [PubMed] [Google Scholar]
- 22.Pace N R, Stahl D A, Lane D J, Olson G J. The analysis of natural microbial populations by ribosomal RNA sequences. Adv Microb Ecol. 1986;9:1–55. [Google Scholar]
- 23.Pinkart H C, Wolfram J W, Rogers R, White D C. Cell envelope changes in solvent-tolerant and solvent-sensitive Pseudomonas putida strains following exposure to O-xylene. Appl Environ Microbiol. 1996;62:1129–1132. doi: 10.1128/aem.62.3.1129-1132.1996. [DOI] [PMC free article] [PubMed] [Google Scholar]
- 24.Rollins D M, Colwell R R. Viable but nonculturable stage of Campylobacter jejuni and its role in survival in the natural aquatic environment. Appl Environ Microbiol. 1986;52:531–538. doi: 10.1128/aem.52.3.531-538.1986. [DOI] [PMC free article] [PubMed] [Google Scholar]
- 25.Rozsak D B, Colwell R R. Survival strategies of bacteria in the natural environment. Microbiol Rev. 1987;51:365–379. doi: 10.1128/mr.51.3.365-379.1987. [DOI] [PMC free article] [PubMed] [Google Scholar]
- 25a.Sequence Match. 1999. posting date. [Online.] Ribosomal Database Project, Michigan State University, East Lansing, Mich. http://www.cme.msu.edu/RDP/analyses.html. [February 1999, last date accessed.]
- 26.Sikkema J, de Bont J A M, Poolman B. Mechanisms of membrane toxicity of hydrocarbons. Microbiol Rev. 1995;59:201–222. doi: 10.1128/mr.59.2.201-222.1995. [DOI] [PMC free article] [PubMed] [Google Scholar]
- 27.Smith G A, Nickels J S, Kerger B D, Davis J D, Collins S P, Wilson J T, McNabb J F, White D C. Quantitative characterization of microbial biomass and community structure in subsurface material: a prokaryotic consortium responsive to organic contamination. Can J Microbiol. 1986;32:104–111. [Google Scholar]
- 28.Stephen J R, Chang Y-J, MacNaughton S J, Whitaker S L, Hicks C L, Leung K T, Flemming C A, White D C. Fate of a metal-resistant inoculum in contaminated and pristine soils assessed by denaturing gradient gel electrophoresis. Environ Toxicol Chem. 1999;18:1118–1123. [Google Scholar]
- 29.Stephen J R, Chang Y-J, Gan Y-D, Peacock A, Pfiffner S M, Barcelona M J, White D C, MacNaughton S J. Microbial characterisation of a JP-4 fuel contaminated site using a combined lipid biomarker/PCR-DGGE based approach. Environ Microbiol. 1999;1:231–243. doi: 10.1046/j.1462-2920.1999.00030.x. [DOI] [PubMed] [Google Scholar]
- 30.Strunk, O., and W. Ludwig. 1997, posting date. [Online.] ARB. Technical University of Munich, Munich, Germany. http://www.mikro.biologie.tu-muenchen.de. [February 1999, last date accessed.]
- 31.Tunlid A, White D C. Biochemical analysis of biomass, community structure, nutritional status and metabolic activity of the microbial community in soil. In: Bollag J M, Stotzky G, editors. Soil biochemistry. Vol. 7. New York, N.Y: Marcel Dekker, Inc.; 1992. pp. 229–262. [Google Scholar]
- 32.van Hannen E J, Zwart G, van Agterveld M P, Gons H J, Ebert J, Laanbroek H J. Changes in bacterial and eukaryotic community structure after mass lysis of filamentous cyanobacteria associated with viruses. Appl Environ Microbiol. 1999;65:795–801. doi: 10.1128/aem.65.2.795-801.1999. [DOI] [PMC free article] [PubMed] [Google Scholar]
- 33.Venosa A D, Suidan M T, Wrenn B A, Strohmeier K L, Haines J R, Eberhart B L, King D, Holder E. Bioremediation of an experimental oil spill on the shoreline of Delaware Bay. Environ Sci Technol. 1996;30:1764–1775. [Google Scholar]
- 34.Venosa A D, Suidan M T, King D, Wrenn B A. Use of hopane as a conservative biomarker for monitoring the bioremediation effectiveness of crude oil contaminating a sandy beach. J Ind Microbiol Biotechnol. 1997;18:131–139. [Google Scholar]
- 35.White D C, Davis W M, Nickels J S, King J D, Bobbie R J. Determination of the sedimentary microbial biomass by extractable lipid phosphate. Oecologia. 1979;40:51–62. doi: 10.1007/BF00388810. [DOI] [PubMed] [Google Scholar]
- 36.White D C, Stair J O, Ringelberg D B. Quantitative comparisons of in situ microbial biodiversity by signature biomarker analysis. J Ind Microbiol. 1996;17:185–196. [Google Scholar]
- 37.White D C, Flemming C A, Leung K T, Macnaughton S J. In situ microbial ecology for quantitative assessment, monitoring and risk assessment of pollution remediation in soils, the subsurface, the rhizosphere and in biofilms. J Microbiol Methods. 1998;32:93–105. [Google Scholar]
- 38.Wilkinson S G. Gram-negative bacteria. In: Ratledge C, Wilkinson S G, editors. Microbial lipids. London, England: Academic Press; 1988. pp. 299–488. [Google Scholar]
- 39.Wrenn B A, Venosa A D. Selective enumeration of aromatic and aliphatic hydrocarbon degrading bacteria by a most-probable-number procedure. Can J Microbiol. 1996;42:252–258. doi: 10.1139/m96-037. [DOI] [PubMed] [Google Scholar]


