Summary:
Innate vocal sounds such as laughing, screaming, or crying convey one’s feelings to others. In many species, including humans, scaling the amplitude and duration of vocalizations is essential for effective social communication1–3. In mice, female scent triggers males to emit innate courtship ultrasonic vocalizations (USVs)4,5. However, whether mice flexibly scale their vocalizations and how neural circuits are structured to generate flexibility remains largely unknown. Here we identify lateral preoptic area neurons expressing estrogen receptor 1 (LPOAEsr1) whose activation elicits the complete repertoire of USV syllables emitted during natural courtship. Neural anatomy and functional data reveal a two-step, di-synaptic, circuit motif where primary long range inhibitory LPOAEsr1 neurons relieve a clamp of local periaqueductal gray (PAG) inhibition, enabling excitatory PAG USV-gating neurons to trigger vocalizations. We find that social context shapes a wide range of USV amplitudes and bout durations. This variability is absent when PAG neurons are directly stimulated; PAG-evoked vocalizations are time-locked to neural activity and stereotypically loud. In contrast, increasing LPOAEsr1 activity scales call amplitude and delaying recovery of the inhibition clamp prolongs USV bouts. Thus, the LPOA disinhibition motif contributes to flexible loudness, bout-duration, and persistence, which are key aspects of effective vocal social communication.
Hypothalamus promotes social USVs
Female odor innately arouses male mice to advertise their desire to mate. Males use both chemical and auditory systems to communicate their enthusiasm and location by releasing pheromones through urine scent marking and emitting social sounds (ultrasonic vocalizations, USVs)5,6. In the lab, USV calling behavior is robust; most tested males produce 40-90kHz USV calls within 2 minutes of exposure to female urine odor (Fig. 1a; SI Video 1). While the neural circuits and mechanisms that regulate vocal learning in birds and humans have been well studied7,8, how innate sounds are generated and modulated by social context is largely unknown. To identify neural correlates of social sounds, we evaluated cFos expression as a proxy of neural activity from males that generated odor-evoked USVs . We focused on the hypothalamus, a region known to promote social and sexual behaviors including ultrasonic vocalizations9–11, and found an increase of cFos in a band from the caudal bed nucleus of the stria terminalis (BNST) through the lateral preoptic area (LPOA), and into the medial preoptic area (MPOA; Extended Data Fig. 1a).
Figure 1. Hypothalamic LPOAEsr1 neurons underly USV social calling.
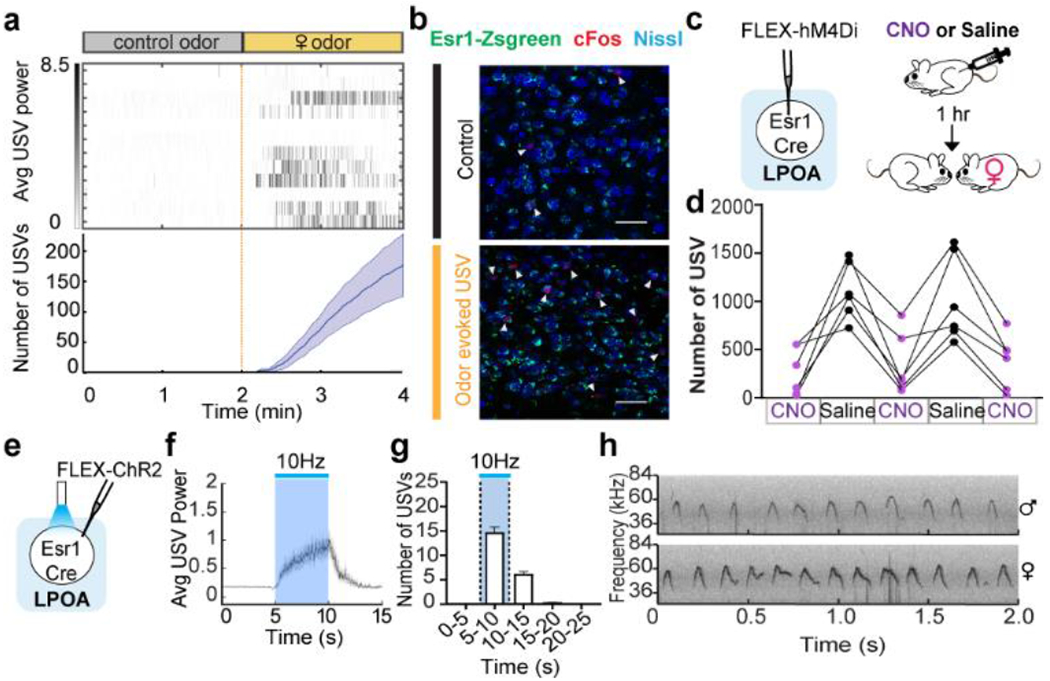
a, top; raster plot and bottom; mean number of USVs emitted by naive males during interaction with tonic water control odor (grey) or with female urine odor (yellow). Mean ± s.e.m. N=12 animals. b, expression of cFos and Esr1 in LPOA following awake behavior with control odor (black) or female odor (yellow). Scale bar = 50μm. c, experimental design for LPOAEsr1 chemoinhibition experiment. d, number of USVs in presence of behaving female after male received either CNO or saline on alternate days over 5 test days. N=6 animals. e-h, LPOAEsr1/ChR2 neurons evoke USVs. e) ChR2 virus injection in LPOA region of Esr1-Cre mice. f) average USV power evoked by 5s, 15ms, 10Hz photostimulation of LPOAEsr1/ChR2 animals. Solid line indicates mean of all trials; shaded region indicates 95% confidence interval. g) number of USVs detected during photostimulation of LPOAEsr1+ cells. Mean ± s.e.m. (both sex, N=34 animals). h) sample USV sonograms evoked during photostimulation of male or female mice.
Neurons in the hypothalamus are molecularly and functionally heterogeneous12,13. We took a candidate marker approach to identify a subset of neurons that elicit social calls. 80% of cFos+ cells overlap with estrogen receptor 1 expressing LPOA neurons (LPOAEsr1; Fig. 1b; Extended Data Fig. 1b–d). We investigated the in vivo temporal correlation between neural activity and USV sounds during natural social behavior using a reporter of calcium influx, GCaMP6s, expressed in the LPOA of Esr1-Cre males (LPOAEsr1/GCaMP). Indeed, socially-evoked USVs correlated with an increase in LPOAEsr1/GCaMP6s fluorescence measured by fiber photometry (Extended Data Fig. 2a–f). To study whether the LPOAEsr1 neurons mediate natural male courtship vocalizations, we restricted the expression of hM4Di specifically to the LPOAEsr1 neurons and performed CNO-meditated inhibition in the presence of an awake, freely behaving female to evoke his social behavior (Fig. 1c–d). All CNO-injected LPOAEsr1/hM4Di males emitted fewer USVs, consistent with participation of Esr1-expressing subset of LPOA neurons in promoting USV production (Fig. 1c–d, Extended Data Fig. 2g–o). CNO-inhibition of LPOAEsr1/hM4Di neurons did not alter other features of male courtship or sensation of the female, such as sniffing and mounting (Extended Data Fig. 2l).
We additionally investigated the sufficiency of the LPOAEsr1+ subset in USV production by expressing channelrhodopsin (ChR2) in the LPOA of Esr1-Cre mice (LPOAEsr1/ChR2). Photostimulation activated LPOAEsr1/ChR2 neurons (Fig. 1e, Extended Data Fig. 3a–b) and evoked USV calling in both males and females in the absence of any sensory stimulation (Fig. 1f–h, Extended Data Fig. 3c–g, SI Video 2)14. To investigate the repertoire of male photoactivated USVs, we used an automated and unsupervised signal processing approach (MUPET15) to evaluate their composition compared to natural calls produced by males in response to a variety of social stimuli as well as infant pup calls. Photostimulation of LPOAEsr1/ChR2 did not simply produce repetitive stuttering of USV syllables. Instead, it evoked a rich repertoire of both simple and complex USV syllables, like those displayed during natural social interactions (Extended Data Fig. 4). These findings indicate that LPOAEsr1 neurons can trigger a suite of USV syllables matching a natural range of USVs and provide a cellular handle to study the circuits and mechanisms that underlie the generation of innate social sounds.
Mouse USV production is known to depend on neurons in the PAG that gate the activity of motor neurons in the nucleus ambiguus16,17 (Amb). We performed anatomic tracing and functional manipulation to determine whether the LPOAEsr1 neurons promote USV calling through either of these known nodes (Extended Data Fig. 5a–f). Directly stimulating the sparse terminals in the Amb failed to elicit USVs, but photoactivation of LPOAEsr1 to PAG terminals triggered robust USV calling in both males and females, similar to that observed from LPOAEsr1 soma stimulation (Fig. 2a–b; Extended Data Fig. 5g–m). These data demonstrate that LPOAEsr1 neurons provide an anatomical and functional route that link social behavior-promoting centers to the established PAG-gate neurons to trigger vocalizations.
Figure 2. LPOAvGat -> PAGvGat -> PAGvGluT2 di-synaptic disinhibition circuit triggers USVs.
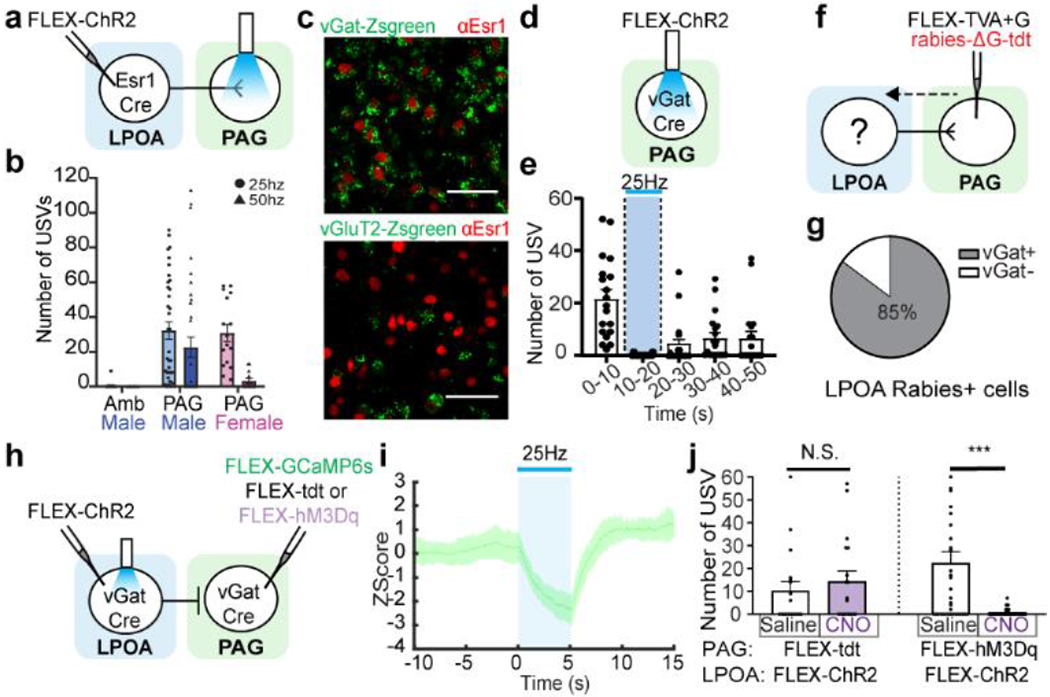
a-b, LPOAEsr1/ChR2 axon terminal photostimulation in the PAG evokes USV calls. a) experimental design, b) number of USVs detected in the Amb (Males, N=5 animals) and the PAG (Males N=13 animals, Females N=4 animals) Mean ± s.e.m. c, sample images of LPOAEsr1+ co-expression with vGat-Zsgreen (upper, N=4 animals, 3 sections/animal counted) and vGluT2-Zsgreen (lower, N=3 animals, 3 sections/animal counted). Scale bar = 50μm. d-e, photostimulation (blue bar) of male inhibitory PAGvGat/ChR2 neurons during social interaction with an awake female blocks natural USVs. d) experimental design to express ChR2 in local inhibitory PAG neurons and e) quantification of evoked USV syllables. Mean ± s.e.m. N=3 animals, 19 trials. f, experimental design to assess direct anatomy to LPOA by retrograde tracing from PAGvGat cells. g, percentage of tdt expression (rabies) in LPOA vGat+ cells. N=3 animals, 320 cells counted. h, experimental design to express ChR2 in LPOAvGat and GCaMP6s or tdt or hM3Dq in PAGvGat. i, mean z-score of fiber photometry signal from PAGvGat/GCaMP with 25Hz photostimulation (blue bar) on LPOAvGat/ChR2 cells. Solid line indicates mean of all trials; shaded region indicates 95% confidence interval. N=4 animals, 4 trials/animal. j, USVs are silenced during LPOAvGat/ChR2 photostimulation and PAGvGat/hM3Dq CNO. Mean ± s.e.m. N=3 animals, 36 trials (hM3Dq), 18 trials (tdt control). Paired Wilcoxon test, two sided, ***=0.005.
Disinhibition motif triggers USV calling
PAG USV-gate neurons are known to be excitatory (PAGvGluT2)17 and we observed that activation of LPOAEsr1 neurons produces USV calling (Fig. 1e–h). Therefore, feedforward excitation would be the simplest circuit arrangement through which LPOAEsr1 neurons could drive vocalizations. Instead, multiplex fluorescent in situ hybridization and immunohistochemistry of Esr1 in vGat-Ai6 (N=3, 10340 cells quantified) or vGluT2-Ai6 mice (N=4, 11082 cells quantified) revealed that the ratio of LPOAEsr1/vGat to LPOAEsr1/vGluT2 is five to one, (Fig. 2c, Extended Data Fig. 6a–c). Ex vivo cell-attached recordings of lPAG cells during photostimulation of LPOAEsr1/ChR2 terminals confirmed that some LPOAEsr1/ChR2 neurons are functionally inhibitory; and whole-cell voltage-clamp recordings of the PAG cells revealed inhibitory action on PAG cells from photostimulated LPOAEsr1/ChR2 neurons, with inhibitory postsynaptic currents (IPSCs) locked with light pulses consistent with monosynaptic arrangement (Extended Data Fig. 6d–g). To compare the functional relevance of both the LPOA excitatory and inhibitory PAG projections, we expressed ChR2 in the LPOA of either vGat-Cre (LPOAvGat/ChR2) or vGluT2-Cre (LPOAvGluT2/ChR2) mice. Photoactivation of LPOAvGluT2/ChR2 neurons failed to produce any vocal sounds (Extended Data Fig. 6h–j). In contrast, photostimulation of LPOAvGat/ChR2 neurons was sufficient to elicit USV calling (Extended Data Fig. 6k–l). Together, these results identify the subset of LPOAEsr1 neurons that facilitate USV social calling as long-range inhibitory neurons.
Instead of eliciting USV calling through direct feedforward excitation, these long-range inhibitory LPOAEsr1 neurons may trigger behavior by relieving the PAG USV-gate neurons from local inhibition. In addition to excitatory USV-gate neurons in the lateral PAG17, there are clusters of local inhibitory neurons in the ventral lateral PAG (PAGvGat, Extended Data Fig. 6m)18,19. Indeed, circuit tracing and functional Ex vivo recordings were consistent with monosynaptic inhibitory connections between the local PAGvGat neurons and the PAGvGluT2 USV-gate cells (Extended Data Fig. 7a–h). PAGvGat/ChR2 males naturally initiated USV calling while freely behaving with females, however, driving the local inhibitory activity with light stimulation of PAGvGat/ChR2 at 1 or 5Hz reduced the number of socially evoked USV calls, and at 10Hz (or higher) immediately halted female odor-evoked USV emission (Fig. 2d–e; Extended Data Fig. 7i–j. These experiments indicate that the PAG-USV gate neurons are under a direct clamp of local inhibition produced by PAGvGat neurons.
We next investigated whether the LPOAEsr1 cells trigger calling by relieving this local PAG inhibition. Conditional retrograde tracing from the local PAG inhibitory neurons (PAGvGat) and multiplex fluorescent in situ hybridization (Fig. 2f–g, Extended Data Fig. 8a–c) confirmed the anatomy of the circuit while Ex vivo whole-cell recording of PAGvGat cells following light stimulation of LPOAvGat/ChR2 terminals and photostimulation of the LPOA with fiber-photometry in the PAG of vGat-Cre mice functionally supported this inhibition circuit (LPOAvGat/ChR2;PAGvGat/GCaMP6s, Fig. 2h–i, Extended Data Fig. 8d–h). To further validate whether the flow of information is consistent with LPOA driven disinhibition, we designed an experimental paradigm in vGat-Cre individuals that combines optogenetic activation of the LPOA (to trigger USVs) while artificially strengthening the local PAG inhibitory signals with chemogenetic activation (Fig. 2h). CNO-mediated activation of PAGvGat neurons completely blocked LPOA photostimulated USV calls even with LPOAvGat/ChR2 stimulation as high as 50Hz (Fig. 2j). Thus, activating the inhibitory LPOAEsr1 neurons inhibits the clamp of local inhibition from the PAGvGat cells which enables excitatory activity of the Amb-projecting USV-gate PAG neurons to trigger USVs (Fig. 4h, top)11,19.
Figure 4. Vocal persistence is generated through activity of local PAGvGat neurons.
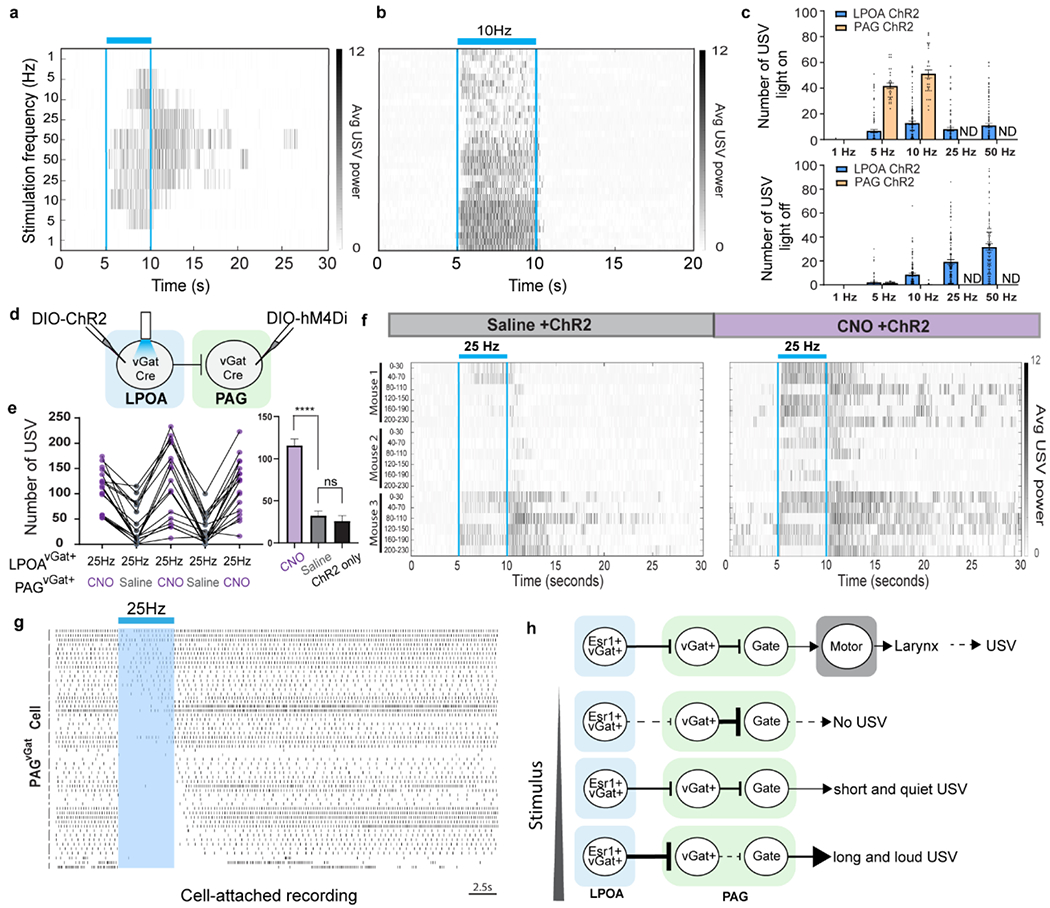
a, representative USVs emitted during scaling (ascending/descending frequency) of photostimulation in LPOAEsr1/ChR2 male demonstrate USVs persist after photostimulation ceases (blue bar). b, raster plot of USV syllables emitted during 10Hz photostimulation of PAGvGluT2/ChR2 neurons. USVs are locked to light stimulus (blue bars). Each row is a single trial. N=3 animals. 32 trials total. c, Number of syllables from photostimulation of either LPOAEsr1/ChR2 (blue, N=26 animals, 102 trials) or PAGvGluT2/ChR2 neurons (orange, N=3 animals, 32 trials) during light on (top) or light off (bottom). ND = not done. d, experimental design to simultaneously express ChR2 in LPOAvGat and hM4Di in PAGvGat cells. e-f, USVs emitted during optostimulation of LPOAvGAT/ChR2/PAGvGat/hM4Di following injection of saline (grey) or CNO (purple) on alternate days. USV number during e) 25Hz stimulation. f) raster plot of USVs emitted during and following photostimulation (blue bars). Each row is 30” of a 230” trial aligned to light stimuli applied every 40”. Mean ± s.e.m. N=3, 6 trials/animal per test day. Paired Wilcoxon test, two sided, ****p<0.0001. ns: p>0.05. g, Ex vivo cell-attached recording of PAGvGat neurons during photostimulating (blue shading) of LPOAvGat/ChR2 axon terminals. N=4 animals, total 23 cells. Left bars group the same cell during multiple trials. h, model of disinhibition circuitry for USV calling. LPOA disinhibition to scale USV power and bout duration enables flexible response to social/sensory context.
Context scales natural USVs
Circuits underlying complex innate behaviors such as parenting and fear also include a two-step di-synaptic disinhibition motif to activate the PAG, but how this motif contributes to behavioral actions remain unknown18,19. Our simple behavior enables us to study how circuit and cellular properties of the LPOA and PAG contribute to features of USV production. Mouse USVs are often analyzed for the identity and arrangement of syllables as these are critical features in learned human language and birdsong4,7,8,16,20,21. Although syllable type is critical for language, innate social sounds are effective because they scale a simple noise from soft and few to loud and many (a giggle compared to hearty laughter)2,22. Such vocal flexibility effectively transmits one’s internal state to others1–3. Whether the amplitude and duration of mouse USVs are fixed or can flexibly scale during social and sensory-evoked behavior remains largely unstudied23. We developed improved automated methods to reliably detect USV sounds during noisy natural behavior (Extended Data Fig. 9a) and used this approach to measure USVs from males freely behaving with a variety of relevant social stimuli22.
The sensation of behaving females or female odor reliably evokes males to produce abundant, short-latency, low inter-syllable interval USV syllables while males or male odor evoked fewer USVs that were produced unreliably (Fig. 3a; Extended Data Fig. 8i–k)5,23–25. We next analyzed syllable organization. Syllables are minimally separated by a single breath4,23,26, grouped in phrases or strings of syllables called bouts (Fig. 1h, Extended Data Fig. 9b). We observed bout length to flexibly adapt to social context. Awake females and female odor sensation promoted males to generate longer USV-bouts (averaging 7-10 secs) that were on average 50% louder than shorter USV-bouts (averaging 1-2 secs) evoked by anesthetized females and male cues (Fig. 3b–d). Within a social context, bout length also varied dynamically. Males emitted USV-bouts as short as several syllables and as long as 17 seconds in the presence of awake behaving females and USV loudness in single USV bouts were produced over a 5-fold range in amplitude (Fig. 3b–d). Overall, mouse USV syllable numbers, amplitude, and bout duration are naturally plastic, scalable, and flexibly displayed depending on the identity of the environment or reliability of social context.
Figure 3. LPOAEsr1 activity scales USV amplitude and bout-duration.
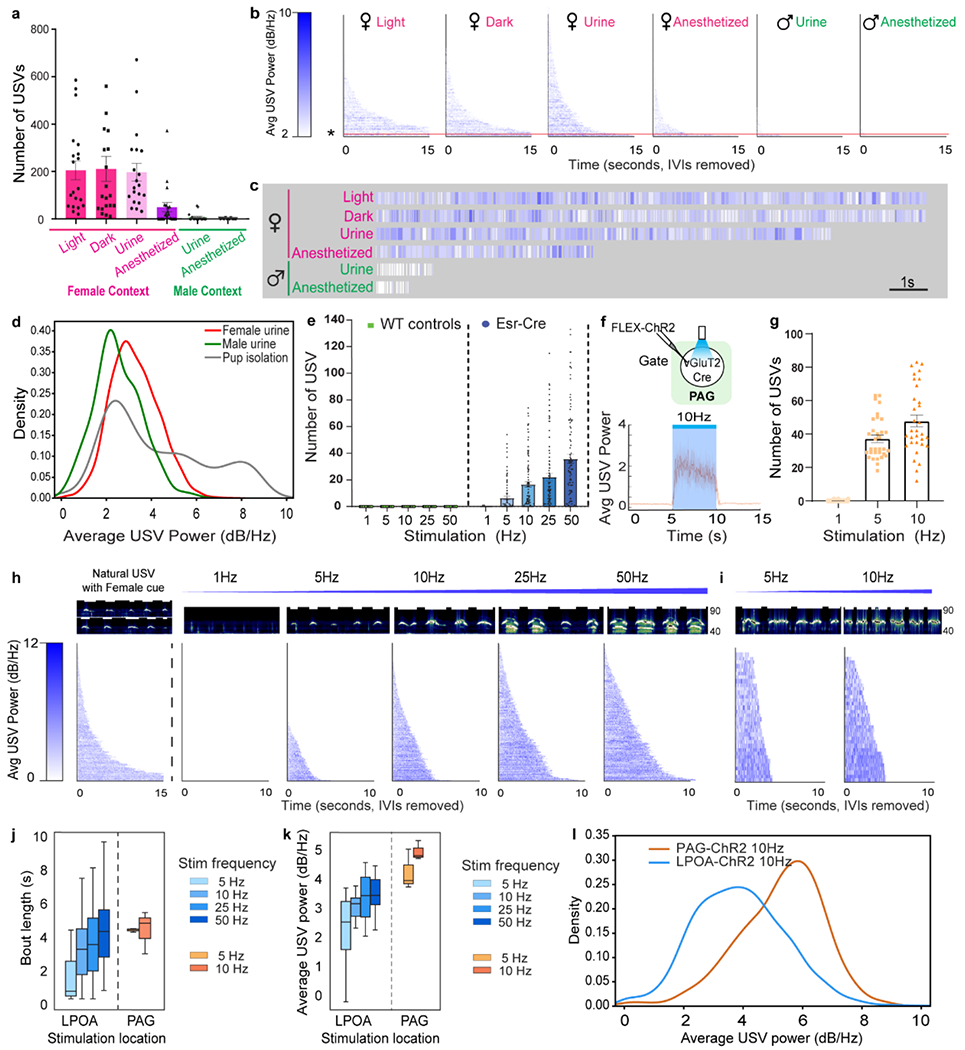
a-c, wildtype males flexibly adjust USV syllable number, amplitude, and bout-length within and across sensory/social contexts. a) Number of USVs produced. b) raster plot of USV bout-length (strings of syllables separated by >2” pauses) emitted by wild-type males in different sensory/social contexts sorted by bout-length. c) high resolution of single USV bouts (* and orange line in panel b showing variable bout-length and amplitude (heat map in b) emitted by wildtype males during sensory/social interaction. Red: female sensation, green: male sensation. Mean ± s.e.m. N=20 mice. d, distribution of mean USV power produced by males exposed to either male or female urine, and by pups isolated from the nest. e, increasing frequency of photostimulation of LPOAEsr1+/ChR2 neurons scales number of USV syllables. Mean ± s.e.m. N=5 for control, N=23 for ChR2. f, upper; experimental design to express ChR2 in PAG of vGluT2-cre mice. Lower; average USV power during photostimulation of PAGvGluT2/ChR2 neurons. g, number of USV syllables emitted during photostimulation of PAGvGluT2/ChR2 neurons. Mean ± s.e.m. N=3 animals, 32 trials. h, representative sonograms (upper) and raster plot of USV amplitude and bout-lengths (lower) emitted by LPOAEsr1/ChR2 males interacting with left, female odor or live female to evoke natural USVs; and right, in absence of female with increasing frequency of 5 second light stimulation. N=26 animals, sorted by bout-length. Sonograms occur in the range of 40-90kHz. i, representative sonograms (upper) and raster plot of USV amplitude and bout-lengths (lower) emitted during 5 or 10Hz, 5 second photostimulation of PAGvGluT2/ChR2 neurons. N=3 animals. j, average USV bout length and k, average amplitude of USV during photostimulation of either LPOAEsr1/ChR2 (N=26 animals) or PAGvGluT2/ChR2 neurons (N=3 animals).Box plot: min-max, 5%-95% percentile. l, distribution of mean USV power during 10Hz photostimulation in either PAGvGluT2/ChR2 or LPOAEsr1/ChR2.
LPOA expands range of USV scaling
To investigate if the ability to scale USV amplitude and bout duration arises in the identified circuit, we varied the frequency of photostimulation in PAGvGluT2/ChR2 or LPOAEsr1/ChR2 males in the absence of female odor, quantified the number of USV syllables, and compared these artificially-evoked USVs to natural male calls evoked by social stimuli. Increasing the frequency or the duration of LPOAEsr1/ChR2 photostimulation scaled syllable production from unreliably few and quiet (5Hz) to robust and loud (50Hz) (Figs. 3e,h; 4.a,c; Extended Data Figs. 9c–d). Notably, even with increasing stimulation frequency the structure of distinct syllables remained intact without distortion (Extended Data Fig. 9d–e). 5Hz photostimulation of PAGvGluT2/ChR2 neurons produced reliable, robust USVs of relatively high amplitude and fixed bout duration (Figs. 3f–g,i–k; 4b–c). Low photostimulation (5Hz) of the PAGVGluT2/ChR2 neurons generated USV-bouts that were four-fold longer and 2-fold louder than those observed from the LPOA at 5Hz (Figs. 3j–l). The PAG and the LPOA contribute different features to USV behavior. PAGvGluT2/ChR2 neurons are less flexible, and display a steep, low threshold that produces many loud syllables and long bouts, while the LPOAEsr1/ChR2 neurons respond with a gradual, higher threshold capable of flexibly reducing the amplitude and bout-length (Fig. 3j–l). Together we found that the PAG USV-gate neurons are poised to generate exuberant USV calls and the di-synaptic inhibition flexibly expands the dynamic range of bout length and amplitude.
Circuit motif enables persistent USVs
Another feature of effective social vocal sounds is the ability to persist beyond immediate sensory initiation. For example, a poor joke may evoke a brief giggle, while a clever one evokes laughter that lasts beyond the punchline. We observed that LPOAEsr1/ChR2 neurons produced calls that persist beyond the end of photostimulation (Figs. 1f–g). Low frequency (5Hz) photostimulation of LPOAEsr1/ChR2 neurons produced calls largely locked to the presence of light while increasing photostimulation frequency increased the persistence of emitted USVs many seconds beyond the termination of light (Fig. 4a,c). In contrast, USV-calling mediated by activation of the PAGVGluT2/ChR2 USV-gate cells reliably produced USVs tightly locked to photostimulation onset and termination (Fig. 3f; 4b,c). USVs evoked by the PAG (and downstream nodes) tightly mirrors incoming circuit activity, while the LPOA to PAG disinhibition nodes flexibly extends bout duration beyond LPOA activation.
To further investigate the effect of local PAGvGat cells on USV persistence, we used chemogenetics to release the inhibitory clamp on the PAG USV-gate neurons while stimulating USV calls from the LPOA through optogenetics (Fig. 4d, Extended Data Fig. 10c, e). Silencing the local PAGvGat/hM4Di neurons lowered the LPOAvGat/ChR2 photostimulation threshold of USV calling to as low as 1Hz (Extended Data Fig. 10a–f; SI Video 3). Moreover, 50Hz stimulation of LPOAvGat/ChR2 in the presence of CNO produced extreme prolonged calling that lasted up to 35 seconds beyond cessation of the photostimulation (Fig. 4e–f; SI Video 3). This prolonged calling effect which increased syllable number and bout length scaled across the stimulation frequency range (1-25Hz) (Extended Data Fig. 10d, f–g). Cell-attached recordings in a slice preparation from labeled PAGvGat neurons during photostimulation of LPOAvGat/ChR2 immediately inhibits the spontaneous firing of most PAGvGat neurons, however the recovery of spiking was quite variable and asynchronous27–29 (Fig. 4g). In some cells, this delay to recover inhibitory tone persisted for seconds after photostimulation ended (Fig. 4g) and provides a potential cellular mechanism to support the persistent USV calling behavior that continues after the offset of LPOA photostimulation in vivo (Fig. 4a,f). Such a feature would be useful for a male mouse to maintain vocal communication of his desire to mate beyond his immediate sensation of a female, such as when she leaves his view, or he loses her odor trail.
The di-synaptic disinhibition between the LPOA and PAG does not simply act as a relay switch transmitting sensory information to motor centers. Instead, we find the PAG USV-gate neurons are kept inactive under a clamp of local PAG inhibition while poised at low threshold to drive robust USV calling. The escalating activity of LPOAEsr1 neurons induces disinhibition that enables scaling of USV amplitude from quiet to loud, with the intrinsic extended recovery of the PAGvGat inhibition prolonging USV bouts (Fig. 4h). These circuit-level features enable vocalizations to persist and calling to continue beyond direct initiation by sensory stimulation. The addition of this LPOA node and disinhibition motif upstream of the PAG USV-gate neurons circuit provides a biological solution for generating the flexible vocal loudness, bout-duration, and persistence; critical features to effectively communicate the sender’s level of affect and arousal to the listener.
Methods:
Animals
All animal procedures were conducted in accordance with institutional guidelines and protocols approved by the Institutional Animal Care and Use Committee at Scripps Research. BALB/cByJ male mice were group housed at weaning, single housed at 8 weeks old for at least one week before any testing and maintained on a 12/12hr light/dark cycle with food and water available ad libitum in a controlled environment ( median temperature 70 degree, humidity 50%). For functional manipulation, females and males from mouse lines are purchased from The Jackson Laboratory: Esr1-Cre (stock #: 017911), vGat-Cre (stock #: 016962), vGluT2-Cre (stock #: 016963), and ROSA-LSL-ZsGreen (Ai6, stock #: 007906). All mice were backcrossed into the BALB/cByJ background for >5 generations except for the ROSA-LSL-Zsgreen line. Surgeries were performed between 2-6 months old and animals were given 2-3 weeks for recovery before behavioral testing that last for 2-5 weeks.
USV recording
Adult male USV response to female urine (Fig. 1a).
Adult BALB/cByJ males were habituated to USV assay arena for three days prior to testing under red light with control odor (50μl tonic water). Test arena is a modified home cage with bottom removed and placed inside a larger arena with a glass bottom to also monitor female urine evoked male urine marking behavior. On test day, behavior is recorded while subject freely interacts with control odor for two minutes, then 50μl female urine (collection described below) is added to the chamber and behavior is recorded for another two minutes. Individuals are then returned to homecage. Behavior is recorded with a wide-angle camera (Logitech C930e) capture video at 15 frames per second, 640x360 pixel resolution and USVs were recorded using a USB microphone (Dodotronic Ultramic250K) both mounted on a customized cage lid. Analog pulse-controlled LEDs in camera field of view was used to synchronize camera with audio recording. Videos frames were recorded using Adobe After Effects and synched with USV emission using custom MATLAB software. Data was acquired at 196 kHz using SeaWave software and synchronized to video streams with a 4.1 kHz tone (RadioShack Piezo Buzzer, 273-0074) driven by the same analog pulse used for video synchronization LEDs. Analysis was performed in MATLAB using a modified protocol of Holy and Gao4. USV power was calculated as acoustic power in the 40–90 kHz band.
Context/sensory stimuli to evoke USVs (adapted from Chabout et al)30:
All behavior was performed in subject’s (male) homecage.
Female urine:
Adult (8-16 weeks) C57BL/6j female mice were housed 5 per cage, soiled male bedding was introduced into the cage 24 hours before the first collection night to induce estrous. The females were placed in metabolic cage for 12-16 hours overnight, and urine was collected directly into a sterile tube on dry ice and temporarily stored at −20°C in the morning. and. After four consecutive nights of collection, urine was thawed on ice, rapidly passed through a 0.22um filter (Millipore Steriflip SCGP00525), from four cages (20 mice total) over 4 days such that the stimulus consisted of a mix from all stages of the estrous cycle and aliquoted to store at −80°C. Two different batches of urine were collected for all experiments, and each was used with both control and experimental groups. 100μl urine was placed on a cotton ball and presented to target male for two minutes.
Male urine:
Adult (8-16 week) C57BL/6j males pair housed prior to collection. Urine was collected as described for females. Urine was pooled from a total of 8 mice. 100μl urine was placed on a cotton ball and presented to target male for two minutes.
Awake Female:
Adult (8-16 weeks) BALB/cByJ female mice were group housed. Individual female was removed from home cage and was introduced to the male resident’s home cage. After recording, the female was temporarily held in a clean cage until all cage mates were assayed. Each female interacted with a single male once on daily bases. Following each assay, all females were returned to their home cage and provided sunflower seeds.
Anesthetized female/male:
Wildtype C57Bl/6j mice were sedated with ketamine (10mg/ml, Butler Schein) diluted to final concentration of 62.5mg/ml in sterile saline and Xylazine (20mg/ml, AnaSed Injection) to a final concentration of 6.25mg/ml, stored at 4C⁰ for up to two days. 1.6ul/mg body weight diluted Katamine/Xylazine mixture was administered intramuscularly. Anesthetized female/male was monitored for breath rate and placed on a heating pad before and after testing. Individuals were used in up to four trials then placed in a holding cage. Following recovery, individuals were returned to their home cage and provided with sunflower seeds.
Pup USV recording:
An individual pup, p7-p8 was removed from their home cage31 and put in the USV assay arena describe above for five minutes while video behavior and audio emissions were recorded as described above. Pup was returned to a holding cage with heating pad following individual recordings. After all pups from the same cage were tested, they were returned to their home cage.
General surgical procedures
Mice were anesthetized with isoflurane (5% induction, 1-2% maintenance, Kent Scientific SomnoSuite) and placed in a stereotaxic frame (David Kopf Instruments Model 962). Ophthalmic ointment (Puralube) was applied, buprenorphine (Buprenex, 0.15mg/kg) was administered intramuscularly at the beginning of the procedure, and 500uL sterile saline containing carprofen (Rimadyl, 5mg/kg) and enrofloxacin (Baytril, 5mg/kg) was administered subcutaneously at the end of the procedure. Mice were monitored daily and given at least 14 days for recovery and viral expression before subsequent behavioral testing.
Viral injection/Fiber optic implantation
Viral injections were made using pulled glass pipettes (tips broken for ID = 10-20 um) and a Picospritzer at 35 – 75 nL/min. For LPOA injections, medial-lateral angle of 20° was used to avoid the ventricle. The pipette entry coordinate relative to bregma was 0.1mm caudal, 2.5mm lateral, and 4.3mm diagonally below the dura. AAVs were injected 200-350nL per side, and the pipette was left in place for five minutes after injection before slowly retracting. For PAG vGat site injections, the pipette entry coordinate relative to bregma was 4.3 caudal, 0.65 lateral and 2.1mm below dura. For PAG vGluT2 (PAG USV-gate neurons) site injections, the pipette entry coordinate relative to bregma was 4.5 caudal, 0.8 lateral and 2.0 mm below dura. For photostimulation, fiber optic implants (4 mm length for PAG and 6mm length for LPOA, Plexon 230 µm diameter for ChR2) were inserted along the pipette track as above, 300 µm above the injection site for ChR2. For fiber photometry implants, 2.5mm diameter metal ferrule optical cannulas (6mm fiber length for LPOA and 3mm length for PAG, MFC_400/430-0.48_MF2.5_FLT Doric lens) were inserted along the pipette track as above, 100 µm above the viral injection site. After injection/implantation, the skull was covered with Metabond (C&B Metabond) and super glue to seal the craniotomy and hold the implants in place.
AAV Viral vectors
For ChR2 activation, AAV9-CAG-FLEX-ChR2-tdTomato (UPenn AV-9-18917P) was injected bilaterally at 3.5x10¹² GC/mL in Esr1-Cre/vGat-Cre/vGluT2-cre animals at LPOA cite or unilaterally injected to vGluT2-Cre animals at PAG site. For photostimulation controls, same virus was injected bilaterally in Esr1-Cre wildtype litter mates at LPOA site. For DREADD inhibition in wildtype mice, AAVdj-CAG-FLEX-hM4Di-GFP (Addgene plasmid # 52536, a gift from Scott Sternson) mixed with AAVdj/1-EF1α-FLEX-hM4Di-mCherry (Addgene plasmid # 50461, a gift from Bryan Roth) and AAV9-CRE (UPenn AV-9-PV1090) injected bilaterally at 4x10¹² GC/mL in LPOA. For DREADD inhibition in Esr1-Cre mice, AAVdj/1-EF1α-FLEX-hM4Di-mCherry (Addgene plasmid # 50461, a gift from Bryan Roth) was injected to Esr1-Cre animals and as control, AAV1-CAG-DIO-tdTomato (UPenn, AV-1-ALL864) was injected to either Esr1-Cre or wildtype cage mates bilaterally at LPOA site. For co-injection with ChR2, only AAVdj/1-EF1α-FLEX-hM4Di-mCherry was injected at PAG in vGat-Cre mice. For activation of PAGvGat cells, AAV-hSyn-DIO-hM3Dq-mcherry (Addgene #44361, a gift from Byungkook Lim) was injected bilaterally to PAG in vGat-Cre mice. As control, AAV1-CAG-DIO-tdTomato (UPenn, AV-1-ALL864) was injected in vGat-Cre mice. For anatomy tracing, RG-EIAV-CAG-DIO-Flp (a gift from Byungkook Lim) was injected unilaterally in Esr1-Cre animals at PAG site while AAV-EF1α -fDIO-eGFP was injected to LPOA. For labelling Amb projecting PAG-USV cells, AAV-retro-hSyn-eGFP (a gift from Byungkook Lim) was injected in Amb at 4x10¹² GC/mL. For fiber photometry, AAV1-CAG-DIO-GCaMP6s (UPenn, AV-1-PV2818) was mixed with AAV9-CAG-DIO-GCaMP6s (UPenn, AV-9-PV2818) and diluted to 5x10¹² GC/mL, then mixed virus was injected bilaterally into LPOA site in Esr1-Cre mice. For co-injection with ChR2, same virus was injected to PAG site unilaterally in vGat-Cre mice.
ChR2 stimulation
For photostimulation experiments, fiber-implanted mice were handled gently by hand to connect and disconnect patch cables (Plexon 0.5 m, 230 um 68 diameter). An LED current source (Mightex BLS-SA02-US) driving two 465 nm PlexBright Compact LED Modules (Plexon) through a Dual LED Commutator (Plexon) provided 8±1 mW exiting the fiber tips. Optical power was measured (ThorLabs PM20A) before and after each session. Mice were placed in the recording box (identical to home cage with bottom removed6). For dose response curve (Fig. 3h, 4a), photostimulation occurred for five seconds duration using 15ms pulses at five different frequencies: 1, 5, 10, 25, 50, 50, 25, 10, 5 ,1 Hz for test day 1 and 50,25,10,5,1,1,5,10,25,50 Hz for test day 2. At least 40s elapsed between different photostimulation frequency, with delays occasionally occurring when animal reared toward cage top, to avoid variabilities of sound amplitude. 40s was based on pilot experiments to determine maximum USV bout length following USVs emitted after a single stimulation. For time dose testing, animals are given 25 and 50Hz, 15ms pulses for 1s, 5s, 10s and 20s duration with at least 1 minute between stimulation. Additionally, 12 mice that were bilaterally infected in the LPOAEsr1 with ChR2 virus were tested for unilateral/bilateral stimulation comparison with all test conditions. Same dose curve and time dose curve stimulation parameter was used to test left and right side separately (no quantitative difference was found so these animals were pooled for the final analysis). For optogenetic stimulation on PAGvGLuT2 cells, dose curve starts with 1Hz and stopped at 10Hz because at greater stimulation frequencies, these individuals demonstrated additional ballistic movement behaviors as previously described17. At stimulation frequencies starting with 25Hz, we also observed that mice displayed tail rattling as well as freezing behavior. Time of stimulation was manually recorded by playback of videos using Adobe After Effects and USV recording subsequently analyzed using custom MATLAB software. USV audio files were de-noised and number of USVs calculated using MATLAB script that was based on previous study4. Inter USV interval was calculated based on difference of time points of each syllable detection by MATLAB code. After all experiments, mice were perfused and analyzed for viral expression and fiber placement and immunohistochemistry. Mice that did not have more than 3 syllables emitted under any ChR2 stimulation conditions are excluded from this study (3 out of 26 for LPOA ChR2 stimulation and 3 out of 6 for PAG vGluT2 ChR2 stimulation). For photostimulation in vGat-Cre mice at the LPOA site, the same photostimulation parameter was used. However, we have observed a delayed USV emission compare to photostimulation in Esr1-Cre mice. In some cases, the USV emission started locked to the end of light stimulation, especially during strong stimulation conditions (25Hz, 50Hz).
Rabies tracing32,33
Helper virus (AAV-EF1α-DIO-mRuby2-TVA and AAV-EF1α-DIO-oPBG, a gift from Byungkook Lim) was mixed as 1:1 ratio and injected into PAG in either vGat-Zsgreen or vGluT2-Zsgreen mice. After 2 weeks of expression, EnvA-RVΔG-tdTomato (a gift from Byungkook Lim) was injected in the same injection site. For RNAScope multiplex in situ hybridization experiment, EnvA-RVΔG-eGFP (a gift from Byungkook Lim) was injected in PAG using vGat-Cre mice. Mice are perfused 5 days after rabies virus injection and brain sections are processed for imaging.
DREADD inhibition/activation
After hM4Di/hM3Dq viral injection, mice were allowed at least 21 days for recovery and expression, and then intraperitoneally injected 50-60 minutes before testing with either control saline plus 0.5% DMSO, or Clozapine N-oxide (CNO, 5mg/kg, Enzo Life Sciences BML-NS105-0025) in saline plus 0.5% DMSO. For wildtype mice or Esr1-Cre mice with hM4Di injections in LPOA, control saline injections and CNO injections were performed on alternative days before female urine was given. Day 1-5 individuals received; day 1 = CNO, day 2 = saline, day 3 = CNO, day 4 = saline, day 5=CNO injection 45-55 minutes prior to behavior testing. In test animals’ home cage, two minutes of background USVs were recorded, a female was introduced to the male’s home cage for four minutes, subsequently female were returned to her home cage. For combining ChR2 stimulation with DREADD inhibition/activation experiment, subjects were first tested for ChR2 stimulation alone following our protocol (above, ChR2 stimulation section). Two days later, each mouse was tested for ChR2 stimulation 45-55 minutes following an intraperitoneal injection of CNO or saline; day1= CNO, day2 = saline, day 3= CNO, day 4= Saline, day 5= CNO. Number of USVs were counted through a MATLAB script written in house.
Social behavior scoring
To male social response to a behaving female (Extended Data Fig. 2i), an unbiased blinded individual scored animal behavior by playback of the videos recorded from the side of test cages. The following behaviors were scored by seconds for 4 mins after first exposure to a live female and was reported in an excel sheet: sniff the female (any part except for anogenital region; Anogenital sniff (male’s nose in female anogenital region); Mount attempt (male on top of female); Female aggressive behavior (typified by female sitting upright or audible vocalizations; Eating; Self grooming; Freezing. Animals’ total amount of time on each behavior was calculated between test conditions.
Fiber Photometry
Animals recovered from surgery for at least three weeks before testing. Bulk GCaMP signals (470nm excitation) as well as the isosbestic control channel (405nm excitation) were collected at 20Hz in alternation as previously described34. Signals were recorded using the MATLAB GUI developed by the Deisseroth lab34. A pulse was sent to an LED light by the data acquisition board with the start of the GUI. GCaMP signals were synchronized with USV audio files using similar methods as described in the USV recording sections as applied to USV audio and video files. The videos files were synchronized to GCaMP signals using an LED light triggered by the data acquisition board. Animals were first recorded for 4 mins in their home cage, then a live female was introduced to their home cages for another 4-5 mins. After freely interacting with the female, she was removed from test animals’ home cage and post-female USVs were recorded for an additional 4-5 mins. ΔF/F was calculated using the MATLAB GUI developed by the Deisseroth lab34. We used methods similar to those described in USV analysis to detect USVs in the audio file. Using the USV timepoints, we selected GCaMP signals at corresponding timepoints for analysis. Each animal went through several days of recording with pre-female, with-female and post-female stages per test day where each day was a trial. Trials were excluded if there were indications that the fiber connection was poor as indicated by a GCaMP signal that failed to increase above the threshold of 1.5% ΔF/F during the entire recording of that particular test day (17/118 trials were excluded for the LPOAEsr1 fiber photometry data and 0 trials were excluded for the PAGvGat fiber photometry with LPOAvGat photostimulation). The dataset consisted of GCaMP traces that were sectioned by −30s and +30s around USV onset. High-pass filters were applied to GCaMP windows as necessary to remove slow drift by subtracting a smoothed version of the signal from itself in rolling windows. Traces were then normalized via z-scoring using the standard deviation and mean of the signal before −10s for each section. The dot-plots comparing average GCaMP signal at no-USV timepoints vs. USV timepoints were produced by using the mean GCaMP signal around the 150ms window (−75ms, +75ms) at each USV onset. The mean of each group was then taken to produce the shown data points. To create data for the no-USV group, random timepoints from each GCaMP signal in the USV group were chosen using the same number of USV’s detected for each sample. To calculate whether the differences between groups were statistically significant, we used a 2-tailed unpaired t-test. The average GCaMP line plot was produced using a window of −30s and +30s from all detected USVs in each group, and the shaded boundary along the mean represents the 95% CI. The grey area represents the estimated shuffle distribution, calculated by scrambling the GCaMP traces 1000 times, computing the means, and using the 97.5th percentile of the absolute value as the confidence interval. For fiber photometry recording performed together with photo stimulation, ΔF/F was calculated 10s before and after light stimulation period and plotted as grouped data similar to the average line plot described above. For fiber photometry recording performed together with photo stimulation, zscore was calculated 10s before and after light stimulation period using zscore function in MATLAB and plotted as grouped data with shading zone indicates the 95% CI.
Vibratome and Esr1 staining
Animals were perfused with cold PBS followed by 4% PFA, and the brain was dissected and postfixed in 4% PFA at 4°C for 24-48 hours. The brain was then washed in PBS and embedded in 1% low melting point agarose and cut on a vibratome at 50um for ESR1 and/or cFos staining or 100um for Nissl-only staining. For ESR1 immunostaining, free-floating sections were blocked in 1% BSA (Sigma A3059) in 1% PBST (PBS plus Triton X-100) for 3 hours, followed by primary incubation with anti-ESR1 antibody (Millipore, Estrogen Receptor Alpha, Rabbit, 06935MI) diluted 1:1500 in 1% BSA / 0.3% PBST) overnight at 4℃. Sections were then washed in 0.1%PBST for 6 times, 5 mins each on 2nd day before incubated in secondary antibody (ThermoFisher Alexa-Fluor 488 or 647 anti-rabbit IgG H+L diluted 1:2000 in 1% BSA / 0.3% PBST) at room temperature for 3 hours. Nissl stain (ThermoFisher NeuroTrace Blue or Deep Red diluted 1:200) was also included here if necessary, or incubated for 4 hours in 1% PBST if used alone. Sections were washed 4 times in 0.1% PBST followed by 2 times in 1X PBS, then mounted with ProLong Diamond (ThermoFisher).
Multiplex fluorescent in situ hybridization (RNAscope)
Mice were anesthetized with isoflurane and perfused with 1X PBS before rapid brain extraction. Brains were embedded in OCT and frozen on dry ice immediately. 20μm coronal sections were cut via Cryostat (Leica) and stored at −80°C until processing according to the protocol provided in the RNAscope® Multiplex Fluorescent v2 kit (Advanced Cell Diagnostics). Sections were fixed in 4% PFA, dehydrated, and hybridized with mixed probes: Esr (Mm-Esr1-O2-C2, a 16ZZ probe targeting 1308-2125 of NM_007956.5.), eGFP (Cat. 538851), vGat (Mm-Slc32a1, Cat. 319191), and vGluT2 (Mm-Slc17a6-C2, Cat. 319171) for 2 h at 40°C and followed by amplification. Signal in each channel was developed using TSA Cyanine 3, fluorescein, and Cyanine 5 (PerkinElmer) individually. Sections were counterstained with DAPI and mounted with ProLong Diamond.
Confocal Microscopy
Images were captured with Nikon A1 Confocal Microscope with a 10x air or 20x air objective. Nikon Elements software settings were optimized for each experiment to maximize signal range, and z-stack maximum projections were used for quantification, while single optical slices were used for representative images. For RNAScope multiplex in situ hybridization, z-stacks were collected in 1µm increments throughout the z-axis.
Slice electrophysiology
Mice were anesthetized with isoflurane and transcardially perfused with ice-cold choline-based slicing solution, containing (in mM): 25 NaHCO3, 1.25 NaH2PO4, 2.5 KCl, 7 MgCl2, 25 glucose, 0.5 CaCl2, 110 choline chloride, 11.6 sodium ascorbate, and 3.1 sodium pyruvate. Brains were carefully extracted and transferred to a chamber filled with the same solution on a vibratome (VT1200; Leica). Brains were coronally sliced at 250 μm and incubated at 35°C for 15-20 min in recovery solution, containing (in mM): 118 NaCl, 2.6 NaHCO3, 11 glucose, 15 HEPES, 2.5 KCl, 1.25 NaH2PO4, 2 sodium pyruvate, 0.4 sodium ascorbate, 2 CaCl2, and 1 MgCl2. Slices were maintained at room temperature for at least one hour until transferred to a recording chamber on an Olympus BX51WI upright microscope. The chamber was continuously superfused with artificial cerebrospinal fluid (ACSF), containing (in mM): 125 NaCl, 25 NaHCO3, 2.5 KCl, 1.25 NaH2PO4, 11 glucose, 1.3 MgCl2, and 2.5 CaCl2, maintained at 30 ±2°C by a feedback temperature controller. Slicing solution, recovery solution, and ACSF were constantly bubbled with 95% O2 and 5% CO2. All compounds were purchased from Tocris or Sigma.
For all recordings, patch pipettes (3-5 MΩ) were pulled from borosilicate glass (G150TF-4; Warner Instruments) with a DMZ Universal Electrode Puller (Zeitz Instruments) and filled with appropriate intracellular solutions. Liquid junction potential was not corrected for any experiments. Neurons were visualized with differential interference contrast optics or epifluorescence (Olympus). Recordings were made with a MultiClamp700B amplifier and pClamp10 software (Molecular Devices). Data were low-pass filtered at 1 kHz and digitized at 10 kHz with a digitizer (Digidata 1440; Molecular Devices). Series resistance was monitored and cells that displayed > 20% change over the duration of recording were excluded.
To record optogenetically-evoked postsynaptic currents in PAG neurons, pipettes were filled with Cs-based intracellular solution, containing (in mM): 115 Cs+-methanesulphonate, 10 HEPES, 1 EGTA, 1.5 MgCl2, 4 Mg2+-ATP, 0.3 Na+-GTP, 10 Na2-phosphocreatine, 2 QX 314-Cl, 10 BAPTA-tetracesium (295 mOsm, pH 7.35). ChR2-expressing axon terminals were stimulated with a 5-ms blue light pulse emitted from a collimated light-emitting diode (473 nm; Thorlabs) driven by a T-Cube LED Driver (Thorlabs) under the control of Digidata 1440A Data Acquisition System and pClamp10 software (Molecular Devices). Light was delivered through the reflected light fluorescence illuminator port and the 40X objective at maximum intensity (13.45 mW). Prior to break-in, recordings were performed in a cell-attached configuration with trains of 5, 10, 25, or 50 Hz light pulses. Recordings of optogenetically-evoked EPSCs/IPSCs were then obtained from the same cells in voltage-clamp configuration. We measured EPSC around −60 mV and IPSC around 5 mV35. Spikes and EPSCs/IPSCs were analyzed using a custom Python script.
For current-clamp recording, pipettes were filled with an intracellular solution containing (in mM): 125 K+-gluconate, 4 NaCl, 10 HEPES, 0.5 EGTA, 20 KCl, 4 Mg2+-ATP, 0.3 Na+-GTP, and 10 Na2-phosphocreatine (290-300 mOsm, pH 7.2). To measure optogenetially-evoked firing of LPOA neurons, recordings were performed with similar photostimulation protocol (trains of 5, 10, 25, or 50 Hz light pulses). All current-clamp recordings were performed in the presence of 5 μM NBQX and 50 μM picrotoxin to block synaptic transmission.
MUPET Analysis15
We began with applying a high pass wavelet filter to allow only 40-khz frequencies and higher in recording files. Default MUPET settings were used in processing, except for noise suppression set to 10 before inputing the files to MUPET. For building repertoires, we empirically chose 40 syllables to analyze based on method describe in original paper.
USV analysis
We first began with filtering the recordings for each trial, excluding frequencies that were below 40kHz or above 90kHz to reduce the non-USV noise. To calculate USV power, the power spectrum of the raw data (Dodotronic Ultramic UM250K) was calculated using the spectrogram function in MATLAB. Power in the 40-90 kHz band was converted to decibels using a reference power of 10e-12 Watts, and room noise less than 1.5 std. dev. above mean power was subtracted. This power signal was then smoothed with a 50ms Gaussian window, and total power is reported as the integration of the smoothed power trace using the trapz function. MATLAB findpeaks (minimum peak amplitude of one standard deviation above noise, minimum peak separation 150 ms) was applied to the smoothed power trace to count the number of USVs. For the average USV power plot, we plotted the mean of all the trials, as well as the 95% confidence interval for the mean. (calculated as 1.96 times the standard error).
For syllable classification, we first computed the short-time Fourier transform (STFT) of the microphone trace using a multi-taper approach. Spectrograms were computed using Slepian tapers with a time-halfbandwidth product of 3, and the amplitude of the STFT was then log-transformed. To detect ultrasonic vocalizations (USVs) we used an approach similar to Holy & Guo4. Briefly, we computed the USV power (30-90 kHz), spectral contrast, and Wiener entropy, and used empirically-determined thresholds to detect USV calls while filtering out noise. To classify calls, STFTs were dimensionally reduced using principal components analysis (PCA). The resulting PCA scores (27 PCs explaining 90% of the variance were retained) were then modeled with a hidden Markov model with Gaussian emissions. The discrete states of the model were used for classification.
Cell count
After selecting a rectangular region of interest median or gaussian filters are applied. Based on an intensity threshold for a dataset, the image is binarized into black and white. All objects with fewer than threshold pixels are removed from the image where threshold pixels determined by the resolution of the images in the dataset to best describe the size of cells. To prevent over segmentation, the image is dilated, and connected components are shrunk to individual points. Then we count the number of components in the image. The coordinates of those cells within a region of interest are then converted into a scatter plot or heatmap.
Extended Data
Extended Data Figure 1. Esr1 expressing subset of LPOA neurons express cFos during odor-evoked USV calling.
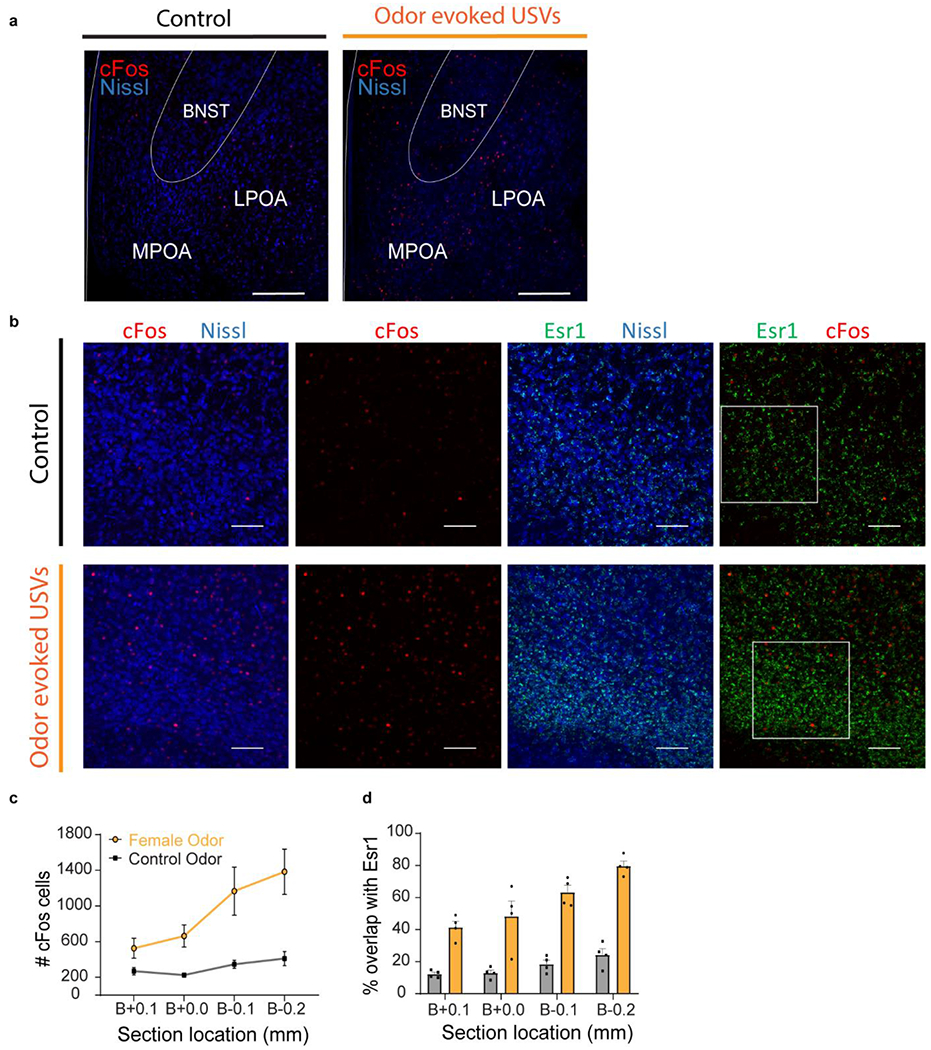
a, example of cFos expression in preoptic area following exposure to tonic water as a control odor (no USVs) or with female odor (USVs)25,36–38. BNST, Bed Nucleus of the Stria Terminalis; LPOA, Lateral Preoptic Area; MPOA, Medial Preoptic Area. Scale bar = 200μm. Quantification of this experiment is showed in panels c-d. b, immunostaining following female odor exposure shows cFos+ in LPOA largely overlaps with Esr1-Zsgreen cells. White squares delineate enlarged single z stack sections shown in main text Figure 1b. Scale bar = 100μm. c-d, expression of cFos and Esr1 in LPOA following awake behavior with control odor (black) or female odor (yellow). c) rostrocaudal distribution of cFos+ cells in LPOA. d) rostrocaudal percentage of cFos+/Esr1+ co-expressing LPOA cells. Mean ± s.e.m. N=4 animals.
Extended Data Figure 2. LPOAEsr1 neural activity correlates with USV calling; and chemogenetic inhibition of LPOAEsr1 neurons reduce USV calling.
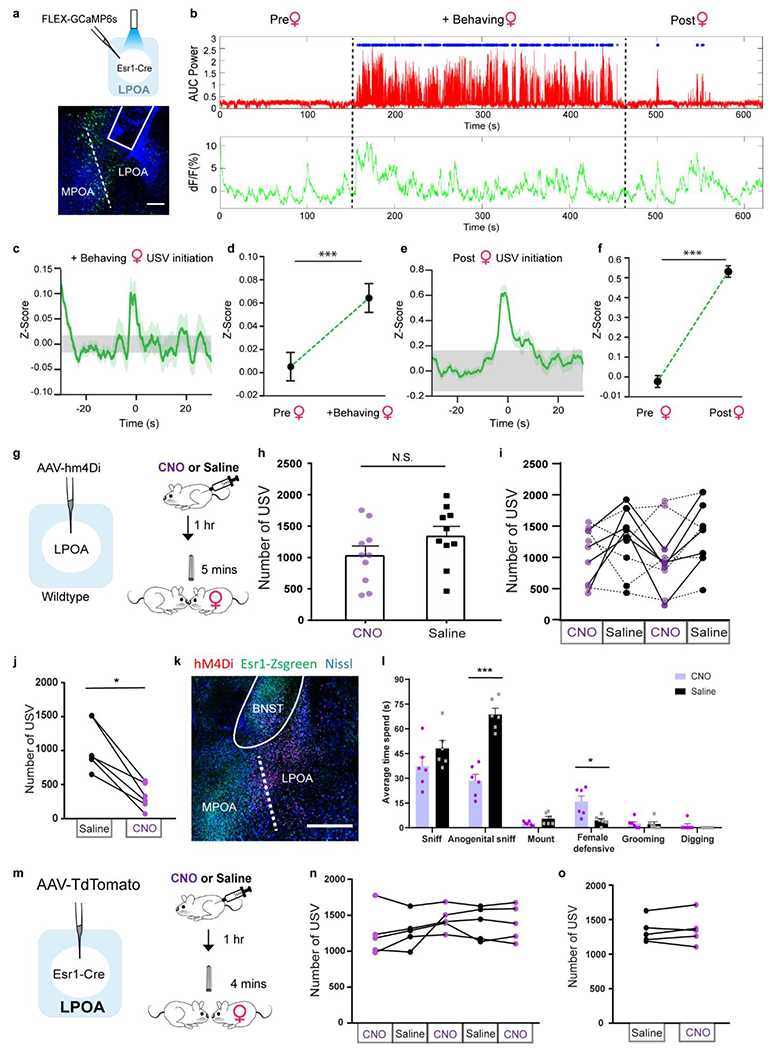
LPOAEsr1+ GCaMP activity during natural social behavior. a, top: experimental design for LPOAEsr1 fiber photometry recordings. Bottom: sample image showing fiber optic track and viral expression of GCaMP6s. Scale bar = 200μm. N=9 animals, >3 sections/animal collected. In addition to evoking USV calling, the presence of a female also dramatically alters male behavior (arousal, social sniffing, locomotion, sexual mounting) potentially confounding interpretation of the observed neural activity. We observed that following the removal of the female, males often generate intermittent USV calls, perhaps to lure her back, without the behavioral noise of mounting or social sniffing. We leveraged this post-female period to observe increases in LPOAEsr1/GCaMP6s activity with a rise shortly before the onset of post-female USVs, clearly suggesting that endogenous LPOAEsr1 neural activity correlates with emission of USVs. b, representative USV production and GCaMP fiber photometry of male LPOAEsr1 neurons as he behaves alone (pre-female), with a behaving female, and after female is removed (post-female). Dashed line indicates when the female was added and removed. Top: mean USV power, blue dots indicate USV syllable detection. Bottom: dF/F of LPOAEsr1 GCaMP6s signals was calculated by MATLAB GUI described previously34. c, dark green line: mean z-score of GCaMP6 signals before and after initiation of USV with behaving female phase, light green shading indicates 95% confidence interval. Grey shading: 95% confidence interval of the mean of the scrambled data (N=9 animals). d, mean average z-score of GCaMP signals during all USV syllables evoked with a behaving female compared to scrambled datapoints during pre-female behavior. Mean ± s.e.m. N=9 animals, unpaired t-test, two sided,*** p=0.0003. e, dark green line: mean z-score of GCaMP6s signals before and after initiation of USV during post-female stage, light green shading indicates 95% confidence interval. Grey shading: 95% confidence interval of the mean of the scrambled data. (N=9 animals) f, mean average z-score of GCaMP6s signal of all USV syllables during post-female stage compared to scrambled datapoints during pre-female stages. Mean ± s.e.m. N=9 animals, unpaired t test, two sided, *** p=2.2e−4. g-i, to determine whether the increased hypothalamic activity is involved in odor-evoked USV calling, we targeted chemogenetic inhibition to the LPOA, which is a largely unstudied heterogeneous region that has been implicated in sleep, thirst, and reward behavior39–43, and quantified USV production during natural interactions with an awake female. g, non-specific chemogenetics. left: AAV-hM4Di virus injection in LPOA of wildtype mice. Right: experimental assay; following expression of hM4Di virus, males were IP injected with CNO-saline-CNO-saline (every other day for 4 days total) and allowed to interact with a freely moving female to evoke USV calling. h, number of USV syllables emitted following injection with CNO (purple) or saline (black). Mean ± s.e.m., N=10 animals. Paired two-tailed Wilcoxon test, N.S.: p=0.11. i, number of USVs emitted across four sequential test days. Overall, the manipulation did not produce a significant effect on behavior, however half of this group (solid lines, N=5 animals) did show a constant reduction in USVs while the other half (dashed lines, N=5 animals) continued to emit USVs in the presence of CNO. This experiment suggests the potential for a functional role of the hypothalamic neurons in social vocal communication and a need for a more specific viral labelling method. j, average number of USVs between all Saline and CNO injected days as showed in Fig 1d. N=6 animals, Wilcoxon test, two sided, * p=0.03. k, sample image of hM4Di expression in Esr1-Zsgreen animals. Scale bar = 500μm. N=6 animals, >3 sections/animal collected. l, quantification of total time performing social behaviors observed by male LPOAEsr1/hM4Di during a 4 min interaction with live females on CNO and Saline injection days. N=6 animals. Paired t test was performed, two-sided,*** p<0.001, * p=0.02. Note: we observed an unexpected increase in the female’s anti-social defensive behavior (kicking, running away) which reduced his ability to direct sniffing to her anogenital region. This observation is consistent with male USVs serving to enhance female courtship behavior44,45.m, experiment design of expressing control AAV-TdTomato virus into LPOAEsr1 cells. n, number of USVs emitted with behaving female over 5 test days, alternating injections of either CNO or saline. o, average number of USVs between Saline and CNO injected days. N=5 animals. Wilcoxon test, two sided, p>0.05.
Extended Data Figure 3. Optogenetic stimulation of LPOAEsr1/ChR2 neurons triggers USV calling in both male and female mice.
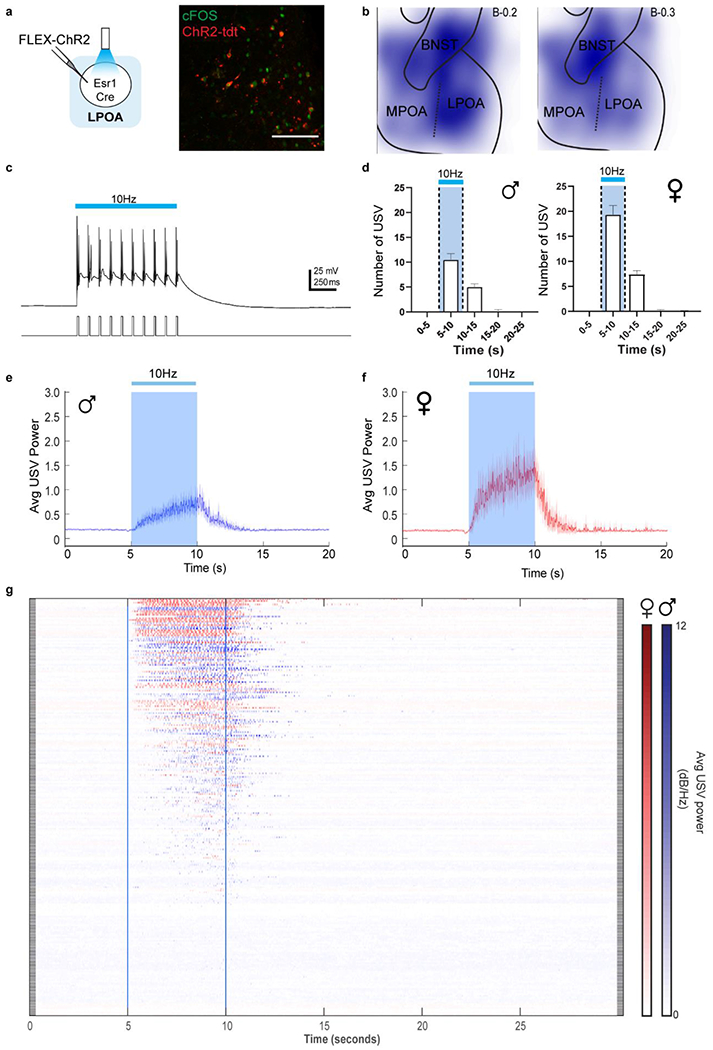
a, Left; ChR2 virus injection in LPOA region of Esr1-Cre mice. Right; Sample image of ChR2 and cFos co-expression following photostimulation. Scale bar = 50μm. b, viral expression in LPOA region. Composite overlay of total sections at left; bregma-0.2mm and right: bregma-0.3mm. Color intensity scales with increasing expression. N=12 animals. c, example electrophysiology recording during photostimulation of LPOAEsr1/ChR2 neurons in ex vivo slice. Blue bar = 10Hz light stimulation. Neural response is time-locked to light pulses. d, number of USVs detected during 10Hz photostimulation of LPOAEsr1/ChR2 cells from left; males (N=23 animals) and right; females (N=11 animals) Mean ± s.e.m. e-f, average dB across 40-90kHz band evoked by 10Hz photostimulation. Solid line indicates mean of all trials; shaded region indicates 95% confidence interval. e) blue trace: male trials, f) red trace: female trials14,46. Blue shading/bar = light stimulation at 5-10 seconds. g, raster plot of complete data set showing USV power evoked by 10Hz 5s 15ms photostimulation (between blue lines) from LPOAEsr1/ChR2 females (N=11 animals, red) and males (N=23 animals, blue), N = 242 trials, each row is a single trial. Color intensity represents average dB across the ultrasonic band (40-90kHz). Discussion note: the POA has been implicated in a variety of functions including homeostatic control of internal states such as thermoregulation and thirst, sexually dimorphic social behaviors including parenting and mating behavior, as well as motivated behaviors39,47–49. It is likely that features of these neurons that enable them to generate USVs in the absence of social stimuli in the lab also enable them to participate in other neural computations that are currently unknown.
Extended Data Figure 4. Activating LPOAEsr1 neurons elicits a variety of USV syllables similar to natural USVs.
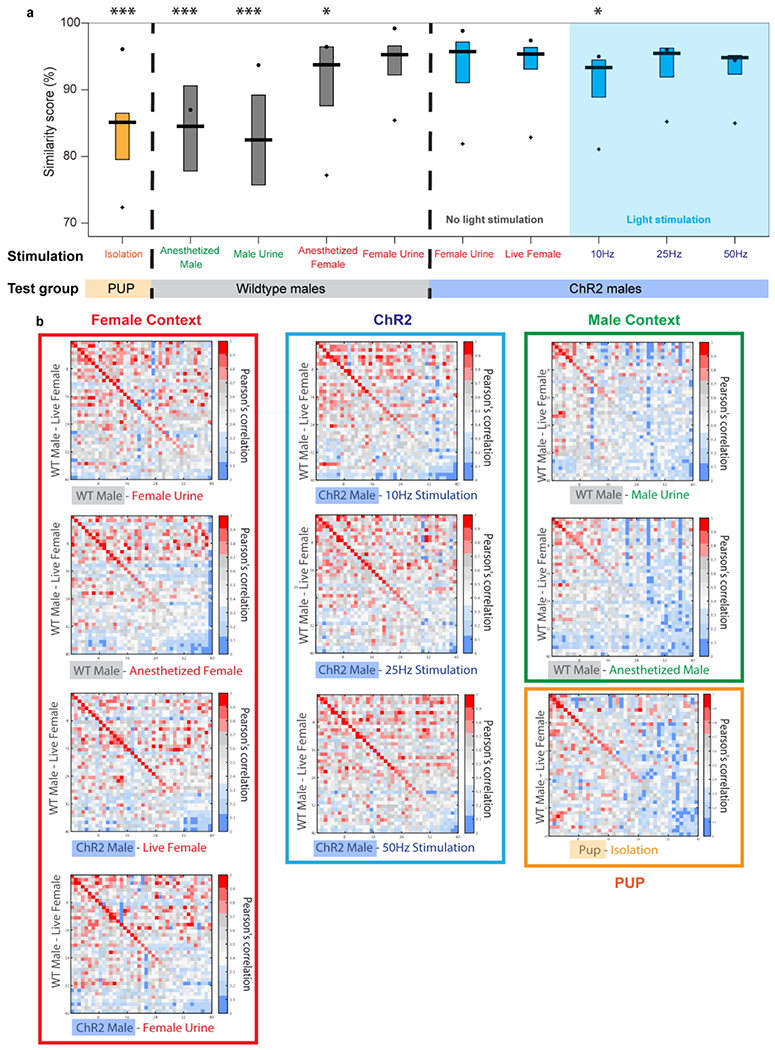
a, Evaluation of USV syllable types emitted by a wild-type male naturally interacting with a behaving female compared to; Orange: WT P7-P8 pup calls (N=18 animals) evoked by individually isolating from home cage; Grey: Wildtype adult male calls (N=20 animals) evoked by interaction with female urine, male urine, anesthetized male, or anesthetized female on successive days; Blue: left) calls from experimental males expressing ChR2 (LPOAEsr1/ChR2, N=23 animals) evoked by interaction with either female urine or a live female with no ChR2 light stimulation to determine natural USV repertoire; Blue: right) (blue shading ‘light stimulation’) males expressing ChR2 (LPOAEsr1/ChR2, N=23 animals) stimulated with light (10Hz, 25Hz and 50Hz) in the absence of a female (same males were used in no light and light stimulation experiments). Dot denotes the Pearson correlations for the top 5% of the most frequently used syllables, where the boxplot shows the mean and interquartile range of these correlations, and the plus sign (+) shows the correlation of the top 95% of the most frequency used syllables. One-way ANOVA test, P(F>83.4)= 6.12ê−115. Using MATLAB mulcompare function for group analyze compared to wildtype male USV triggered by live female interaction, ***=p<0.001, *=p<0.05. b, heatmap showing person’s correlation score among all 40 types of syllables detected across each condition compared to wildtype male USVs during interaction with live female. Results are grouped by types of sensory stimulation: female context (red); ChR2 stimulation (blue); male context (green) and pup (orange). Warmer colors in panel b indicates higher similarity, which is quantified in panel a. These data find that the repertoire of USV syllables evoked by photostimulation are rich and varied. When compared to natural USVs, they are quite similar to those produced by WT male mice as they interact with a live female; the natural male produced USVs evoked by male cues and pup USVs are less similar to the photostimulated USVs.
Extended Data Figure 5. LPOAEsr1 projections to USV motor center (ambiguous) are sparse and unable to be functionally validated while LPOAEsr1 projections to PAG produces robust USV production.
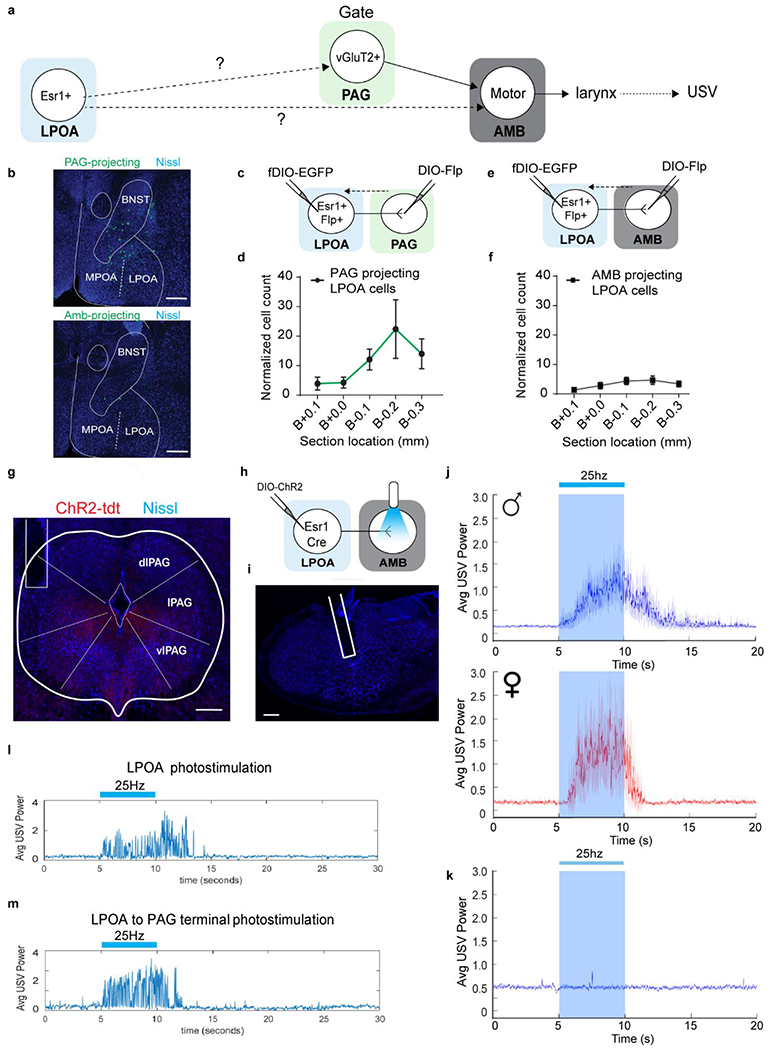
a, strategy to test whether LPOAEsr1 neurons are anatomically or functionally connected to either the PAG or the Amb which are known to evoke USV calling in the mouse16,17,50,51. b-f, retrograde tracing experiment from either PAG or AMB to label LPOAEsr1 cell projections by injecting a Cre-dependent FLP-expressing pseudotyped equine infectious anemia virus (RG-EIAV-DIO-Flp) in either the PAG or Amb, and a FLP-dependent AAV expressing eGFP in the LPOA of Esr1-Cre mice32,33. We confirmed the specificity of viral expression by multiplex fluroscent in situ hybridization (Extended Data Figs. 6a–b). We observed sparse labeling of LPOA cells that directly project to the Amb, and a larger population centered in the LPOA region of cFos/Esr1 overlap that directly project to the region of the PAG USV-gate neurons. b) example image of PAG-projecting (top) or Amb-projecting (bottom) eGFP positive cells in LPOA as described and quantified in c-f. Scale bar = 200 μm. N=5 animals, 5 sections/animal collected. c-d, anatomic tracing from PAG to LPOA resulted in robust labeling. c) experimental design to express DIO-FLP virus in PAG and fDIO-eGFP in LPOA of Esr1-Cre mice. d) restrocaudal distribution of total number of PAG-projecting eGFP positive cells in the LPOA. Mean ± s.e.m. N=5 animals. e-f, anatomic tracing from Amb to LPOA resulted in sparse labeling. e) experimental design to express DIO-FLP virus in Amb and fDIO-eGFP in LPOA of Esr1-Cre mice. f) restrocaudal distribution of total number of Amb-projecting eGFP positive cells in the LPOA. Mean ± s.e.m. N=5 animals. To test if either of these projections function to evoke USV calling, we expressed ChR2 in the LPOA of Esr1-Cre mice and photostimulated from axon terminals in either the PAG or Amb. g, sample image of optical fiber position for stimulation of LPOAEsr1/ChR2 terminals in PAG show in panel j. h, experimental design for stimulation of LPOAEsr1/ChR2 terminals in Amb. i, sample image of optical fiber position for terminal stimulation at Amb. Scale bar = 200μm. N=5 animals, 4 sections/animal collected. j, average USV power across 40-90kHz band of recording during PAG terminal stimulation, solid line indicates the mean and shaded region indicate 95% confident interval. (blue shading, N=13 male animals. Red shading, N=4 female animals. 4 trials/animal.) k, average USV power across 40-90kHz band of recording during Amb terminal stimulation, solid line indicates the mean and shaded region indicate 95% confident interval. (Blue shading, N=5 male animals. 4 trials/animal.) l-m, average USV power during single trials of the same male stimulated with 25Hz 5s from either l) LPOAEsr1/ChR2 cell somas, or m) LPOAEsr1/ChR2 axon terminals in the PAG.
Extended Data Figure 6. LPOA-PAG projecting cells are largely inhibitory and stimulation of LPOAvGat cells elicits USVs.
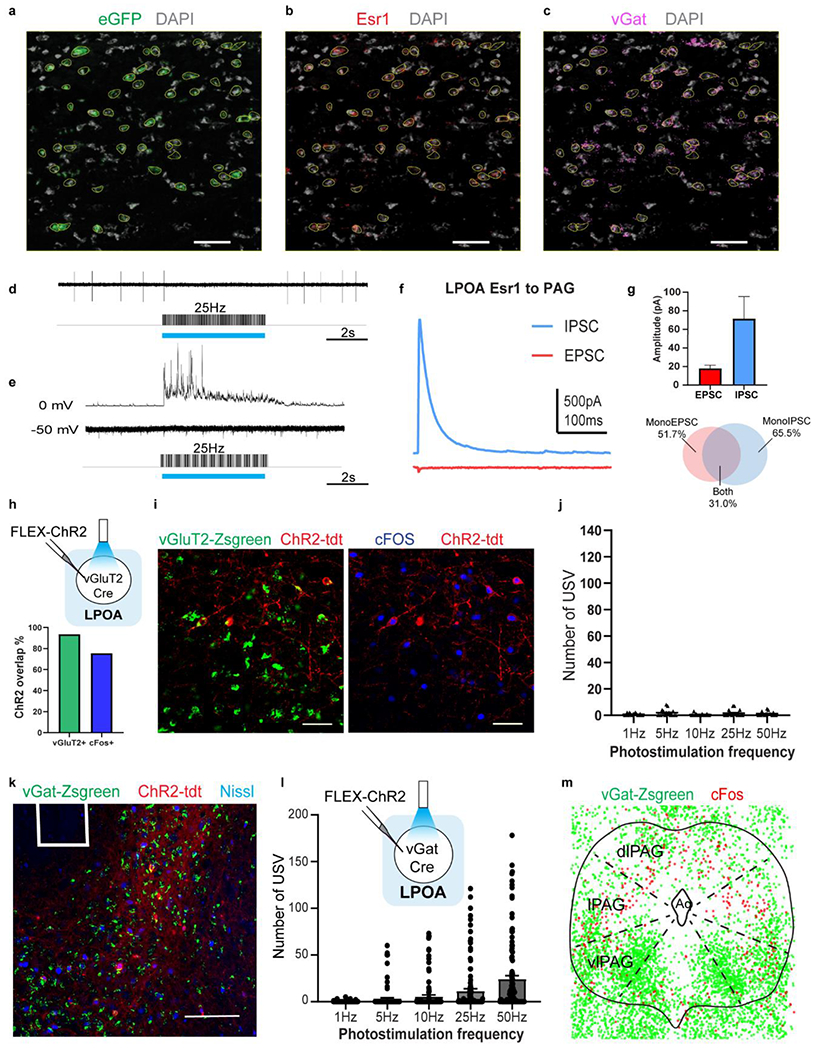
a-c, RNAScope multiplex in situ hybridization histology of LPOA sections following injection of retro travelling Cre-dependent FLP expressing virus in the PAG and a FLP dependent eGFP (AAV-fDIO-dGFP) in the LPOA of Esr1-Cre mice (see Extended data Figure 4c-d) reveals overlap of a) eGFP (green), b) Esr1 (red), and c) vGat (magenta) probes. Yellow traces are eGFP positive used as ROIs and applied to Esr1 and vGat channels for analysis. Scale bar = 50μm. N=3 animals, >3 sections/animal with RNAScope staining. d-g, electrophysiology recording of PAG neurons in ex vivo slice shows functional inhibition. d) sample trace showing cell-attached recording of a PAG cell and e) IPSC and EPSC recording while photostimulating (blue bars) LPOAEsr1/ChR2 terminals. f) IPSC and EPSC during single light pulse. g) peak conductance (calculated by amplitude/driving force) of EPSC (red) and IPSC (blue) recorded. Mean ± s.e.m. Bottom, percentage of observed cells with monosynaptic IPSC (blue), EPSC (red), or both (grey). N=5 mice, 29 cells. h-i, strategy to test if LPOA excitatory neurons elicit USVs. h) top: experimental design to express ChR2 in the LPOA of vGluT2-Cre mice. Bottom: ChR2% overlap with vGLuT2-Zsgreen marker or cFos staining. I) sample images showing overlap between ChR2 with vGluT2-Zsgreen marker and cFos staining. Scale bar = 50μm. N=4 animals, 7 images per animal used for cell quantification. j, number of USVs emitted during light stimulation of LPOAvGluT2/ChR2 neurons. N=4, 16 trials per condition. k, sample image indicating fiber position (white square) and ChR2 expression in LPOA of vGat-Zsgreen mice. Scale bar = 200μm. N=9 animals, 4 sections/animal collected. l, experimental design to express ChR2 in LPOA of vGat-Cre mice and number of USV syllables emitted during light stimulation of LPOAvGst/ChR2 neurons. Mean ± s.e.m. N=9 animals, 91 trials per condition. m, composition of cFos expression (after odor evoked USVs) in PAG of vGat-mice. cFos positive cells (red) are largely vGat negative (consistent with PAG USV gate neurons being excitatory) while vGat neurons are largely clustered in the ventrolateral PAG52. N=3 animals, overlay of 100um thick sections roughly at Bregma – 4.4mm.
Extended Data Figure 7. Local PAGvGat neurons inhibit PAG USV-gate cells; photostimulation inhibits natural USVs.
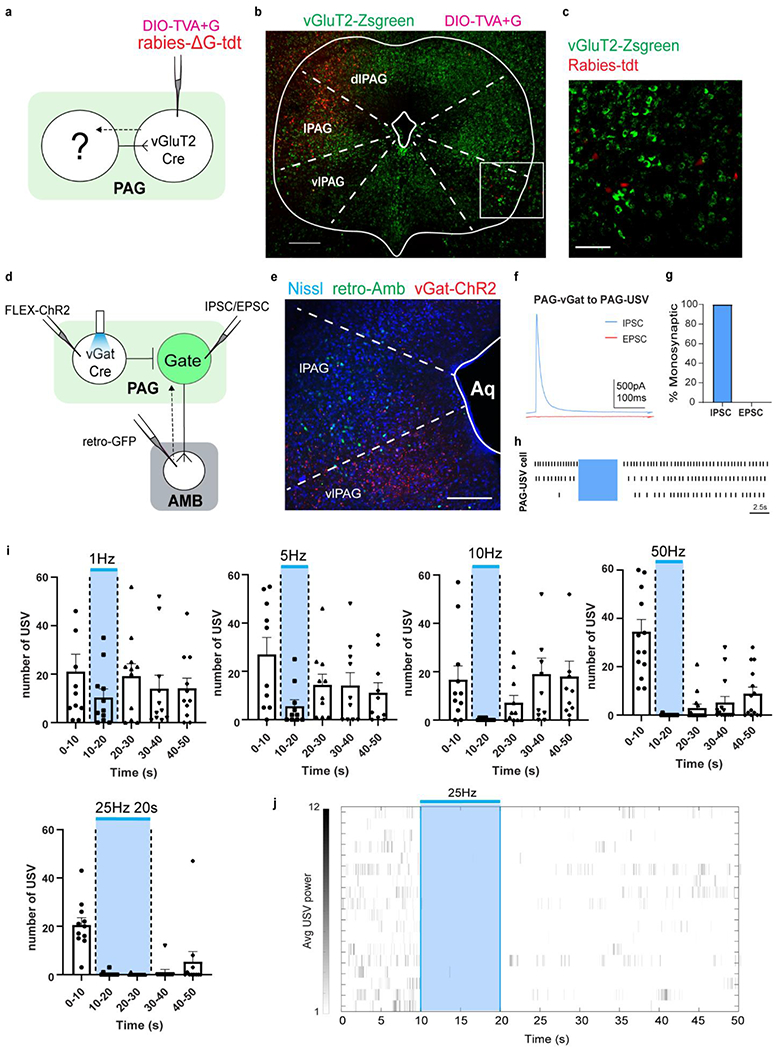
The majority of immediate neurons ‘upstream’ of the PAG USV-gate cells, are vGluT2-negative neurons in the PAG, ipsilateral to the PAGvGluT2 neurons. a, experimental design for rabies viral-tracing from PAG in vGluT2-Cre mice. b, sample PAG image from rabies tracing. Red cells on left are the TVA+G helper virus infected cells that overlap with vGluT2-Zsgreen (starter cells). White box on right side is enlarged and showed in (c). Scale bar = 250μm. c, 76 out of 87 rabies-tdt labeled cells (87%) observed in vlPAG do not overlap with vGluT2-Zsgreen cells, supporting that they are likely expressing vGat. Scale bar = 100μm. N=5 animals, total 32 sections counted. To functionally test if the PAG USV-gate neurons are subjected to local inhibition, we engineered males to express ChR2 in the local PAG inhibitory cells (PAGvGat/ChR2) and injected retroAAV-eGFP in the Amb to specifically identify PAG USV-gate neurons. d, experimental design for retrograde labeling from Amb to PAG USV-gate neurons and optical manipulation of PAGvGat/ChR2 cells for behavior and physiology. e, sample image of PAG section showing Amb-projecting cells in lPAG (green) and vGat/ChR2 expressing cells (red) in vlPAG. Scale bar = 100μm. Aq = Aqueduct, fourth ventricle. Ex vivo whole-cell recordings and cell attached recordings revealed all tested PAGGFP neurons (USV-gating neurons) were inhibited within 5ms after photostimulation of PAGvGat/ChR2 neurons consistent with monosynaptic inhibitory inputs. N=2 animals, 2 section/animal collected. f-h, ex vivo slice electrophysiology recordings of PAG USV-gate cells while photostimulating of PAGvGat/ChR2 neurons. f) IPSC and EPSC during single light pulse. g) photostimulation of PAGvGat/ChR2 neurons generate monosynaptic iPSCs in all cells investigated. N=2 animals, 14 cells total recorded. h) cell attached physiology of USV-gate neurons (PAGGFP). Blue shading indicates photstimulation period. Each line showed as individual cell recorded. I-j, stimulating local PAGvGat neurons inhibit socially evoked USVs. i) increasing frequency or duration of photostimulation (5s of 1Hz, 5Hz, 10Hz ,50Hz and 10s of 25Hz) of PAGvGat/ChR2 males during interaction with awake behaving females to evoke natural USVs. Blue bar/shading = light stimulation. Number of USVs are calculated in 10s time bins. Mean ± s.e.m. N=3 animals, 5-6 trials/animal/condition. j) raster plot of USVs emitted before, during and after photostimulation of 25Hz 5s stimulation as showed in main text Fig 2e. Blue light indicates light stimulation period. Each row is a single trial. Mean ± s.e.m. N=3 animals, 19 trials.
Extended Data Figure 8. LPOAvGat cell population connect to PAGcGat cell population both anatomically and functionally; and the number of USV syllables and latency flexibly varies with social context.
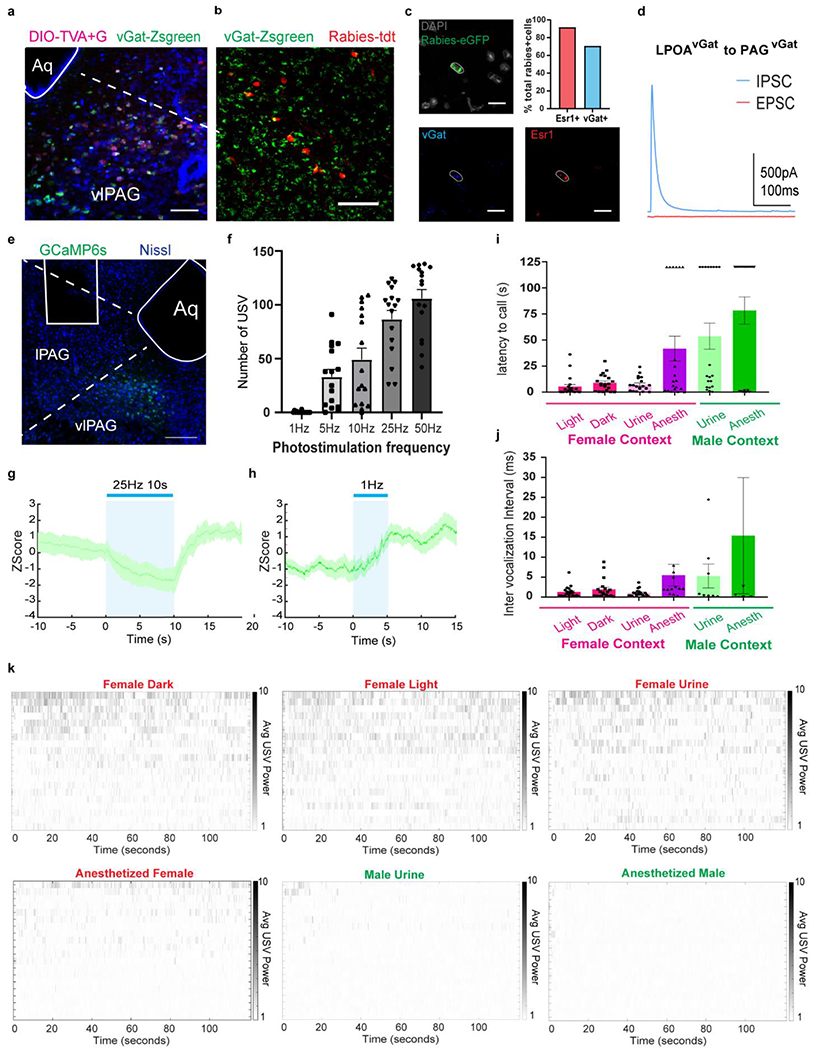
a, example image of PAG section for experiment described in Fig. 2f–g. Starter cells (magenta) overlap with vGat-Zsgreen. Scale bar = 100μm. Aq = Aqueduct. b, sample image of LPOA section for experiment described in main Figure 2f–g showing overlap of Rabies-tdt positive cells (red) with vGat-Zsgreen. (272/320 cells counted, N=3 mice, total of 17 sections. Scale bar = 200μm. c, example image of RNAScope multiplex in situ hybridization in LPOA to complement main Figure 2c. Sections are stained with eGFP (green), vGat (blue) and Esr1(red) probes. Scale bar = 25μm. The majority of LPOA neurons that projected to PAGvGat co-express Esr1. N=2 animals, total of 16 sections (20um thick) collected. Top right panel: quantification of rabies positive cells overlapping with vGat+ or Esr1+ using RNAScope multiplex in situ hybridization. N=2 animals, total 24 rabies positive cells quantified. d, PAGvGat cells receive monosynaptic IPSC from LPOAvGat/ChR2 neurons. IPSC and EPSC evoked by single light pulse, N=5 animals, 16 cells recorded. e-h,To study the in vivo effects of LPOAEsr1 activity we expressed both ChR2 in the LPOA and GCaMP6s in the PAG of vGat-Cre mice (LPOAvGat/ChR2;PAGvGat/GCaMP6s). Photostimulation in the LPOA of awake behaving mice resulted in a decrease in fiber photometry measured GCaMP6s fluorescence in the local PAG inhibitory neurons and an accompanying initiation of USV production. E) representative image of fiber track and viral expression of GCaMP6s in PAG. Scale bar = 200μm. N=4 animals, 3 sections/animals collected. F) number of USV syllables emitted following light stimulation of LPOAvGat/ChR2 neurons while recording of PAGvGat/GCaMP6s signals. Mean ± s.e.m. N=4, 16 trials per condition. g) mean z-score of fiber photometry signal from PAGvGat/GCaMP with 25Hz 10s photostimulation of LPOAvGat/ChR2 cells. h) mean z-score of fiber photometry signal from PAGvGat/GCaMP with 1Hz 5s photostimulation of LPOAvGat/ChR2 cells, where the photostimulation is below the threshold to produce USVs. Solid line indicates mean of signals and shaded region indicates 95% confident intervals. N=4 animals, 3 trials/animal. i-k, to study the extend of USV syllables flexibility during natural social behavior, we collected wild-type male mice USV during difference social context. Wild-type male USVs were recorded during 2 minute interactions with a variety socially relevant sensory contexts including awake female (in dark or light), female urine, anesthetized female, male urine, or an anesthetized male. Flexibility of social vocalization is underscored by the longer and louder USV-bouts triggered by awake behaving females compared to the USVs evoked by anesthetized females even though much of the contextual sensory cues are similar. i) latency to first USV evoked by different sensory contexts. J) average inter vocalization intervals (IVIs) of USVs evoked by different sensory stimuli. Red bar = female context (live female in either the dark with red light or bright light, female urine, anesthetized female); green bar, male context (male urine, anesthetized male). Mean ± s.e.m. N=20 animals. k) raster plot of USVs emitted while interacting with different sensory contexts. Each line is a single wildtype male. Average USV power is calculated by mean dB in 40-90kHz band from raw recording.
Extended Data Figure 9. Increasing LPOAEsr1 activity generates more USV syllables without altering syllable identity.
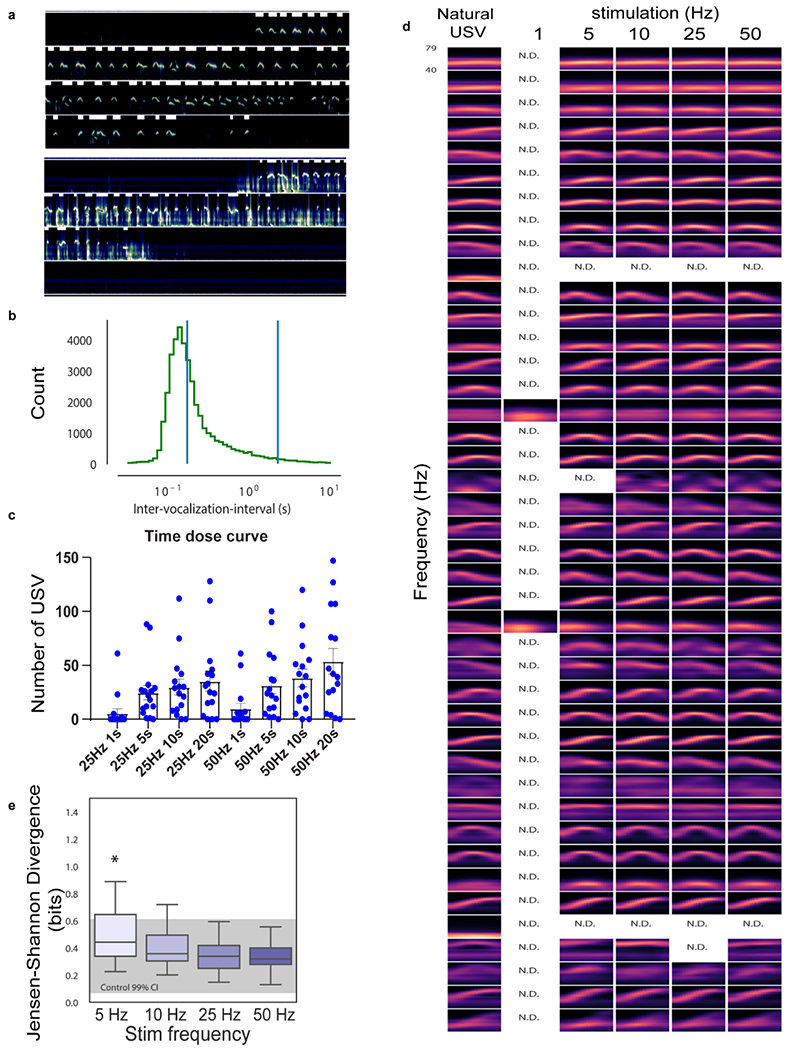
a, two sonograms (12 seconds long each) analyzed for USV production. White bars (top of each 3 second line) indicate production and duration of USV syllables automatically identified. In upper sonogram there was little additional acoustic noise so USV syllables are easy to identify; in lower sonogram there is abundant low frequency noise (from self-movement or from interactions with another individual during USV recording) however, white bars robustly identify USV syllables. b.to determine if USV bout length is fixed or variable, we analyzed the inter-USV vocalization intervals (IVI) and found a natural threshold of 2 second pauses as a basis to define the end of a USV-bout23 as determined by the distribution plot of inter-vocalization-intervals reveals a peak of duration. c, number of USVs emitted at 25 or 50Hz of photostimulation on LPOAEsr1/ChR2 cells from 1-20 seconds stimulation duration. Mean ± s.e.m. N=16 animals. d, syllables maintain their identity and structure from 1-50 Hz photostimulation of LPOAEsr1/ChR2 neurons. e, Jensen-Shannon divergence score of USVs produced by 1-50 Hz photostimulation of LPOAEsr1/ChR2 cells compared to natural USVs during interaction with female urine or live female. Box plot: min-max, 5%-95% percentile, grey shading, control data’s 95% confident interval. For computing p-values, we random choose mice with no stim and mice with ChR2 stimulation and computer the JSD, this step was repeated 1000 times to build a null distribution. Then we computer the probability that each bootstrap exceeds the observed median at each stim frequency. We found only 5Hz stimulation frequency results in a significant p value: * p=0.036, N=26 animals.
Extended Data Figure 10. Circuit and intrinsic properties of PAGvGat neurons support USV persistence.
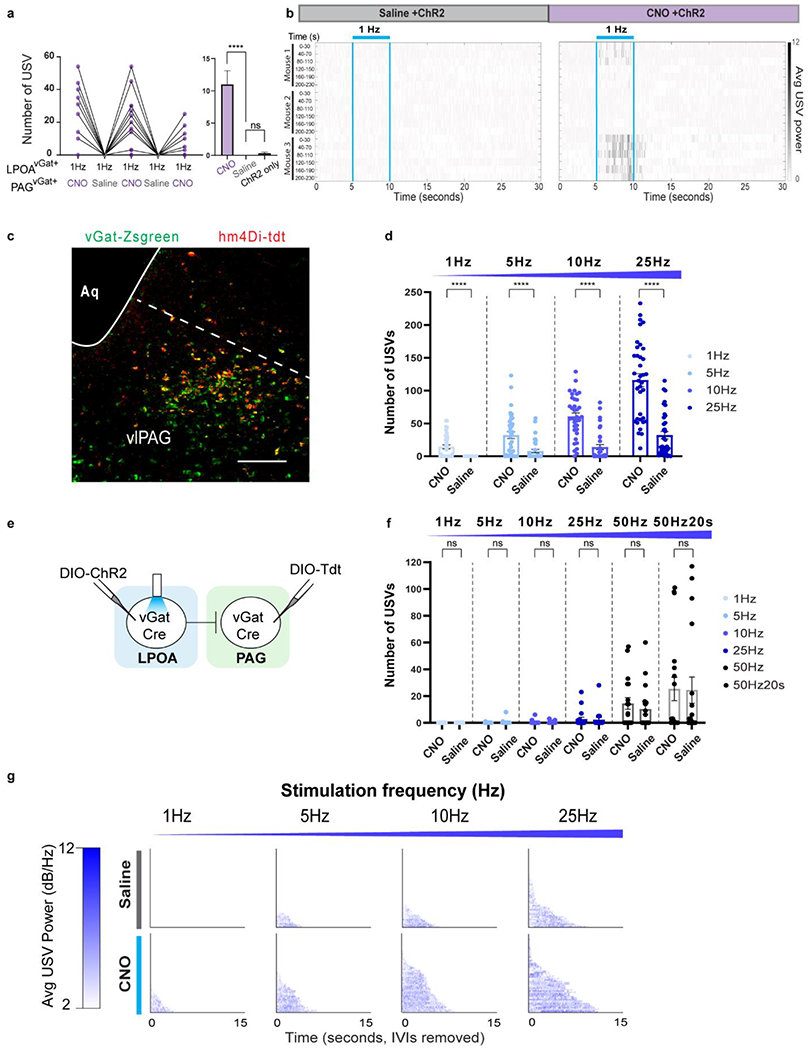
a-b, USVs emitted during photostimulation of LPOAvGAT/ChR2/ PAGvGat/hM4Di following injection of saline (grey) or CNO (purple) on alternate days. USV number during a) 1Hz stimulation. b) raster plot of USVs emitted during and following photostimulation (blue bars). Each row is 30” of a 230” trial aligned to light stimuli applied every 40”. Mean ± s.e.m. N=3, 6 trials/animal per test day. Paired Wilcoxon test, two sided, ****p<0.0001. ns: p>0.05. c, representative image of co-expression of hM4Di-tdt with vGat-Zsgreen cells in PAG. Scale bar = 200μm. N=2 animals, 2 sections/animal collected. d, number of USVs emitted during increasing frequency of photostimulation of LPOA in LPOAvGAT/ChR2/ PAGvGat/hM4Di males with CNO or saline. N=3, 36 trials per condition. Mean ± s.e.m. Wilcoxon test,two sided. **** = p<0.0001. e, experimental design to express control virus (tdt) in PAG of vGat-Cre mice (to control Main text Fig. 4e–f). f, number of USVs emitted by photostimulating LPOAvGat cells either under CNO or saline conditions in animals expressing FLEX-tdt (control). N=3, 18 trials/condition. Mean ± s.e.m. Wilcoxon test, two sided. ns= p>0.05. g, raster plot of USV bouts emitted during either CNO or saline test days under different stimulation frequency. Note: drosophila courtship songs similarly show feature separation across the circuit with songs evoked by pIP10 neurons tightly locked to stimulation (like the PAG USV-gate neurons) compared to calling generated by P1 neurons which persists beyond stimulation (as with the LPOAEsr1 neurons)53. This suggests diverse social species utilize general circuit strategies to maintain persistent auditory responses outlasting the detection of sensory information.
Supplementary Material
Acknowledgements
We thank the Stowers Lab for support and advice; Dr. Tim Holy and Dr. Terra Barnes for early constructive comments and discussions. We thank Dr. S. Tan, N. Koblesky and Dr. S. Simpson for exploratory behavioral tests and Dr. L. Ye for aid with the fiber photometry experiments. The work was supported by the Dorris Neuroscience and Skaggs Scholarships (JC) the Anandamahidol Foundation Fellowship (VL), Career Award at the Scientific Interface from BWF (JM), and grants from NIH (R01NS097772 and R01DA049787 B.K.L.; R01NS108439 (LS).
Footnotes
Code availability
All analysis code are available on GitHub: https://github.com/stowerslab/USV_Analysis_Code.git.
Competing Interests
The authors declare no competing or financial interests.
Supplementary Information
Supplementary Information is available for this paper.
Data availability
The data in this study is available from the corresponding author upon request.
Main Text References:
- 1.Bachorowski JA & Owren MJ Not all laughs are alike: voiced but not unvoiced laughter readily elicits positive affect. Psychol Sci 12, 252–257, doi: 10.1111/1467-9280.00346 (2001). [DOI] [PubMed] [Google Scholar]
- 2.Darwin CE, P; Pordger P The expression of the emotions in man and animals. 3rd edn, (Harper Collins, 1998). [Google Scholar]
- 3.Esposito G, Nakazawa J, Venuti P & Bornstein MH Judgment of infant cry: The roles of acoustic characteristics and sociodemographic characteristics. Jpn Psychol Res 57, 126–134, doi: 10.1111/jpr.12072 (2015). [DOI] [PMC free article] [PubMed] [Google Scholar]
- 4.Holy TE & Guo Z Ultrasonic songs of male mice. PLoS biology 3, e386, doi: 10.1371/journal.pbio.0030386 (2005). [DOI] [PMC free article] [PubMed] [Google Scholar]
- 5.Whitney G, Alpern M, Dizinno G & Horowitz G Female odors evoke ultrasounds from male mice. Anim Learn Behav 2, 13–18 (1974). [DOI] [PubMed] [Google Scholar]
- 6.Keller JA et al. Voluntary urination control by brainstem neurons that relax the urethral sphincter. Nature neuroscience 21, 1229–1238, doi: 10.1038/s41593-018-0204-3 (2018). [DOI] [PMC free article] [PubMed] [Google Scholar]
- 7.Brainard MS & Doupe AJ Translating birdsong: songbirds as a model for basic and applied medical research. Annual review of neuroscience 36, 489–517, doi: 10.1146/annurev-neuro-060909-152826 (2013). [DOI] [PMC free article] [PubMed] [Google Scholar]
- 8.Jarvis ED Evolution of vocal learning and spoken language. Science 366, 50–54, doi: 10.1126/science.aax0287 (2019). [DOI] [PubMed] [Google Scholar]
- 9.Gao SC, Wei YC, Wang SR & Xu XH Medial Preoptic Area Modulates Courtship Ultrasonic Vocalization in Adult Male Mice. Neurosci Bull 35, 697–708, doi: 10.1007/s12264-019-00365-w (2019). [DOI] [PMC free article] [PubMed] [Google Scholar]
- 10.Karigo T et al. Distinct hypothalamic control of same- and opposite-sex mounting behaviour in mice. Nature, doi: 10.1038/s41586-020-2995-0 (2020). [DOI] [PMC free article] [PubMed] [Google Scholar]
- 11.Michael V et al. Circuit and synaptic organization of forebrain-to-midbrain pathways that promote and suppress vocalization. eLife 9, doi: 10.7554/eLife.63493 (2020). [DOI] [PMC free article] [PubMed] [Google Scholar]
- 12.Fang YY, Yamaguchi T, Song SC, Tritsch NX & Lin D A Hypothalamic Midbrain Pathway Essential for Driving Maternal Behaviors. Neuron 98, 192–207 e110, doi: 10.1016/j.neuron.2018.02.019 (2018). [DOI] [PMC free article] [PubMed] [Google Scholar]
- 13.Moffitt JR et al. Molecular, spatial, and functional single-cell profiling of the hypothalamic preoptic region. Science 362, doi: 10.1126/science.aau5324 (2018). [DOI] [PMC free article] [PubMed] [Google Scholar]
- 14.Maggio JC & Whitney G Ultrasonic vocalizing by adult female mice (Mus musculus). J Comp Psychol 99, 420–436 (1985). [PubMed] [Google Scholar]
- 15.Van Segbroeck M, Knoll AT, Levitt P & Narayanan S MUPET-Mouse Ultrasonic Profile ExTraction: A Signal Processing Tool for Rapid and Unsupervised Analysis of Ultrasonic Vocalizations. Neuron 94, 465–485 e465, doi: 10.1016/j.neuron.2017.04.005 (2017). [DOI] [PMC free article] [PubMed] [Google Scholar]
- 16.Arriaga G, Zhou EP & Jarvis ED Of mice, birds, and men: the mouse ultrasonic song system has some features similar to humans and song-learning birds. PloS one 7, e46610, doi: 10.1371/journal.pone.0046610 (2012). [DOI] [PMC free article] [PubMed] [Google Scholar]
- 17.Tschida K et al. A Specialized Neural Circuit Gates Social Vocalizations in the Mouse. Neuron 103, 459–472 e454, doi: 10.1016/j.neuron.2019.05.025 (2019). [DOI] [PMC free article] [PubMed] [Google Scholar]
- 18.Kohl J et al. Functional circuit architecture underlying parental behaviour. Nature 556, 326–331, doi: 10.1038/s41586-018-0027-0 (2018). [DOI] [PMC free article] [PubMed] [Google Scholar]
- 19.Tovote P et al. Midbrain circuits for defensive behaviour. Nature 534, 206–212, doi: 10.1038/nature17996 (2016). [DOI] [PubMed] [Google Scholar]
- 20.Doupe AJ & Kuhl PK Birdsong and human speech: common themes and mechanisms. Annual review of neuroscience 22, 567–631, doi: 10.1146/annurev.neuro.22.1.567 (1999). [DOI] [PubMed] [Google Scholar]
- 21.Sainburg T, Theilman B, Thielk M & Gentner TQ Parallels in the sequential organization of birdsong and human speech. Nat Commun 10, 3636, doi: 10.1038/s41467-019-11605-y (2019). [DOI] [PMC free article] [PubMed] [Google Scholar]
- 22.Chabout J, Sarkar A, Dunson DB & Jarvis ED Male mice song syntax depends on social contexts and influences female preferences. Front Behav Neurosci 9, 76, doi: 10.3389/fnbeh.2015.00076 (2015). [DOI] [PMC free article] [PubMed] [Google Scholar]
- 23.Castellucci GA, Calbick D & McCormick D The temporal organization of mouse ultrasonic vocalizations. PloS one 13, e0199929, doi: 10.1371/journal.pone.0199929 (2018). [DOI] [PMC free article] [PubMed] [Google Scholar]
- 24.Guo Z & Holy TE Sex selectivity of mouse ultrasonic songs. Chemical senses 32, 463–473, doi: 10.1093/chemse/bjm015 (2007). [DOI] [PubMed] [Google Scholar]
- 25.Nyby J, Wysocki CJ, Whitney G, Dizinno G & Schneider J Elicitation of male mouse ultrasonic vocalizations: I. Urinary cues. J Comp Physiol Psychol 93, 957–975 (1979). [Google Scholar]
- 26.Sirotin YB, Costa ME & Laplagne DA Rodent ultrasonic vocalizations are bound to active sniffing behavior. Front Behav Neurosci 8, 399, doi: 10.3389/fnbeh.2014.00399 (2014). [DOI] [PMC free article] [PubMed] [Google Scholar]
- 27.Hefft S & Jonas P Asynchronous GABA release generates long-lasting inhibition at a hippocampal interneuron-principal neuron synapse. Nature neuroscience 8, 1319–1328, doi: 10.1038/nn1542 (2005). [DOI] [PubMed] [Google Scholar]
- 28.Atasoy D, Betley JN, Su HH & Sternson SM Deconstruction of a neural circuit for hunger. Nature 488, 172–177, doi: 10.1038/nature11270 (2012). [DOI] [PMC free article] [PubMed] [Google Scholar]
- 29.Letzkus JJ, Wolff SB & Luthi A Disinhibition, a Circuit Mechanism for Associative Learning and Memory. Neuron 88, 264–276, doi: 10.1016/j.neuron.2015.09.024 (2015). [DOI] [PubMed] [Google Scholar]
Methods References:
- 30.Chabout J, Jones-Macopson J & Jarvis ED Eliciting and Analyzing Male Mouse Ultrasonic Vocalization (USV) Songs. J Vis Exp, doi: 10.3791/54137 (2017). [DOI] [PMC free article] [PubMed] [Google Scholar]
- 31.Yin X et al. Maternal Deprivation Influences Pup Ultrasonic Vocalizations of C57BL/6J Mice. PloS one 11, e0160409, doi: 10.1371/journal.pone.0160409 (2016). [DOI] [PMC free article] [PubMed] [Google Scholar]
- 32.Cetin A & Callaway EM Optical control of retrogradely infected neurons using drug-regulated “TLoop” lentiviral vectors. Journal of neurophysiology 111, 2150–2159, doi: 10.1152/jn.00495.2013 (2014). [DOI] [PMC free article] [PubMed] [Google Scholar]
- 33.Knowland D et al. Distinct Ventral Pallidal Neural Populations Mediate Separate Symptoms of Depression. Cell 170, 284–297 e218, doi: 10.1016/j.cell.2017.06.015 (2017). [DOI] [PMC free article] [PubMed] [Google Scholar]
- 34.Kim CK et al. Simultaneous fast measurement of circuit dynamics at multiple sites across the mammalian brain. Nature methods 13, 325–328, doi: 10.1038/nmeth.3770 (2016). [DOI] [PMC free article] [PubMed] [Google Scholar]
- 35.Xue M, Atallah BV & Scanziani M Equalizing excitation-inhibition ratios across visual cortical neurons. Nature 511, 596–600, doi: 10.1038/nature13321 (2014). [DOI] [PMC free article] [PubMed] [Google Scholar]
Extended Data References:
- 36.Hurst JL & Beynon RJ Scent wars: the chemobiology of competitive signalling in mice. BioEssays : news and reviews in molecular, cellular and developmental biology 26, 1288–1298, doi: 10.1002/bies.20147 (2004). [DOI] [PubMed] [Google Scholar]
- 37.Nyby J et al. Stimuli for male mouse (Mus musculus) ultrasonic courtship vocalizations: presence of female chemosignals and/or absence of male chemosignals. J Comp Physiol Psychol 95, 623–629, doi: 10.1037/h0077794 (1981). [DOI] [PubMed] [Google Scholar]
- 38.Reynolds E Urination as a social response in mice. Nature 234, 481–483, doi: 10.1038/234481a0 (1971). [DOI] [PubMed] [Google Scholar]
- 39.Gordon-Fennell AG et al. The Lateral Preoptic Area: A Novel Regulator of Reward Seeking and Neuronal Activity in the Ventral Tegmental Area. Frontiers in neuroscience 13, 1433, doi: 10.3389/fnins.2019.01433 (2019). [DOI] [PMC free article] [PubMed] [Google Scholar]
- 40.Hileman SM, McManus CJ, Goodman RL & Jansen HT Neurons of the lateral preoptic area/rostral anterior hypothalamic area are required for photoperiodic inhibition of estrous cyclicity in sheep. Biology of reproduction 85, 1057–1065, doi: 10.1095/biolreprod.111.092031 (2011). [DOI] [PMC free article] [PubMed] [Google Scholar]
- 41.Ono T, Nakamura K, Nishijo H & Fukuda M Hypothalamic neuron involvement in integration of reward, aversion, and cue signals. Journal of neurophysiology 56, 63–79, doi: 10.1152/jn.1986.56.1.63 (1986). [DOI] [PubMed] [Google Scholar]
- 42.Osaka T et al. Lateral preoptic neurons inhibit thirst in the rat. Brain research bulletin 31, 135–144, doi: 10.1016/0361-9230(93)90020-c (1993). [DOI] [PubMed] [Google Scholar]
- 43.Szymusiak R, Gvilia I & McGinty D Hypothalamic control of sleep. Sleep Med 8, 291–301, doi: 10.1016/j.sleep.2007.03.013 (2007). [DOI] [PubMed] [Google Scholar]
- 44.Pomerantz SM, Nunez AA & Bean NJ Female behavior is affected by male ultrasonic vocalizations in house mice. Physiol Behav 31, 91–96, doi: 10.1016/0031-9384(83)90101-4 (1983). [DOI] [PubMed] [Google Scholar]
- 45.Sangiamo DT, Warren MR & Neunuebel JP Ultrasonic signals associated with different types of social behavior of mice. Nature neuroscience 23, 411–422, doi: 10.1038/s41593-020-0584-z (2020). [DOI] [PMC free article] [PubMed] [Google Scholar]
- 46.Neunuebel JP, Taylor AL, Arthur BJ & Egnor SE Female mice ultrasonically interact with males during courtship displays. eLife 4, doi: 10.7554/eLife.06203 (2015). [DOI] [PMC free article] [PubMed] [Google Scholar]
- 47.Kohl J & Dulac C Neural control of parental behaviors. Current opinion in neurobiology 49, 116–122, doi: 10.1016/j.conb.2018.02.002 (2018). [DOI] [PMC free article] [PubMed] [Google Scholar]
- 48.Tan CL & Knight ZA Regulation of Body Temperature by the Nervous System. Neuron 98, 31–48, doi: 10.1016/j.neuron.2018.02.022 (2018). [DOI] [PMC free article] [PubMed] [Google Scholar]
- 49.Yu S, Francois M, Huesing C & Munzberg H The Hypothalamic Preoptic Area and Body Weight Control. Neuroendocrinology 106, 187–194, doi: 10.1159/000479875 (2018). [DOI] [PMC free article] [PubMed] [Google Scholar]
- 50.Jurgens U The role of the periaqueductal grey in vocal behaviour. Behavioural brain research 62, 107–117, doi: 10.1016/0166-4328(94)90017-5 (1994). [DOI] [PubMed] [Google Scholar]
- 51.Jurgens U The neural control of vocalization in mammals: a review. J Voice 23, 1–10, doi: 10.1016/j.jvoice.2007.07.005 (2009). [DOI] [PubMed] [Google Scholar]
- 52.Bandler R & Shipley MT Columnar organization in the midbrain periaqueductal gray: modules for emotional expression? Trends in neurosciences 17, 379–389, doi: 10.1016/0166-2236(94)90047-7 (1994). [DOI] [PubMed] [Google Scholar]
- 53.Inagaki HK et al. Optogenetic control of Drosophila using a red-shifted channelrhodopsin reveals experience-dependent influences on courtship. Nature methods 11, 325–332, doi: 10.1038/nmeth.2765 (2014). [DOI] [PMC free article] [PubMed] [Google Scholar]
Associated Data
This section collects any data citations, data availability statements, or supplementary materials included in this article.
Supplementary Materials
Data Availability Statement
The data in this study is available from the corresponding author upon request.


