Abstract
Aims/Introduction
The influence of repeated insulin injection on subcutaneous tissue is known, but its impact on the skin is unclear. Therefore, this study aimed to elucidate the impact of repeated insulin injections on the skin.
Material and Methods
The properties of the skin and the subcutaneous tissue were evaluated in 52 insulin‐treated adult patients with diabetes with abnormal findings at the site of self‐injection (36 with subcutaneous nodules, 16 with suspected subcutaneous tissue induration) by ultrasonography. In all subjects, both normal and abnormal areas were examined. In addition, skin biopsies were performed in four subjects.
Results
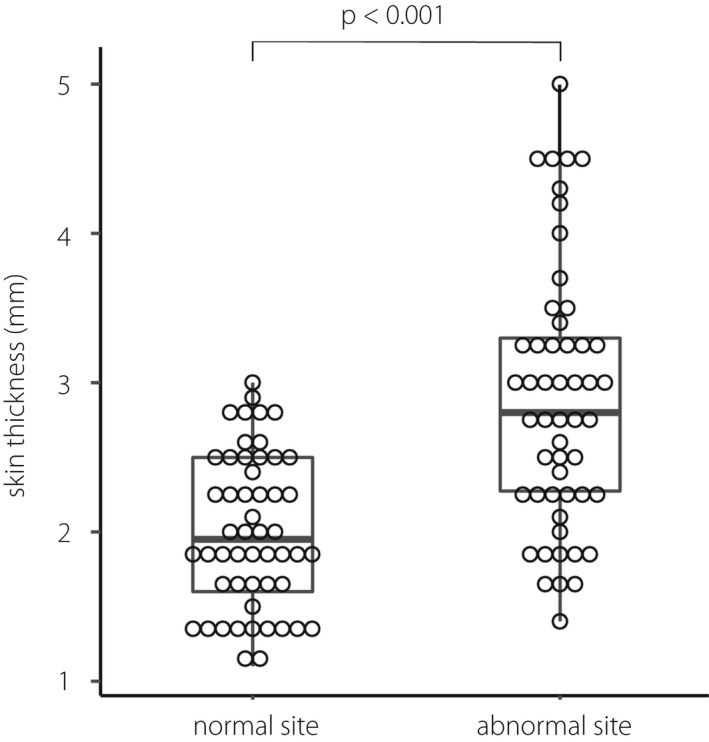
The skin thickness of the normal and abnormal skin sites was 1.95 (1.60, 2.50) and 2.80 (2.27, 3.30) mm, respectively (median (first quartile, third quartile)), (P < 0.001). The biopsy specimens revealed slightly thickened and tight bundles of collagen in the dermis. Three patients had amyloid deposits in the subcutaneous tissue, and one also showed these in the dermis. These were positively stained for insulin antibody.
Conclusions
Repeated insulin injection procedures result in skin thickening. Increased collagen fibers and possibly amyloid deposition in the dermis may be involved. The results reaffirmed the importance of appropriate site rotation in insulin injection and revealed the usefulness of ultrasonographic skin examination in evaluating the self‐injection procedure.
Keywords: Amyloidosis, Lipohypertrophy, Skin thickness
Repeated insulin injection without rotation increases skin thickness.
![]()
INTRODUCTION
In recent years, the treatment of patients with type 2 diabetes has diversified with the advent of hypoglycemic agents showing new mechanisms of action 1 . However, since insulin secretion decreases over time in many people with type 2 diabetes 2 , insulin injections continue to play an essential role in the treatment of diabetes. Known cutaneous problems associated with insulin injection include allergic reactions, lipoatrophy, lipohypertrophy, and subcutaneous amyloid deposits 3 , 4 . The frequency of cutaneous reactions arising from an immune response to the insulin preparation, local cutaneous allergies and lipoatrophy, was decreased markedly 3 following the development of insulin preparations 5 . However, inappropriate injection procedures, such as improper injection site rotation, causing lipohypertrophy and subcutaneous amyloid deposition are still observed frequently 4 , 6 . These cutaneous complications could be one of the causes of unexplained blood glucose fluctuation as insulin absorption is impaired under these pathological conditions 7 , 8 .
As insulin injection‐associated cutaneous lesions have been evaluated with visual inspection and palpation, inter‐clinician variation inevitably arises in detection and assessment. Evaluation of a subcutaneous change at the insulin injection site by ultrasonography has been tried 9 , 10 , 11 , 12 and the objective assessment of these lesions is becoming possible. Nevertheless, there have been few reports on skin changes at the insulin injection sites. Skin thickness at the insulin injection site is a clinically significant issue 13 , 14 . The mean abdominal skin thickness of adult patients with diabetes, both non‐insulin‐treated and insulin‐treated, has been reported to be 2.15 mm 13 . In contrast, some cases presented in which the skin was thickened at the repeated insulin injected site 9 , 11 although the skin thickness was not quantified in these cases.
This study aimed to clarify the influence of repeated insulin injection on the skin, in addition to subcutaneous tissue, by comparing ultrasonographic images and skin biopsy findings.
MATERIAL AND METHODS
Participants
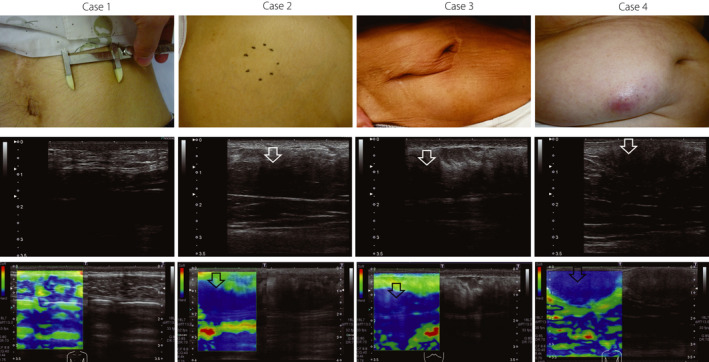
From 2015 to 2019, 468 patients with diabetes had their insulin injection sites evaluated by inspection and palpation at the outpatient department of Takamatsu Hospital. Fifty‐two patients who had abnormalities at the injection sites were investigated in this study. Thirty‐six patients had subcutaneous induration with an appreciable boundary (Group 1), 16 patients did not have apparent induration, but the skin/subcutaneous tissue was hard on palpation (Group 2, exemplified in Figure 1). All participants injected insulin through the abdominal wall. The insulin injection sites should be rotated systematically by spacing them at least 1 cm from each other 15 , but the patient interviews confirmed inappropriate rotation of the insulin injection sites. Nine of 36 subjects in Group 1 and three of 16 subjects in Group 2 did not rotate the injection site. Twenty‐seven subjects in Group 1 and ten subjects in Group 2 were rotating the injection site in two or three places. Three subjects of Group 2 were rotating in more than four places. On needle exchange, 31 subjects in Group 1 and 13 subjects in Group 2 exchanged injection needles every time, and the others exchanged once every two or three times. The diagnosis of type 1 and type 2 diabetes was made based on the criteria defined by the Japan Diabetes Society 16 .
Figure 1.

Visual appearance, ultrasonographic, and elastographic images of biopsied cases. Upper row, visual appearance. Calipers in case 1 indicate the range of subcutaneous induration. Black dots in case 2 represent the border of subcutaneous induration. Middle row, ultrasonographic image. White arrows indicate low echogenicity of subcutaneous tissue. Lower row, image by elastography. Black arrows show increased tissue hardness (colored in blue by elastography). Skin thickness of case 1, 2, 3, and 4 were 1.6, 2.4, 2.6, and 2.3 mm, respectively. Cases 1 and 2 belong to Group 2, and cases 3 and 4 belong to Group 1.
Ultrasonographic examination
A cross‐sectional image of the skin and the subcutaneous tissue was obtained by the B‐mode method in a recumbent position, and the images were taken in a resting state of exhalation. Skin thickness, subcutaneous tissue thickness, skin and subcutaneous tissue boundary, and the layered structure and echo brightness of the subcutaneous tissue were evaluated (Figure 2, left image). Since the epidermis and dermis are visualized as one on ultrasonic examination, the skin thickness is the combination of the epidermis and dermis. When the boundary between the skin and the subcutaneous tissue was obscure, the nearest distinct boundary was measured. We defined the subcutaneous tissue thickness as the distance from the deepest part of the dermis to the deepest part of the fascia. The area 5 cm to the right or left of the navel with no skin abnormality, where subjects reported that they did not inject insulin, was also evaluated as a person‐specific control (normal site).
Figure 2.

Image of the skin and subcutaneous tissue by ultrasonography. Left, normal site. The boundary between the skin and subcutaneous tissue is clear, and the layer structure of the subcutaneous tissue is retained. Skin thickness is 2.3 mm. (1) Skin (dermis and epidermis); (2) subcutaneous tissue; (3) muscle layer; arrowhead, a layer of connective tissue in subcutaneous tissue; arrow, fascia. Middle, abnormal site. The boundary between the skin and subcutaneous tissue and the layered structure of subcutaneous tissue is ill defined. Skin thickness increases to 4.5 mm. Right, a typical image of an abnormal site. The boundary between the skin and subcutaneous tissue is unclear, the layered structure of subcutaneous tissue cannot be identified, and the echogenicity of subcutaneous tissue is lower than the normal site.
The ultrasonic diagnostic equipment used was a TUS‐A300 (Toshiba Medical Systems Corporation, Japan), and the probe used was a linear type with a center frequency of 12 MHz (PLT‐1204BT). The depth of field was set to 3 to 3.5 cm, and three focus points were set, with the first point at 0 cm of the depth of field. The hardness of subcutaneous tissue was also evaluated by tissue elasticity imaging (elastography). Two trained sonographers performed the ultrasonographic examinations in this study in each patient.
Skin biopsy
A skin biopsy was performed in four subjects with a palpable subcutaneous induration. The specimens were fixed in formalin and embedded in paraffin. The sections were stained with hematoxylin and eosin and with Congo red to detect amyloid deposition. Immunohistochemical analysis was performed with a monoclonal antibody to human insulin (Novocastra Co., UK).
Statistical analysis
Continuous variables are expressed as the median (first quartile, third quartile). The skin thicknesses of the normal and abnormal sites of each subject were compared using the Wilcoxon signed‐ranks test. In comparing continuous variables between two groups, the Mann‐Whitney U‐test was used. Multiple regression analysis was performed with the affected skin thickness as the objective variable, BMI (body mass index), HbA1c, frequency of insulin injection per day, duration of insulin treatment, and the daily insulin dose as explanatory variables. Values of P were considered significant at less than 0.05. All statistical analyses were conducted using R (The R Foundation for Statistical Computing, Vienna, Austria).
This study was reviewed and approved by the Ethics Committee of Takamatsu Hospital (approval number E‐147), and written consent was obtained from the participants.
RESULTS
Participant characteristics
The BMI of the subjects was 24.7 (22.3, 26.8) kg/m2, the HbA1c was 8.70 (7.80, 10.27) %, duration of insulin injection was 10.0 (6.0, 18.0) years, the frequency of insulin injection was 4.0 (2.0, 4.0) times per day, and the total dose of daily insulin was 0.63 (0.50, 0.90) units per kg body weight (Table 1).
Table 1.
Characteristics of subjects
| All | Group 1 | Group 2 | |
|---|---|---|---|
| n | 52 | 36 | 16 |
| Men/Women | 33/19 | 20/16 | 13/3 |
| Type 1/Type 2 diabetes | 12/40 | 7/29 | 5/11 |
| Age (years old) | 68.0 (59.5, 77.3) | 73.0 (62.8, 82.0) | 57.0 # (50.8, 67.0) |
| BMI (kg/m2) | 24.7 (22.3, 26.8) | 24.4 (21.5, 26.4) | 25.1 (23.1, 31.5) |
| HbA1c (%) | 8.70 (7.80, 10.27) | 8.75 (7.88, 10.27) | 8.60 (7.52, 10.38) |
| Duration of insulin therapy (years) | 10.0 (6.0, 18.0) | 10.0 (6.0, 15.5) | 10.5 (6.8, 20.3) |
| Daily dose of insulin (units) | 43.5 (26.0, 56.3) | 39.5 (25.5, 56.3) | 46.0 (33.5, 53.3) |
| Insulin injection (times/day) | 4.00 (2.00, 4.00) | 3.00 (2.00, 4.00) | 4.00 (2.00, 4.00) |
| Daily insulin dose (units per kg BW) | 0.63 (0.50, 0.90) | 0.64 (0.53, 0.89) | 0.62 (0.39, 0.87) |
| Diabetic retinopathy (−/+) | 15/37 | 11/25 | 4/12 |
| Diabetic nephropathy (−/+) | 26/26 | 21/15 | 5/11 |
| Skin thickness of normal site (mm) | 1.95 (1.60, 2.50) | 1.85 (1.48, 2.32) | 2.30 (1.78, 2.65) |
| Skin thickness of abnormal site (mm) | 2.80 * (2.27, 3.30) | 2.65 (2.18, 3.05) | 3.40 # (2.72, 4.05) |
| Subcutaneous tissue thickness of normal site (mm) | 15.50 (12.00, 18.25) | 16.15 (12.75, 18.00) | 14.45 (12.00, 19.25) |
| Subcutaneous tissue thickness of abnormal site (mm) | 16.00 (12.73, 19.00) | 16.00 (13.00, 18.25) | 17.10 (12.07, 20.50) |
Median (first quartile, third quartile). *P < 0.001 vs normal site; # P < 0.05 vs Group 1. BMI, body mass index; BW, body weight.
Skin and subcutaneous tissue thicknesses by ultrasonography
At the normal site, the skin and subcutaneous tissue thicknesses were 1.95 (1.60, 2.50) and 15.50 (12.00, 18.25) mm, respectively. At the abnormal site, the skin and subcutaneous tissue thicknesses were 2.80 (2.27, 3.30) and 16.00 (12.73, 19.00) mm, respectively. The skin of the abnormal site was significantly thicker than the normal site in each subject (P < 0.001, Figure 3). An example ultrasonographic image is shown in Figure 2 (middle image).
Figure 3.

Skin thickness of normal and abnormal site.
Multivariate analysis revealed no correlation among BMI, HbA1c, frequency of insulin injection per day, duration of insulin treatment, a daily dose of insulin, and the skin thickness of the abnormal site.
At the abnormal sites, the boundary between the skin and the subcutaneous tissue was indistinct compared with the normal site, or the layered structure of the subcutaneous tissue was not retained (Figure 2, middle and right image), except for in four of 16 patients in Group 2. In these four patients, the echo brightness of the subcutaneous tissue was reduced. Accordingly, all cases showed some abnormality in the subcutaneous tissue by ultrasonographic examination.
Histological findings of the skin biopsy and comparison with ultrasonographic findings
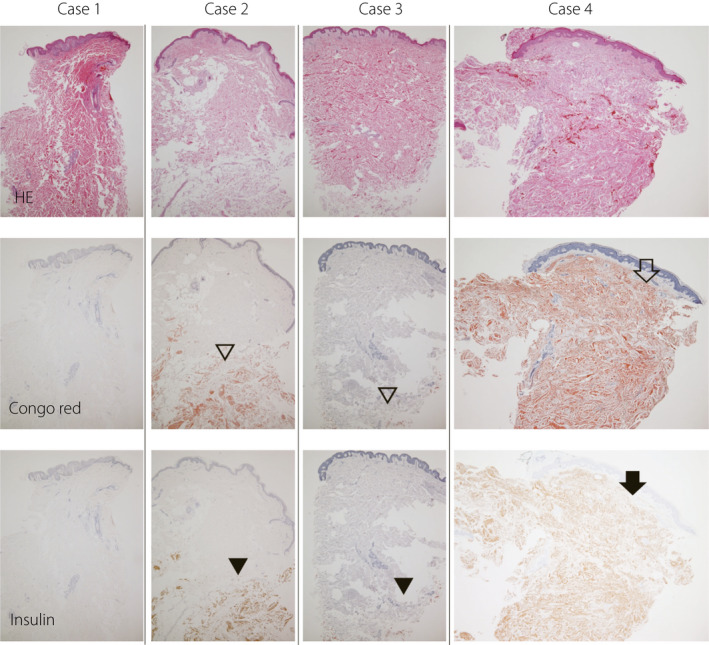
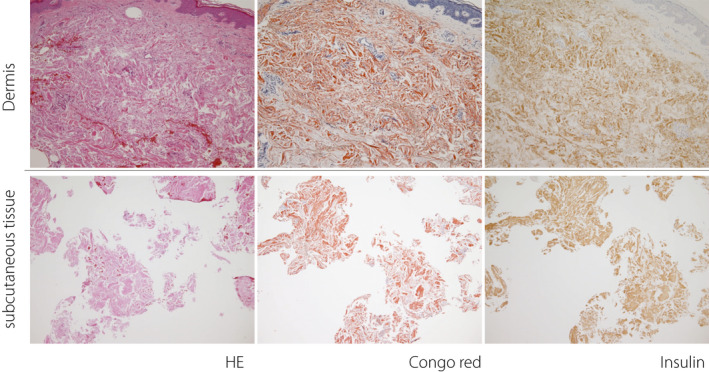
Skin biopsies were performed in four subjects with a palpable or suspected subcutaneous induration (Figure 4). Three of the four patients showed eosinophilic amorphous material in the subcutaneous tissue, which was confirmed as amyloid material by Congo red stain. In addition, the amyloid material was positive for insulin by immunohistochemistry, confirming that the amyloid material was derived from insulin. In the dermis, all cases exhibited varying degrees of a thick and tight collagen bundle, and one patient showed diffuse amyloid deposition in the entire dermis (case 4 in Figure 4). High power magnification images from case 4 are shown in Figure 5. In the cases with amyloid deposits, the echo brightness of the subcutaneous tissue was decreased markedly, and the tissue hardness evaluated by elastography was increased (Figure 1).
Figure 4.

Histological examination of biopsied skin and subcutaneous tissue. The upper row shows hematoxylin‐eosin staining (HE), the middle row shows Congo red staining, and the lower row shows immunohistochemistry for insulin. Fibrosis was observed in the dermis in all four cases. Amyloid deposition in the subcutaneous tissue was observed in cases 2 to 4 (unfilled arrowhead), which was positive for insulin antibody by immunohistochemistry (filled arrowhead). In case 4, amyloid (unfilled arrow) and insulin (filled arrow) were also present in the dermis.
Figure 5.

Larger magnification images of case 4. The upper row shows the dermis. The lower rows show subcutaneous tissue. The left column shows hematoxylin–eosin stain (HE), the middle column shows Congo red stain, and the right column shows immunohistochemistry for insulin. Slightly thickened and tight collagen fibers are observed in the dermis. In addition, amyloid deposition was found at sites positively stained by immunohistochemistry for insulin.
DISCUSSION
The skin and subcutaneous tissue changes of insulin‐treated adult subjects with diabetes were evaluated by ultrasonography and skin biopsy. Ultrasonography revealed that the boundary between the skin and subcutaneous tissue became indistinct, and the layered structure of the subcutaneous tissue was not retained at the site of repeated insulin injection even in patients without apparent subcutaneous nodule formation. The echo brightness of the histologically proven massive subcutaneous amyloid deposition was markedly lower. In addition, the skin thickness was increased at these repeated insulin injection sites. Histological evaluation of the thickened skin revealed an increased collagen fiber density in the dermis and, in one case, intradermal amyloid deposition.
Insulin must be administered into undamaged subcutaneous tissue to exert its effect. Reduced vessel density has been reported at sites of lipohypertrophy or amyloid deposition by histological evaluation 4 , 17 or ultrasonographic examination 11 , resulting in the inadequate absorption of injected insulin and unexplained blood glucose fluctuation. However, assessment of lipohypertrophy by palpation can overlook the lesion 12 , 18 . Moreover, we sometimes encounter improved glycemic control by changing the insulin injection site in patients without apparent subcutaneous lesions. Therefore, it is clinically essential to identify damaged subcutaneous tissue caused by repeated insulin injections.
Subcutaneous tissue assessment by ultrasonography has been performed as a more objective method to detect insulin injection‐related changes. Lipohypertrophic areas have been reported to present various echogenicity, possibly reflecting the different degrees of adipose tissue and collagenous fiber contents 10 , 12 . In insulin‐derived local amyloidosis, lower echogenicity with a higher tissue elasticity or a higher echogenicity with normal tissue elasticity has been reported, presumably reflecting the amount of deposited amyloid 11 . Therefore, insulin injection‐related subcutaneous lipohypertrophy and amyloid deposition reveal varying subcutaneous tissue echogenicity and elasticity according to the degree of fibrous tissue and amyloid content. However, considering previous reports 11 , 19 and our results, massive subcutaneous amyloid deposition can be diagnosed by an amorphous area with very low echogenicity and increased elasticity.
An indistinct border between the skin and subcutaneous tissue and a damaged layered subcutaneous tissue structure was frequently observed at the site of repeated insulin injection. These changes were reported in patients with an inappropriate insulin injection procedure 9 and subcutaneous amyloid deposition 11 , 18 . These findings seem to be valuable characteristics for detecting damaged subcutaneous tissue in cases of insulin injection without rotation, even when subcutaneous nodules are considered absent.
The skin thickness of the abdomen has been reported to be 2.15 ± 0.42 mm regardless of the insulin treatment 13 . Moreover, in 20 patients with diabetes with subcutaneous lipohypertrophy, the skin thickness of the lipohypertrophic sites has been reported to be 2.4 ± 0.4 mm 10 . Our study showed that the skin thickness was increased by repeated insulin injection area. In the histological examination, the collagen fibers of the dermis were thick and tight to varying degrees, and in one case, amyloid deposits were observed in the dermis. The needles used for subcutaneous insulin injection have been improved and become thinner. However, repeated needle insertion into the subcutaneous tissue inevitably causes minor tissue damage, resulting in fibrosis of the dermis during the wound healing process. In addition, a small amount of insulin may leak into the dermis during the injection process, which may lead to amyloid formation in the dermis. These phenomena ultimately can cause increased skin thickness. Our findings suggest that intradermal insulin injection could occur in such patients. Few studies have been conducted on the blood dynamics of intradermally administered insulin, but the rapid absorption of continuously injected intradermal insulin compared with continuous subcutaneous injection has been reported 20 , 21 . However, the insulin absorption kinetics from thickened skin with increased collagen fiber or amyloid deposition is unknown. Injection to such a site should be avoided by appropriate site rotation.
Study limitations
An inappropriate insulin injection procedure, repeating insulin injections in the same place without rotation, can only be confirmed by interview. It was difficult to quantify and to evaluate the injection procedure: the needle insertion angle, depth, and exact frequency of injections at the same site. It was also difficult to quantify the visual inspection and palpation findings objectively. Interpretation of ultrasonographic images also involves similar problems. Since not all cases were biopsied, the mechanisms of increasing skin thickness may exist other than those mentioned above.
In conclusion, even when apparent subcutaneous induration is absent, repeated insulin injection without site rotation affects the skin and subcutaneous tissue. The skin can thicken according to repeated insulin injection, and fibrosis in the dermis and amyloid deposition in the subcutaneous tissue and dermis play a role in skin thickening at the insulin injection site. Therefore, in addition to confirming the retained border between the skin and subcutaneous tissue and the layered structure of the subcutaneous tissue, evaluating the skin thickness by ultrasonography can be an objective method to examine the appropriateness of the site rotation.
DISCLOSURE
The authors declare no conflict of interest.
Approval of the research protocol: This study was reviewed and approved by the Ethics Committee of Takamatsu Hospital (approval number E‐147, October 30, 2016).
Informed consent: Written informed consent was obtained from all subjects.
Approval date of registry and the registration number of the study/trial: N/A.
Animal studies: N/A.
J Diabetes Investig. 2022; 13: 997–1003
REFERENCES
- 1. American Diabetes Association . Pharmacologic approaches to glycemic treatment: standards of medical care in diabetes – 2021. Diabetes Care 2021; 44: S111–S124. [DOI] [PubMed] [Google Scholar]
- 2. Fonseca VA. Defining and characterizing the progression of type 2 diabetes. Diabetes Care 2009; 32(Suppl 2): S151–S156. [DOI] [PMC free article] [PubMed] [Google Scholar]
- 3. Richardson T, Kerr D. Skin‐related complications of insulin therapy: epidemiology and emerging management strategies. Am J Clin Dermatol 2003; 4: 661–667. [DOI] [PubMed] [Google Scholar]
- 4. Ansari AM, Osmani L, Matsangos AE, et al. Current insight in the localized insulin‐derived amyloidosis (LIDA): clinico‐pathological characteristics and differential diagnosis. Pathol Res Pract 2017; 213: 1237–1241. [DOI] [PubMed] [Google Scholar]
- 5. Zaykov AN, Mayer JP, DiMarchi RD. Pursuit of a perfect insulin. Nat Rev Drug Discov 2016; 15: 425–439. [DOI] [PubMed] [Google Scholar]
- 6. Gentile S, Guarino G, Corte TD, et al. Insulin‐induced skin lipohypertrophy in type 2 diabetes: a multicenter regional survey in Southern Italy. Diabetes Ther 2020; 11: 2001–2017. [DOI] [PMC free article] [PubMed] [Google Scholar]
- 7. Nagase T, Iwaya K, Iwaki Y, et al. Insulin‐derived amyloidosis and poor glycemic control: a case series. Am J Med 2014; 127: 450–454. [DOI] [PubMed] [Google Scholar]
- 8. Famulla S, Hovelmann U, Fischer A, et al. Insulin injection into lipohypertrophic tissue: blunted and more variable insulin absorption and action and impaired postprandial glucose control. Diabetes Care 2016; 39: 1486–1492. [DOI] [PubMed] [Google Scholar]
- 9. Perciun R. Ultrasonographic aspect of subcutaneous tissue dystrophies as a result of insulin injections. Med Ultrason 2010; 12: 104–109. [PubMed] [Google Scholar]
- 10. Bertuzzi F, Meneghini E, Bruschi E, et al. Ultrasound characterization of insulin induced lipohypertrophy in type 1 diabetes mellitus. J Endocrinol Investig 2017; 40: 1107–1113. [DOI] [PubMed] [Google Scholar]
- 11. Kikuchi M, Hirokawa N, Hagiwara S, et al. Ultrasonography improves glycemic control by detecting insulin‐derived localized amyloidosis. Ultrasound Med Biol 2017; 43: 2284–2294. [DOI] [PubMed] [Google Scholar]
- 12. Kapeluto JE, Paty BW, Chang SD, et al. Ultrasound detection of insulin‐induced lipohypertrophy in type 1 and type 2 diabetes. Diabetes Med 2018; 35: 1383–1390. [DOI] [PubMed] [Google Scholar]
- 13. Gibney MA, Arce CH, Byron KJ, et al. Skin and subcutaneous adipose layer thickness in adults with diabetes at sites used for insulin injections: implications for needle length recommendations. Curr Med Res Opin 2010; 26: 1519–1530. [DOI] [PubMed] [Google Scholar]
- 14. Hirsch L, Byron K, Gibney M. Intramuscular risk at insulin injection sites – measurement of the distance from skin to muscle and rationale for shorter‐length needles for subcutaneous insulin therapy. Diabetes Technol Ther 2014; 16: 867–873. [DOI] [PubMed] [Google Scholar]
- 15. Hirsch LJ, Strauss KW. The injection technique factor: what you don't know or teach can make a difference. Clin Diabetes 2019; 37: 227–233. [DOI] [PMC free article] [PubMed] [Google Scholar]
- 16. Committee of the Japan Diabetes Society on the Diagnostic Criteria of Diabetes Mellitus. Report of the committee on the classification and diagnostic criteria of diabetes mellitus. J Diabetes Investig 2010; 1: 212–228. [DOI] [PMC free article] [PubMed] [Google Scholar]
- 17. Wallymahmed ME, Littler P, Clegg C, et al. Nodules of fibrocollagenous scar tissue induced by subcutaneous insulin injections: a cause of poor diabetic control. Postgrad Med J 2004; 80: 732–733. [DOI] [PMC free article] [PubMed] [Google Scholar]
- 18. Nagase T, Iwaya K, Kogure K, et al. Insulin‐derived amyloidosis without a palpable mass at the insulin injection site: a report of two cases. J Diabetes Investig 2020; 11: 1002–1005. [DOI] [PMC free article] [PubMed] [Google Scholar]
- 19. Nagase T, Katsura Y, Iwaki Y, et al. The insulin ball. Lancet 2009; 373: 184. [DOI] [PubMed] [Google Scholar]
- 20. Rini CJ, McVey E, Sutter D, et al. Intradermal insulin infusion achieves faster insulin action than subcutaneous infusion for 3‐day wear. Drug Deliv Transl Res 2015; 5: 332–345. [DOI] [PMC free article] [PubMed] [Google Scholar]
- 21. Kochba E, Levin Y, Raz I, et al. Improved insulin pharmacokinetics using a novel microneedle device for intradermal delivery in patients with type 2 diabetes. Diabetes Technol Ther 2016; 18: 525–531. [DOI] [PMC free article] [PubMed] [Google Scholar]


