

Abstract
Objective:
Many calibration models for cuff-less blood pressure (BP) measurement must be periodically updated with cuff BP values to account for vascular aging. However, the time period required for these “cuff recalibrations” is largely unknown. The impact of one year of aging on several calibration models was assessed.
Methods:
Ten humans (6 males, 57±18 years, 3 hypertensives) were studied during multiple recording sessions that occurred one year apart. In each session, electrocardiography (ECG), ear photoplethysmography (PPG), finger PPG, and toe PPG waveforms and manual cuff BP were recorded before and after slow breathing, mental arithmetic, cold pressor, and nitroglycerin. Linear models based on each PPG waveform, which were previously shown to offer value in predicting the intervention-induced BP changes in a larger subject cohort, were employed. The model coefficients were determined for each subject via one session, and the fully-defined, subject-specific calibration models were then evaluated in the corresponding subjects via the session one year later.
Results:
Only a linear model relating toe pulse arrival time (PAT) – time delay between ECG R-wave and toe PPG foot – to systolic BP (SBP) remained useful. After the year, this model changed little on average (root-mean-squared-error (RMSE) = 1.5 mmHg) and predicted the cuff BP values better than the average of the initial cuff BP values of the subject (RMSE = 9.6±0.8 mmHg vs. 12.7±1.0 mmHg; p < 0.05).
Conclusion:
These results suggest annual cuff recalibrations for the toe PAT-SBP model.
Significance:
Toe PAT may offer a practical recalibration period that fosters user adherence.
Index Terms—: aging, cuff calibration, cuff-less blood pressure, machine learning, photoplethysmography (PPG), PPG waveform analysis, pulse arrival time (PAT), pulse transit time (PTT), pulse wave analysis, wearables
I. Introduction
Pulse transit time (PTT) and photoplethysmography (PPG) waveform analysis (i.e., pulse wave analysis) are popular, potential methods for cuff-less blood pressure (BP) measurement [1]–[5]. These methods basically involve extracting at least one feature such as a time interval from one or two cardiovascular waveforms and then mapping or “calibrating” the feature(s) to BP via a mathematical model. This calibration model is typically formed using initial cuff BP measurements from the individual for whom BP monitoring is sought [6], [7]. It is well understood that the calibration model must be updated periodically to account for vascular aging effects. However, data on the time period required for these “cuff re-calibrations” are scant.
Previously, we examined conventional PTTs and single waveform features detected from electrocardiography (ECG), ear PPG, finger PPG, or toe PPG waveforms in terms of tracking manual cuff BP changes induced by a battery of challenging interventions in heterogeneous human volunteers [8], [9]. We were able to identify useful linear models based on each of the three PPG waveforms. Each model took one or two time intervals as input to predict the changes in a BP level better than baseline models in which the time intervals were excluded as input.
Here, we repeated the data collection in a subset of the same subjects on two additional occasions to quantify the impact of one year of aging on the calibration models for cuff-less BP measurement. Our most important finding is that only a linear model relating toe pulse arrival time (PAT) – the time elapsed between the ECG R-wave and toe PPG foot – to systolic BP (SBP) varied little on average and remained useful in predicting BP values after a full year.
II. Methods
In this study, we collected physiologic data from human volunteers and analyzed the data to create subject-specific calibration models and evaluate their validity later in time. We originally intended to investigate the efficacy of the calibration models formed via a first recording session one year later via a second session and two years later via a third session. However, we found model performance to be substantially worse after the first year than the second year. We concluded that the subjects were generally stressed by their initial exposure to the complex study procedures, which would increase vasomotor tone and alter the calibration models of the first session [1]. We thus treated the first session as a procedure acclimatization period and examined the validity of the calibration models created via the second session only one year later via the third session.
A. Collection of Human Data
We studied human volunteers with approval from the Institutional Review Boards (Michigan State University LEGACY14-694F and University of Rochester Medical Center RSRB#56366, 2015-) and written, informed consent from each subject. Figure 1 overviews the procedures. We collected physiologic data from 32 subjects in a previous study [8] and repeated the data collection for this study in 13 of the subjects on two additional occasions for a total of three recording sessions in these subjects that were approximately one year (i.e., 10–14 months) apart. The details of the data collection for a recording session are described in detail elsewhere [8], [9]. In short, for each session, we recorded the ECG waveform and PPG waveforms from the left middle toe, right index finger, and left earlobe and manual auscultatory cuff BP values before and after slow breathing [10], mental arithmetic [11], a cold pressor test (applied to the right foot) [12], and typically sublingual nitroglycerin [13] for a total of up to eight conditions. While we did not employ the popular post-exercise intervention for the sake of convenience in the well-instrumented subjects, mental arithmetic has some similarity in the sense that it likewise increases BP mainly via cardiac output [11].
Fig. 1. Collection of human data for assessing the impact of one year of aging on calibration models for cuff-less blood pressure (BP) measurement.
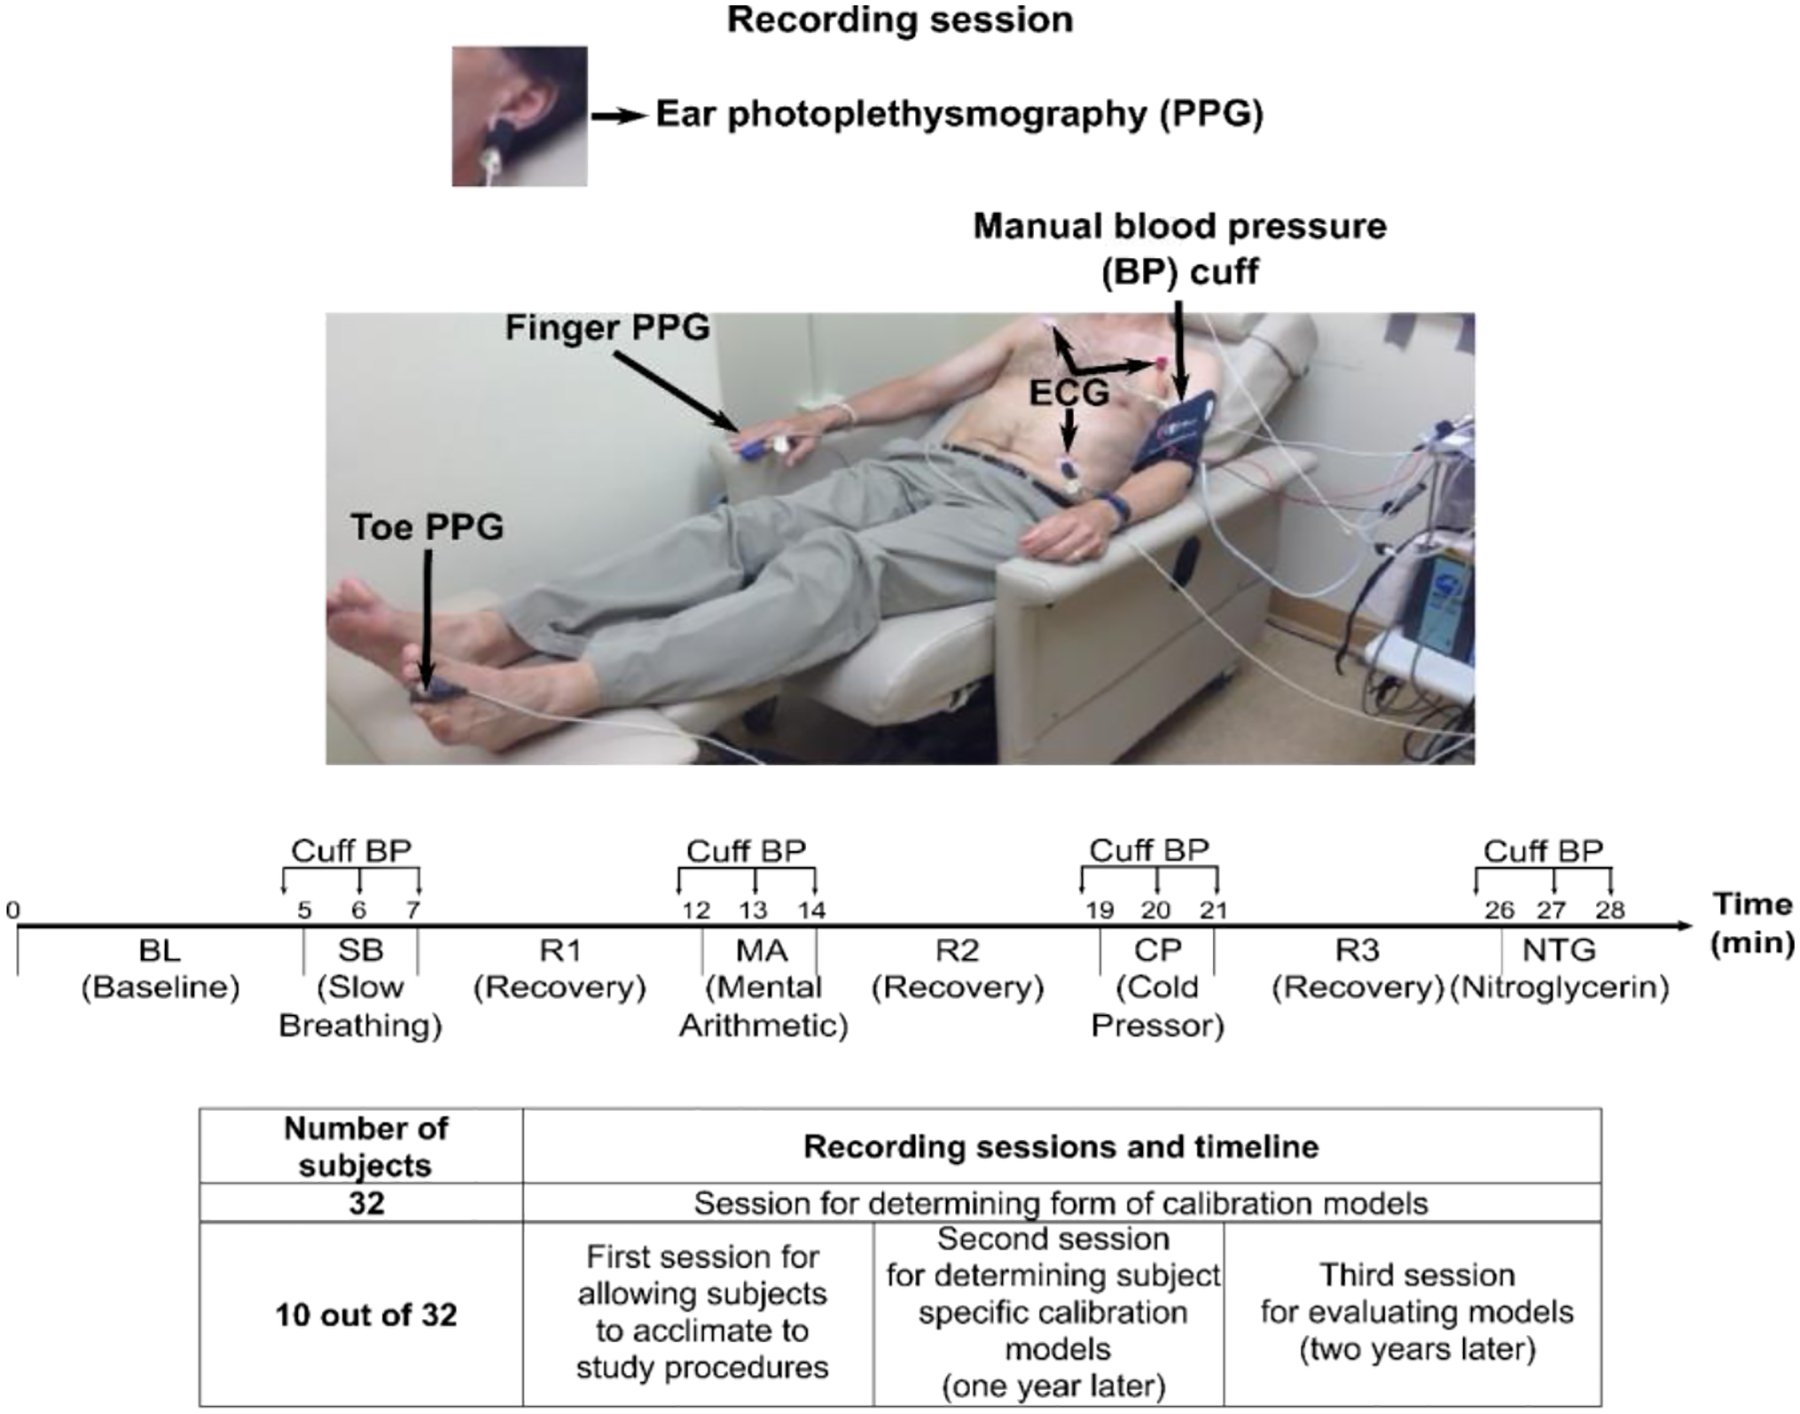
The ten repeat subjects were heterogenous (6 males, 57±18 years, 80±22 kg, 3 hypertensives). Upper panels adapted from [8].
We down-selected the data from the additional sessions. Our inclusion/exclusion criteria were the same as those in our previous studies of the data from the original session and are described in detail elsewhere [8], [9]. Briefly, we excluded all data for a given condition if at least one waveform were contaminated by gross artifact and entire subject data for a given session if there were too few remaining conditions. For this study, we also eliminated whole subject data if the second or third session were excluded. In this way, we would have a meaningful assessment and fair comparison of the impact of aging on various calibration models. Data from ten subjects (6 males, 57±18 years, 1.65±0.1 m, 80±22 kg, 3 hypertensives, 0 with peripheral arterial disease) were left for analysis.
B. Creation of Calibration Models
We employed the four linear models shown in Figure 2, which we previously found to offer value in predicting BP for the 32 subjects in the original session [9]. These models relate one or two time intervals extracted from an ECG waveform and one PPG waveform or just a PPG waveform to either SBP or diastolic BP (DBP) via unknown coefficients. The time intervals are specifically a PAT, b-time (PPG foot to minimum second derivative time interval), STT (“slope transit time”, which is the PPG amplitude divided by maximum derivative), and pulse width (PW). We robustly detected these time intervals from the waveforms as described in detail elsewhere [9]. We then determined the model coefficients for each subject and session by applying the linear least squares solution to the multiple pairs of manual cuff BP values and time intervals. We thus created four subject-specific calibration models for each of the ten subjects and each of the last two of the three total sessions.
Fig. 2. Investigated calibration models for cuff-less BP measurement.
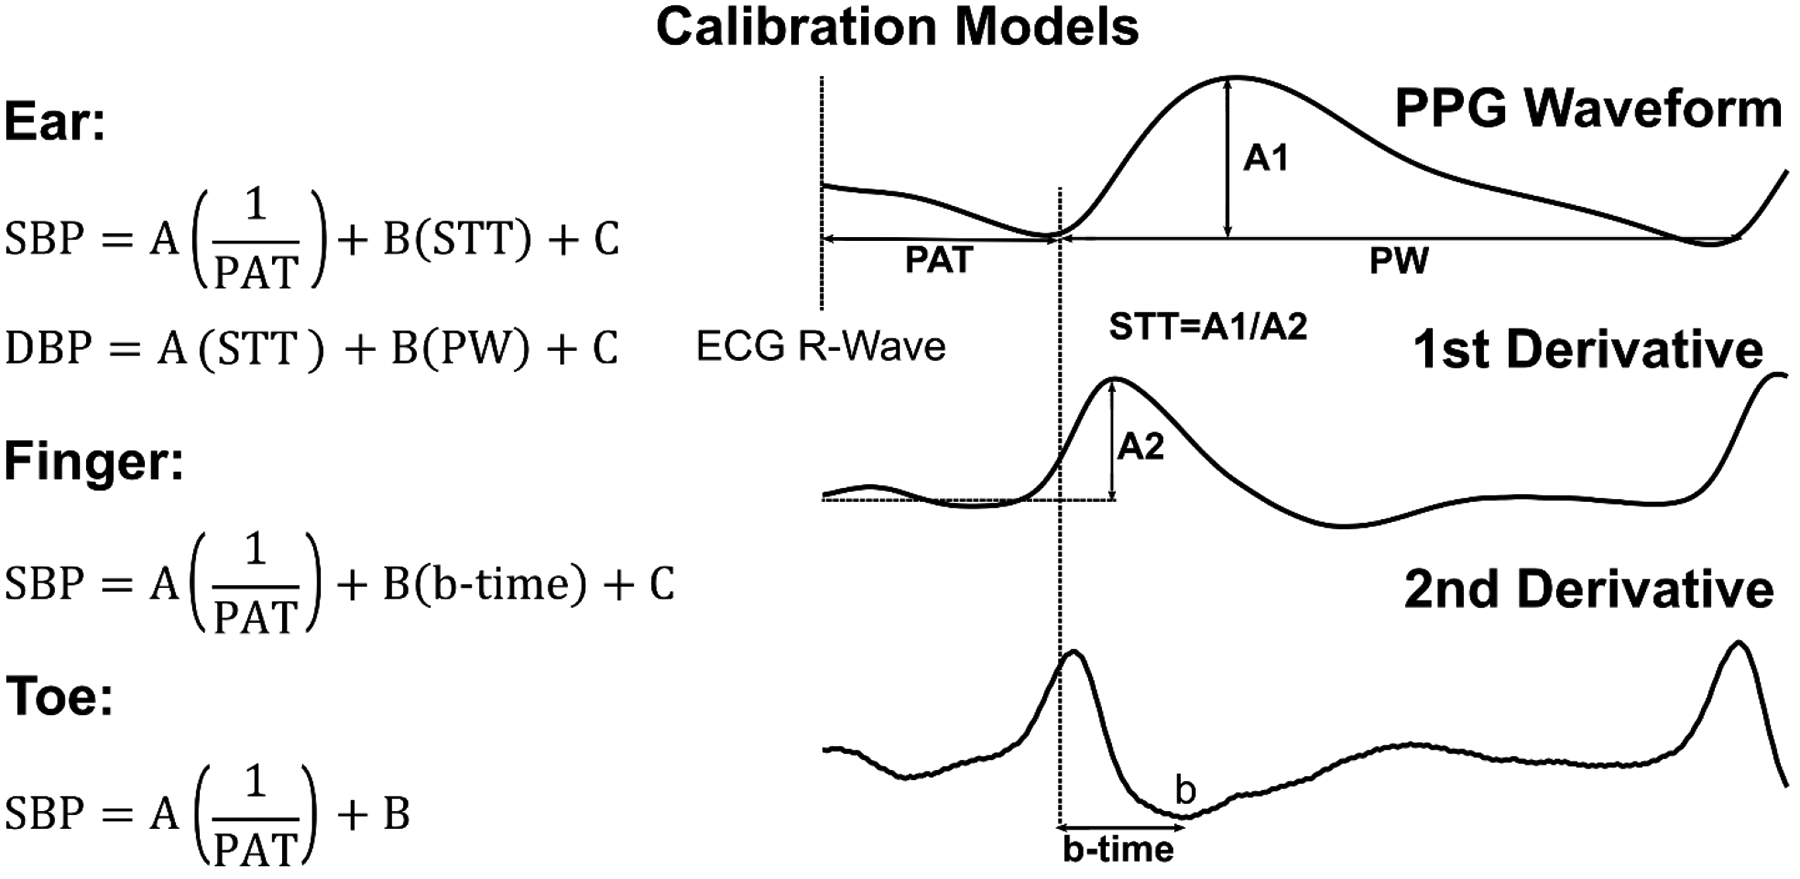
These linear models were previously shown to be useful in tracking intervention-induced BP changes in 32 heterogeneous subjects (see Figure 1) [9]. SBP/DBP are systolic/diastolic BP; PAT, pulse arrival time; STT, slope transit time; PW, pulse width; and A, B, and C, subject-specific coefficients.
C. Evaluation of Models
We evaluated the validity of each calibration model in two ways. We quantified how much a model changed on average and how well it predicted BP values after the one year.
First, we subtracted the second calibration model via the third session from the initial calibration model via the second session over the minimum and maximum of the feature(s) via the third session of each subject. We then horizontally shifted each of these calibration model differences so that their midpoints were at the subject average of the feature(s) via the third session. We took the subject average of the shifted calibration model differences over the subject average of the minimum and maximum of the feature(s) via the third session. We then computed the root-mean-square of this difference or error (RMSE) for a convenient scalar metric. This evaluation may indicate how much a calibration model changed due to one year of aging alone by virtue of averaging out random inter-subject variability.
Second, we used the initial calibration model of a subject to predict the BP values for that subject one year later. We assessed the BP predictions against the reference cuff BP values via the RMSE per subject. For comparison, we created two baseline models. One baseline model simply used the average of the initial cuff BP values of a subject to predict all BP values for that subject one year later. A calibration model must yield a lower RMSE than this naïve model to be of any value. The other baseline model was the second calibration model, which amounts to training and testing on the same data. A calibration model cannot yield a lower RMSE than this best-case model. We statistically compared the subject average RMSEs of the calibration and naïve models via paired t-tests. In conducting this evaluation, we observed obvious outliers. We thus reported the results for all the data and after exclusion of the outliers, which were objectively identified as any absolute BP error greater than 1.5 median absolute deviations from the median error [14]. We also employed correlation and Bland-Altman analyses to fully illustrate the agreement between the BP predictions of those calibration models found to offer value and the reference cuff BP measurements. This evaluation indicates how effective the calibration models were in predicting BP after one year in the presence of all random factors.
III. Results
Figure 3 illustrates the subject average (mean and SE) of each initial calibration model minus the respective calibration model one year later. The calibration model relating toe PAT to SBP changed by an RMSE of only 1.5 mmHg after one year, while the model relating ear STT and PW to DBP changed similarly by an RMSE of 1.9 mmHg. In contrast, the calibration models relating finger and ear PPG-derived time intervals to SBP changed appreciably more by an RMSE of 5–7 mmHg.
Fig. 3. Subject average (mean and SE) of each initial calibration model minus respective calibration model one year later.
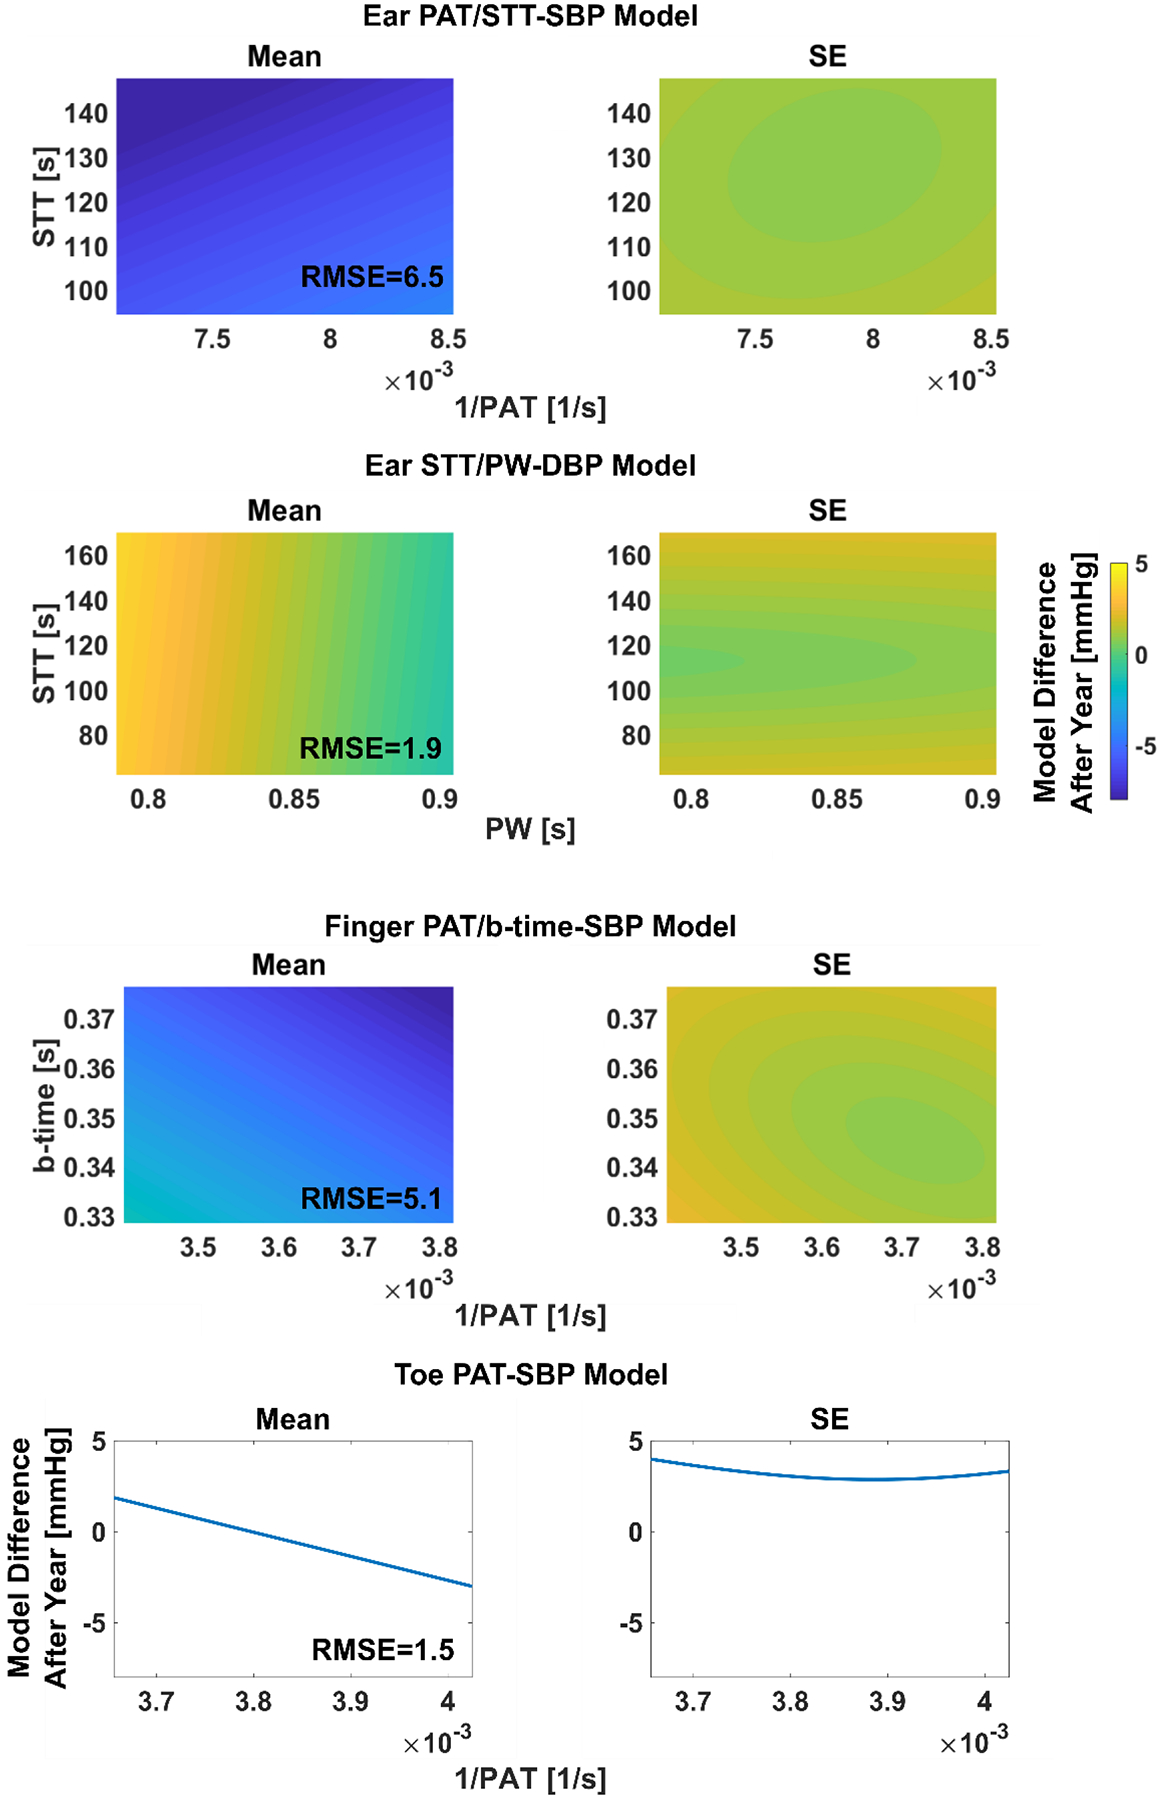
The initial calibration model coefficients (see Figure 2) were determined for each subject via the second session (see Figure 1), whereas the calibration model coefficients one year later were determined per subject via the third session. The plotted time interval range(s) for each model (i.e., x-axis range of the one-dimensional plots and x- and y-axis ranges of the two-dimensional plots) is the subject average of the minimum and maximum of the one year later time interval(s) via the third session. RMSE is root-mean-squared-error.
Table I shows the subject average RMSEs of the BP predictions of each initial calibration model against manual cuff BP values one year later from the same subject. Table I also includes the corresponding RMSEs of baseline (naïve and best-case) models for crucial comparisons [7]. The naïve models simply employ the average of the initial cuff BP values of a subject to predict the BP values for that subject one year later, whereas the best-case models are the one year later calibration models per subject. Only the toe PAT-SBP calibration model yielded a significantly lower RMSE than the naïve model (p < 0.05). This model did produce three relatively large BP errors out of 75 predictions (see Figure 4). After objective exclusion of these outliers, the SBP RMSE of the model was 9.6±0.8 mmHg. This level of error is around the midpoint of the corresponding RMSEs of the naïve and best-case models. All other calibration models were of no significant value in predicting BP after a year (p > 0.05). However, while the ear STT/PW-DBP calibration model was even inferior to the naïve model, the calibration model relating finger PAT and b-time to SBP did yield an RMSE after outlier removal of 10.3±1.2 mmHg, which was close to being significantly lower than that of the naïve model (p = 0.12).
TABLE I.
Blood pressure (BP) prediction errors of calibration models after one year
| Model | Data | Subject Average (Mean±SE) BP RMSE [mmHg] | ||
|---|---|---|---|---|
| Best-Case Model | Calibration Model | Naïve Model | ||
| Toe PAT-SBP | All | 6.3±0.9 | 11.3±1.5* | 13.7±1.3 |
| Outliers excluded | 5.7±0.5 | 9.6±0.8* | 12.7±1.0 | |
| Finger PAT/b-time-SBP | All | 5.4±0.7 | 12.1±1.8 | 13.7±1.3 |
| Outliers excluded | 4.9±0.6 | 10.3±1.2 | 12.7±1.0 | |
| Ear PAT/STT-SBP | All | 6.2±1.0 | 12.7±1.7 | 13.7±1.3 |
| Outliers excluded | 4.9±0.6 | 11.9±1.2 | 12.7±1.0 | |
| Ear STT/PW-DBP | All | 4.1±0.7 | 8.7±1.3 | 6.3±1.2 |
| Outliers excluded | 3.2±0.3 | 7.3±0.7* | 4.8±0.3 | |
Models are fully defined in Figure 2, where SBP/DBP are systolic/diastolic BP; PAT, pulse arrival time; STT, slope transit time; and PW, pulse width. RMSE is root-mean-squared-error of the BP predictions against reference manual cuff BP measurements. The subject-specific calibration models were created via an initial recording session one year earlier; the subject-specific best-case models were formed via the reference cuff BP values; and the naïve models used the average of the cuff BP values of each subject during the initial session one year earlier to predict the BP values for that subject.
denotes p < 0.05 compared to naïve model.
Fig. 4. Correlation and Bland-Altman plots of BP predicted by the toe PAT-SBP model – the best-performing calibration model – against the manual cuff BP values one year later.
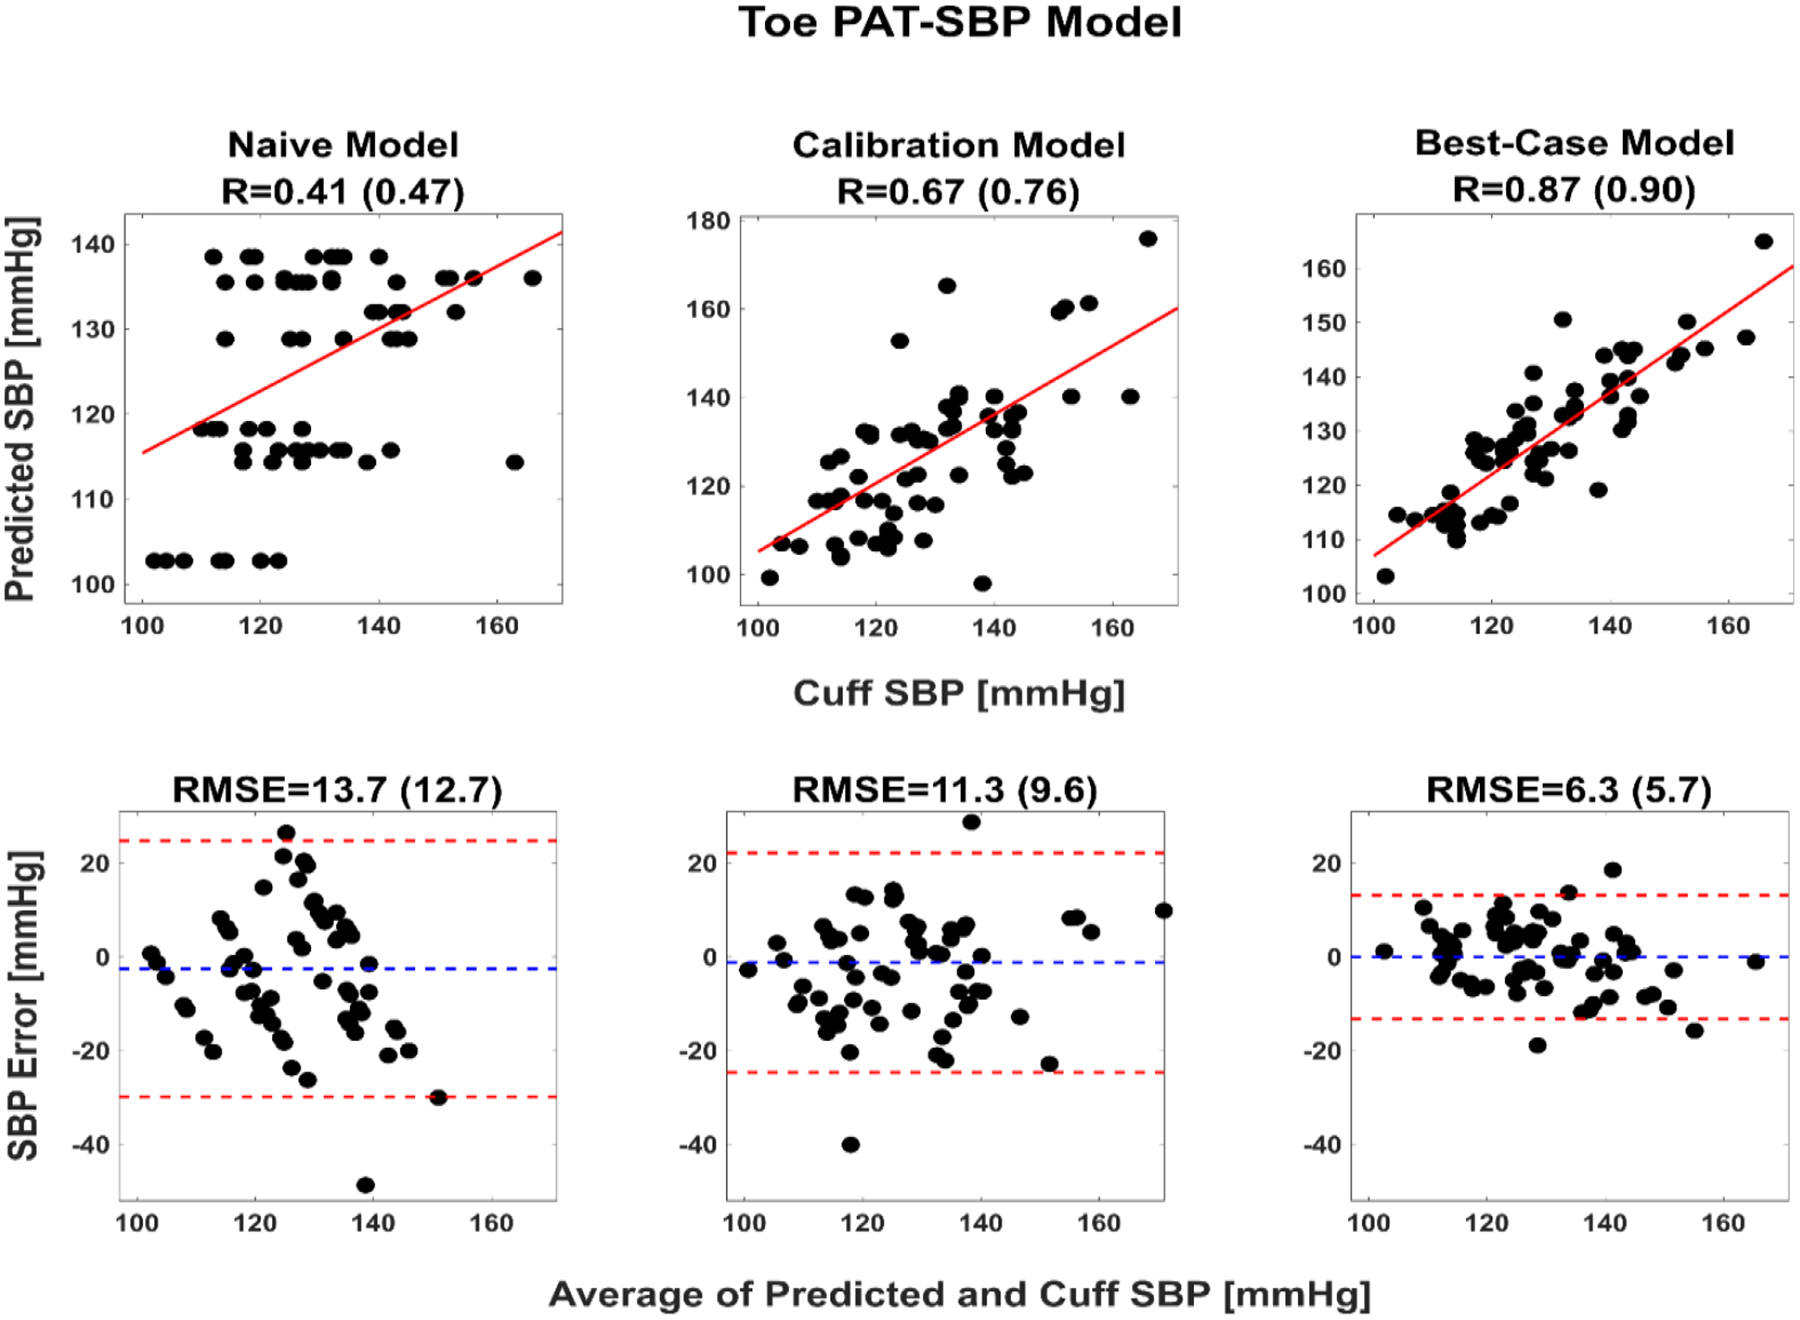
Baseline (naïve and best-case) model results are included for comparison. The naïve model employs the average of the initial cuff SBP values of a subject to predict the SBP values for that subject one year later, whereas the best-case model is the one year later calibration models per subject and thus prone to overfitting. R is correlation coefficient; value 1 (value 2), results from all 75 datapoints (results from 72 datapoints after objective exclusion of the three outliers).
Figure 4 illustrates correlation and Bland-Altman plots of the SBP predicted by the toe PAT-SBP calibration model against the manual cuff BP values one year later. The corresponding plots for the baseline models are also included for comparison.
IV. Discussion
Recently, we investigated conventional PTTs and single PPG waveform features as markers of BP in humans [8], [9]. We recorded ECG, ear PPG, finger PPG, and toe PPG waveforms and reference manual cuff BP before and after slow breathing, mental arithmetic, a cold pressor test, and sublingual nitroglycerin in 32 diverse volunteers (see Figure 1). We found four linear models that were useful for cuff-less tracking of the intra-subject BP changes. These calibration models related one or two time intervals extracted from an ECG waveform and a PPG waveform or just a single PPG waveform to a BP level (see Figure 2). Here, we repeated the data collection to investigate the impact of one year of aging on the calibration models in ten of the subjects (see Figure 1). We created subject-specific calibration models via an initial recording session and then evaluated the models in the corresponding subjects via a second session one year later. We found that only the linear model relating toe PAT to SBP remained useful. This model changed little on average after the year (RMSE = 1.5 mmHg; see Figure 3) and predicted the cuff BP values significantly better than the average of the initial cuff BP values of the subject (naïve model) following the year (RMSE = 9.6±0.8 mmHg vs. 12.7±1.0 mmHg after outlier removal; see Table I and Figure 4). The model was noticeably inferior in predicting the cuff BP values to a subject-specific calibration model formed via the same cuff BP values (best-case model) after the year (RMSE = 9.6±0.8 mmHg vs 5.7±0.5 mmHg; see Table I and Figure 4). However, this best-case model was prone to overfitting, so its RMSE actually represents a lower error bound that is unattainable in practice. Hence, the results collectively suggest that the cuff re-calibration period for the toe PAT-SBP model may be about a full year.
Arterial smooth muscle contraction may be the main reason that the calibration models relating ear and finger PPG-derived time intervals to BP levels were not significantly better than the naïve model after the year. Smooth muscle contraction directly modulates arterial stiffness and can thus cause PTT to change independent of BP via blood flow effects [5], [6]. This confounding effect is more profound for ear/finger PAT than toe PAT, because the paths from the proximal aorta to the ear/finger arteries consist of more smooth muscle than the aorta, which is included in its entirety in the path to the toe arteries [1]. Furthermore, PTT through the “elastic” aorta is a large fraction of the overall toe PAT, since pulse wave velocity is known to increase with increasing distance from the heart. Smooth muscle contraction can also change b-time and STT, which were inputs only to the ear and finger PPG-based models, independent of BP via arterial wall viscoelastic effects [9]. Hence, smooth muscle contraction variations may have introduced more randomness in the data for the ear and finger PPG-based calibration models than the toe PAT-SBP model. Variations in the pre-ejection period (PEP) component of ear, finger, and toe PATs may have also injected scatter. However, since the toe PAT-SBP model was useful after a year, PEP may have been a secondary factor here. Note that it is not feasible to update the calibration models for changes in smooth muscle contraction and PEP, as these changes can occur rapidly via neurohumoral control and medication [6].
Another reason that the ear and finger PPG-based models did not perform as well as the toe PAT-SBP model could be that the former models take two features as input and may thus be less robust due to the limited datapoints per subject. However, it turned out that linear models taking either ear PAT or finger PAT alone as input did not predict the BP values better than the two feature models after the year (results not shown).
We created the subject-specific calibration models using all of the data from the four BP interventions. Invoking this battery of interventions for every cuff re-calibration is not practical. We thus attempted to construct the subject-specific toe PAT-SBP models using a subset of the interventions and then test their validity in the same subjects using all of the intervention data one year later. However, we found that the models performed substantially worse in predicting the BP values. In particular, the lowest RMSEs (without outlier removal) were 48.1±5.4 mmHg for one intervention (mental arithmetic was best), 18.1±2.1 mmHg for two interventions (slow breathing + cold pressor), and 18.9±2.2 mmHg for three interventions (slow breathing + mental arithmetic + cold pressor). Hence, employing all interventions was necessary.
A few previous studies have examined the impact of aging on calibration models for cuff-less BP measurement. One was a theoretical study that we conducted to predict that the time period required for cuff re-calibration of an aortic PTT-BP model is at least one year for a 30 year old and six months for a 70 year old [15]. Our toe PAT-SBP model results in subjects of average age of 57 years here is comparable to this prediction. The others were experimental studies that assessed the validity of finger PAT-based models after up to one month [16] or six months [17], [18]. However, these studies did not compare the models to naïve ones, so their actual value after the elapsed time remains unknown. They also did not apply any interventions [16], [18] or included just exercise [17] to change the BP in each subject.
Our study has limitations. The main drawback was that our subject cohort comprised only ten subjects due to the complex study procedures (i.e., invoking four BP interventions that do not constitute minimal risk on three occasions in the same subject over a two-year period) and interruption of the study as a result of the ongoing pandemic. While we selected the subjects for multiple versus single session studies in a random fashion, small subject numbers can always introduce some bias in the study results. With additional subjects, the finger PAT/b-time-SBP model may prove to be significantly better in predicting BP levels than the naïve model after a year. A paired t-test sample size calculation based on the results of this study (mean and standard deviation of the RMSE difference between finger PAT/b-time-SBP and naïve models of 2.4 and 4.6 mmHg) specifically indicate that a total of 31 subjects would be needed at 0.05 and 0.8 significance and power levels. However, our results do suggest that this finger PAT/b-time SBP model will not be as useful as the toe PAT-SBP after the year. The limited number of subjects also did not allow us to assess the contribution of age and sex on the required re-calibration period. Age was an important factor in our earlier theoretical study mentioned above. While sex was irrelevant in this theoretical study, which was based on germane experimental data, the rate of vascular aging may be higher in females than males [19]. Although the subject number is certainly a limitation, it is worth mentioning that the ten subjects studied herein were sufficient to obtain statistically significant results for the toe PAT-SBP calibration model (see Table I). Another limitation was that our best-case model was not that useful due to overfitting. It would have been ideal to repeat the data collection one day earlier than the second recording session and use the subject-specific calibration models via this session for a realistic best-case model. In general, more frequent sessions (e.g., monthly) would have provided a better picture of the time period required for cuff re-calibrations. However, with extra sessions, the study would have been even more onerous.
V. Conclusion
This study concludes a trio of studies on conventional PTTs and single PPG waveform analysis for cuff-less BP measurement. In the first study [8], we assessed conventional PTTs as markers of BP and found that the best intra-subject correlation by a substantial extent was between toe PAT and SBP (−0.63±0.05). In the second study [9], we found that ear and finger PPG waveform time intervals, together with a corresponding PAT or alone, helped in predicting BP values but that toe PAT was still somewhat better in BP tracking. In this study, we found that the toe PAT-SBP model, but not ear and finger PPG-based models, remained valid after one year, thereby suggesting practical annual cuff re-calibrations. Furthermore, the intra-subject correlation between toe PAT and SBP in these subsequent data (−0.57±0.13; not shown above) continued to be highest amongst the conventional PTTs. Taken together, these three studies support toe PAT over other conventional features including the popular finger PAT for cuff-less BP measurement.
In practice, any toe may be selected for PPG measurement, but this site should be maintained over time to mitigate variability due to PPG sensor contact pressure [20] and otherwise. Furthermore, since the toe PAT-SBP calibration model could also change with body size, blood volume (operating point variation that could impact the estimated model), and disease progression (which is typically slow), the calibration model should be additionally updated beyond the annual period upon observing significant weight gain/loss or precipitous disease advancement. Another important point is that toe PAT measurement will not be reliable in everyone such as those with peripheral arterial disease. Finally, the outstanding challenges to realize the toe PAT method in suitable people are to create a convenient device to measure toe PAT and a practical way to accurately determine the model coefficients for each person.
Acknowledgments
This work was supported by the National Institutes of Health under Grant EB018818 and Grant HL146470.
Contributor Information
Mohammad Yavarimanesh, Department of Electrical and Computer Engineering, Michigan State University, East Lansing, MI 48823 USA. He is now with the Department of Bioengineering, University of Pittsburgh, Pittsburgh, PA 15261, USA..
Robert C. Block, Department of Public Health Sciences, School of Medicine and Dentistry, University of Rochester, Rochester, NY 14642, USA.
Keerthana Natarajan, Department of Electrical and Computer Engineering, Michigan State University, East Lansing, MI 48823 USA. She is now with Fitbit/Google, San Francisco, CA 94105 USA..
Lalit K. Mestha, Department of Electrical Engineering, University of Texas, Arlington, TX 78712, USA..
Omer T. Inan, School of Electrical and Computer Engineering, Georgia Institute of Technology, Atlanta, GA 30332, USA..
Jin-Oh Hahn, Department of Mechanical Engineering, University of Maryland, College Park, MD 20742, USA..
Ramakrishna Mukkamala, Departments of Bioengineering and Anesthesiology and Perioperative Medicine, University of Pittsburgh, Pittsburgh, PA 15261, USA..
References
- [1].Mukkamala R, Hahn J-O, Inan OT, Mestha LK, Kim C-S, Toreyin H, and Kyal S, “Toward ubiquitous blood pressure monitoring via pulse transit time: Theory and practice,” IEEE Transactions on Biomedical Engineering, vol. 62, no. 8, pp. 1879–1901, 2015. [DOI] [PMC free article] [PubMed] [Google Scholar]
- [2].Solà J and Delgado-Gonzalo R, Handbook of Cuffless Blood Pressure Monitoring : A Practical Guide for Clinicians. New York: Springer, 2019. [Google Scholar]
- [3].Elgendi M, Fletcher R, Liang Y, Howard N, Lovell NH, Abbott D, Lim K, and Ward R, “The use of photoplethysmography for assessing hypertension,” NPJ Digital Medicine, vol. 2, no. 60, 2019. [DOI] [PMC free article] [PubMed] [Google Scholar]
- [4].Buxi D, Redoute J, and Yuce M, “A survey on signals and systems in ambulatory blood pressure monitoring using pulse transit time,” Physiological Measurement, vol. 36, no. 3, p. R1–R25, 2015. [DOI] [PubMed] [Google Scholar]
- [5].Mukkamala R, Hahn J-O, and Chandrasekhar A, “Photoplethysmography in Non-Invasive Blood Pressure Monitoring.,” in Photoplethysmography, Kyriacou P and Allen J, Eds. Oxford: Elsevier, 2022, pp. 359–400. [Google Scholar]
- [6].Mukkamala R and Hahn J-O, “Initialization of Pulse Transit Time-Based Blood Pressure Monitors,” in The Handbook of Cuffless Blood Pressure Monitoring, Sola J and Delgado-Gonzalo R, Eds. New York: Springer, 2019, pp. 163–190. [Google Scholar]
- [7].Mukkamala R, Yavarimanesh M, Natarajan K, Hahn J-O, Kyriakoulis K, Avolio A, and Stergiou G, “Evaluation of the accuracy of cuffless blood pressure measurement devices: Challenges and proposals,” Hypertension, 2021. (Online ahead of print). [DOI] [PMC free article] [PubMed] [Google Scholar]
- [8].Block R, Yavarimanesh M, Natarajan K, Carek A, Mousavi A, Chandrasekhar A, Kim C, Zhu J, Schifitto G, Mestha L, Inan OT, Hahn J-O, and Mukkamala R, “Conventional pulse transit times as markers of blood pressure changes in humans,” Scientific Reports, vol. 10, no. 1, pp. 16373 (1–9), 2020. [DOI] [PMC free article] [PubMed] [Google Scholar]
- [9].Natarajan K, Block R, Yavarimanesh M, Chandrasekhar A, Mestha L, Inan OT, Hahn J-O, and Mukkamala R, “Photoplethysmography fast upstroke time intervals can be useful features for cuff-less measurement of blood pressure changes in humans,” IEEE Transactions on Biomedical Engineering, 2021. (Online ahead of print). [DOI] [PMC free article] [PubMed] [Google Scholar]
- [10].Joseph CN, Porta C, Casucci G, Casiraghi N, Maffeis M, Rossi M, and Bernardi L, “Slow breathing improves arterial baroreflex sensitivity and decreases blood pressure in essential hypertension,” Hypertension, vol. 46, no. 4, pp. 714–718, 2005. [DOI] [PubMed] [Google Scholar]
- [11].Al’Absi M, Bongard S, Buchanan T, Pincomb G, Lincino J, and Lovallo W, “Cardiovascular and neuroendocrine adjustment to public speaking and mental arithmetic stressors,” Psychophysiology, vol. 34, no. 3, pp. 266–275, 1997. [DOI] [PubMed] [Google Scholar]
- [12].Hines EA and Brown GE, “The cold pressor test for measuring the reactibility of the blood pressure: Data concerning 571 normal and hypertensive subjects,” American Heart Journal, vol. 11, no. 1, pp. 1–9, Jan. 1936. [Google Scholar]
- [13].Abrams J, “Hemodynamic effects of nitroglycerin and long-acting nitrates,” American Heart Journal, vol. 110, no. 1, pp. 217–224, 1985. [PubMed] [Google Scholar]
- [14].Rousseeuw PJ and Hubert M, “Robust statistics for outlier detection,” Wiley Interdisciplinary Reviews: Data Mining and Knowledge Discovery, vol. 1, no. 1, pp. 73–79, 2011. [Google Scholar]
- [15].Mukkamala R and Hahn J-O, “Toward ubiquitous blood pressure monitoring via pulse transit time: Predictions on maximum calibration period and acceptable error limits,” IEEE Transactions on Biomedical Engineering, vol. 65, no. 6, pp. 1410–1420, 2017. [DOI] [PMC free article] [PubMed] [Google Scholar]
- [16].Ding X, Zhang Y, and Tsang H, “Impact of heart disease and calibration interval on accuracy of pulse transit time–based blood pressure estimation,” Physiological Measurement, vol. 37, no. 2, pp. 227–237, 2016. [DOI] [PubMed] [Google Scholar]
- [17].Wong M, Poon C, and Zhang Y, “An evaluation of the cuffless blood pressure estimation based on pulse transit time technique: A half year study on normotensive subjects,” Cardiovascular Engineering, vol. 9, no. 1, pp. 32–38, 2009. [DOI] [PubMed] [Google Scholar]
- [18].Miao F, Fu N, Zhang Y, Ding X, Hong X, He Q, and Li Y, “A novel continuous blood pressure estimation approach based on data mining techniques,” IEEE Journal of Biomedical and Health Informatics, vol. 21, no. 6, pp. 1730–1740, 2017. [DOI] [PubMed] [Google Scholar]
- [19].Merz A and Cheng S, “Sex differences in cardiovascular ageing,” Heart, vol. 102, no. 11, pp. 825–831, 2016. [DOI] [PMC free article] [PubMed] [Google Scholar]
- [20].Chandrasekhar A, Yavarimanesh M, Natarajan K, Hahn J, and Mukkamala R, “PPG sensor contact pressure should be taken into account for cuff-less blood pressure measurement,” IEEE Transactions on Biomedical Engineering, vol. 67, no. 11, pp. 3134–3140, 2020. [DOI] [PMC free article] [PubMed] [Google Scholar]