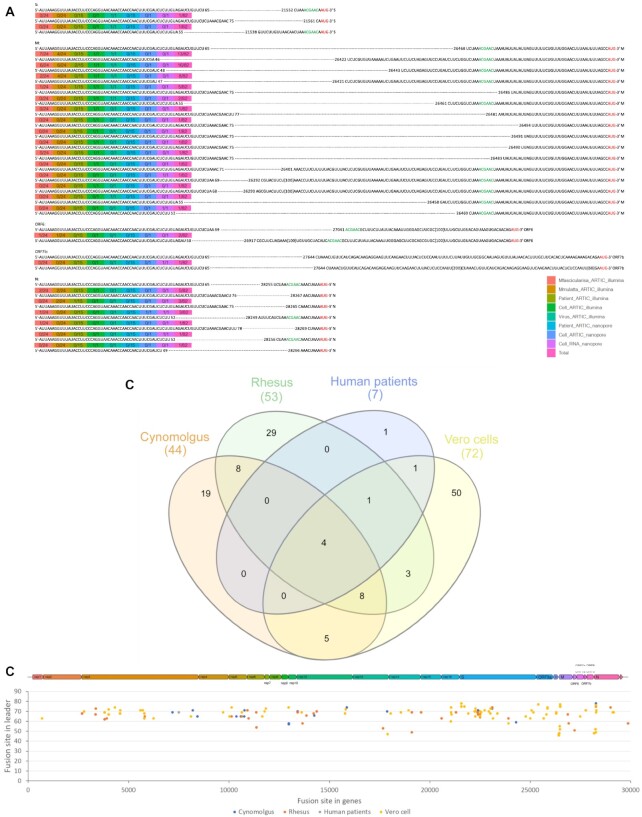
Figure 7.
(A) Diagram of novel leader–transcriptional regulatory sequence (TRS) junctions centered on the known gene orf but out of the search interval in the analysis of severe acute respiratory syndrome coronavirus 2 (SARS-CoV-2) RNA from cell culture, nonhuman primate, and human sequencing data. Many novel junctions map to the leader–TRS membrane gene junctions. (B) Venn diagram showing the overlap of novel leader–TRS gene junctions present in SARS-CoV-2–infected cynomolgus and rhesus macaques, human patients, and Vero cells. Data were obtained using the ATRIC-Illumina method (Supplementary Table 15). (C) Virus genome position of the start of the fusion site (y-axis) in the leader sequence plotted against the fusion site present in the gene to show the potential positions of the novel leader–TRS junctions along the SARS-CoV-2 genome (indicated above). The colors present the novel leader–TRS junctions identified in the different experimental condition (cynomolgus and rhesus macaques, human patients, and Vero cells).

