Abstract
In-cell NMR spectroscopy is a powerful tool to investigate protein behavior in physiologically relevant environments. Although proven valuable for disordered proteins, we show that in commonly used 1H-15N HSQC spectra of globular proteins, interactions with cellular components often broaden resonances beyond detection. This contrasts 19F spectra in mammalian cells, in which signals are readily observed. Using several proteins, we demonstrate that surface charges and interaction with cellular binding partners modulate linewidths and resonance frequencies. Importantly, we establish that 19F paramagnetic relaxation enhancements using stable, rigid Ln(III) chelate pendants, attached via non-reducible thioether bonds, provide an effective means to obtain accurate distances for assessing protein conformations in the cellular milieu.
Keywords: in cell, cellular interactions, line broadening, fluorine NMR spectroscopy, paramagnetic relaxation enhancement
Graphical Abstract

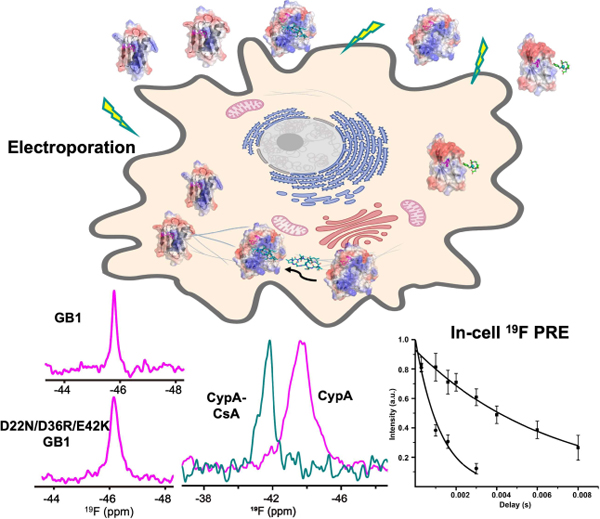
One dimensional 19F spectra of proteins can be easily detected in mammalian cells in contrast to 2D 1H-15N HSQC spectra that can be rendered invisible by interactions with cellular components. Importantly, distances can be measured by 19F PREs for proteins in their cellular milieu, paving the way for studying structure and dynamics while proteins perform their function.
Structure and dynamics investigations of biological macromolecules are commonly performed in vitro and, as such, employ a reductionist approach that involves removing a molecule from its native milieu, the cell, thereby ignoring environmental influences that may affect protein folding,[1] local conformation and overall structure,[2] enzymatic activities[3] and protein-protein/ligand interactions.[4] Although this traditional divide-and-conquer strategy has provided indispensable information, recent efforts are focused on developing biophysical and structural methods to directly investigate biomolecules inside living cells. In addition to spectacular advances in cryo-ET for evaluating cellular systems in situ,[5] NMR spectroscopy is now emerging as another method for studying structure, dynamics, interactions and conformations of biomolecules in cells.[2–3, 6]
NMR, like any spectroscopic method, relies on intrinsic probes as reporters. For biological macromolecules, these probes are 1H, 13C, 15N, and 31P nuclei, and enrichment with 15N and 13C is usually necessary for structure and dynamics investigations. Although powerful in principle, in-cell NMR spectroscopy is fraught with challenges, especially when studies are conducted in mammalian cells. If transient transfection and overexpression from a strong constitutive promotor is employed in isotopically enriched growth medium, not only will the desired protein become labeled, but to varying degrees, other cellular components will be labeled as well.[7] As a result, spectra from cells transfected with an empty vector have to be subtracted.[7] Such difficulties are not encountered when purified labeled proteins are exogenously delivered into cells, using electroporation[2] or pore-forming toxins.[8]
Further, for molecules that interact with large cellular partners the short coherence lifetimes make scalar-based magnetization transfers, which are necessary for 2- and 3-dimensional 15N-1H or 13C-1H correlation spectra, difficult or impossible. For these reasons, application of in-cell NMR spectroscopy for in situ structural characterization of macromolecules remains limited.
Importantly for in-cell NMR studies, 19F is an ideal reporter since it is absent from virtually all naturally occurring biological macromolecules, and fluorine can be readily incorporated into proteins biosynthetically via natural or non-natural amino acids.[9] Fluorine is a uniquely attractive nucleus for in-cell NMR as it is 100%-abundant as the 19F isotope, is highly sensitive, and is exquisitely responsive to its local environment.[9c] Here, we present 19F in-cell NMR results for proteins introduced into mammalian cells by electroporation. We included two benchmark proteins frequently used in NMR studies, the IgG-binding domain of protein G (GB1) and ubiquitin (Ub), as well as the abundant cellular protein cyclophilin A (CypA) and the C-terminal domain of the HIV capsid protein (CA-CTD). Our data demonstrate that fluorine signals are quickly and efficiently detected in one-dimensional (1D) NMR in-cell spectra, even for proteins whose 1H-15N HSQC spectra are devoid of all but very few resonances due to interactions with other components in the cellular environment. In addition, we present proof-of-concept that 19F paramagnetic relaxation enhancements (19F PREs) can be reliably measured in mammalian cells, thereby providing valuable distance information for structure characterization in physiological contexts. Our combined results demonstrate the unique potential of 19F NMR in-cell studies for assessing in-cellulo structure and dynamics of proteins.
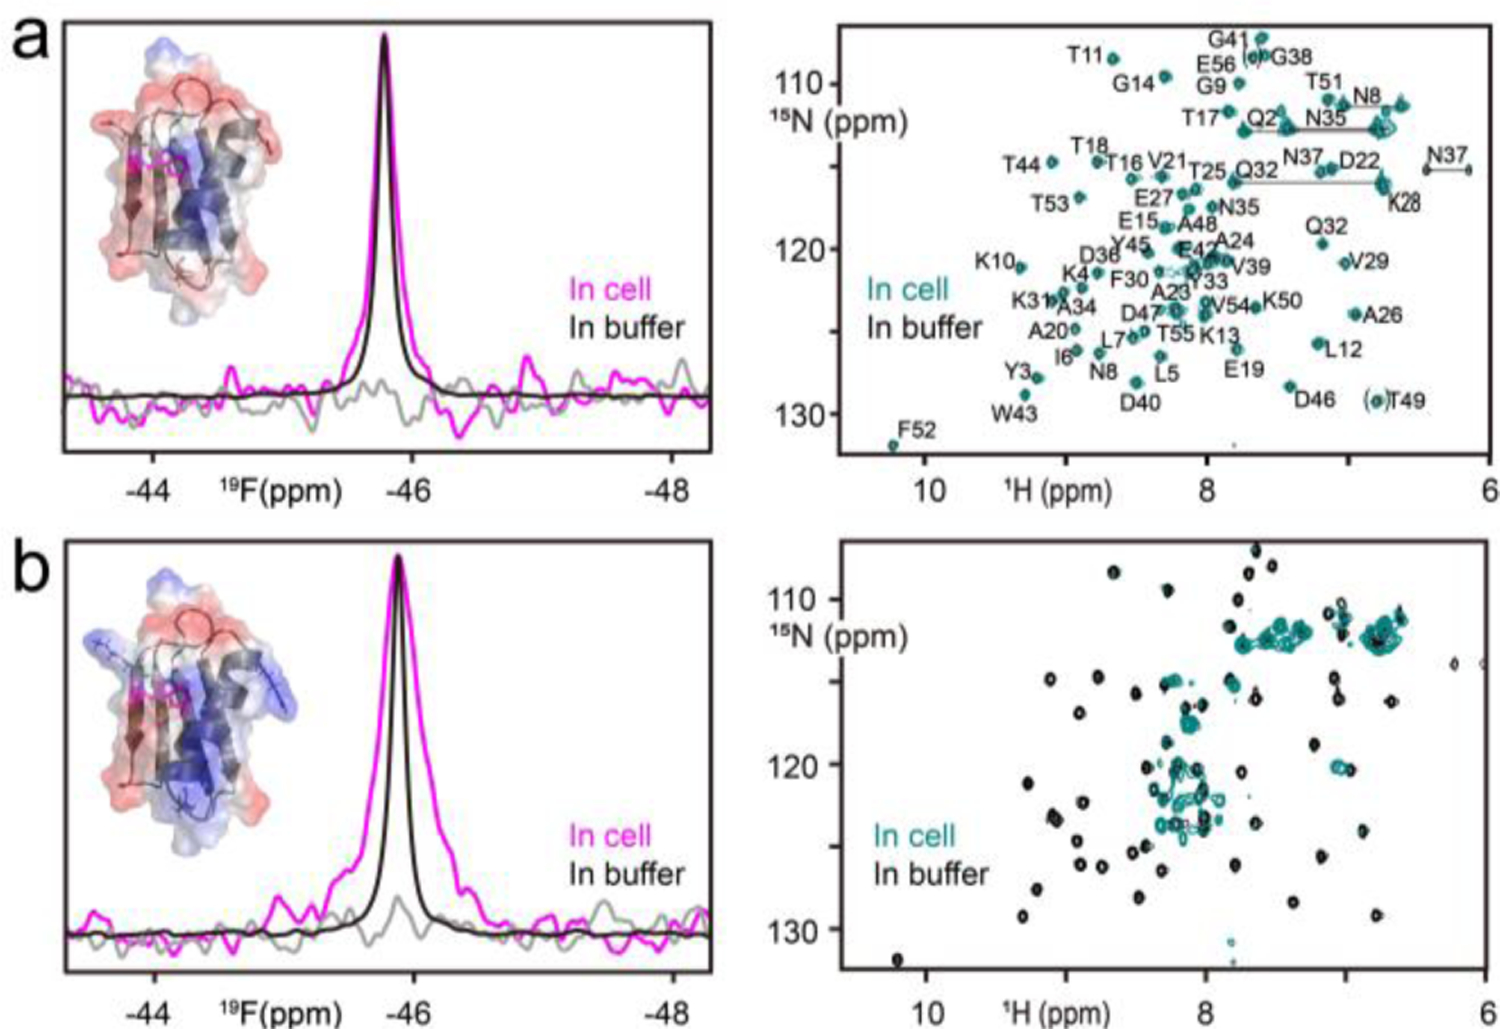
GB1, a benchmark NMR standard, is frequently employed for in-cell NMR studies,[10] rendering it an ideal protein for methods development. We previously showed that replacement of tryptophan 43 of GB1 (Trp43) with 5-fluoro-tryptophan (5F-Trp) does not affect its structure and stability.[9a] As illustrated in Figure 1a, the 19F NMR spectrum of 5F-Trp U-15N WT GB1 in A2780 ovarian carcinoma cells exhibits a single narrow resonance, and the 1H-15N HSQC spectrum is similar to that in buffer, indicating that it is properly folded and freely tumbling in cells. Similar observations have been made for GB1 1H-15N HSQC spectra in Escherichia coli,[11] Xenopus laevis oocytes[10, 12] and Spodoptera frugiperda cells.[13] Furthermore, we observed no protein leakage from the cells since the supernatant after completion of data acquisition is devoid of signal (Figure 1a, left). No changes inresonance frequencies, compared to those in buffer, are present, for both the 19F resonance (Supporting Information, Table S1) and the 1H-15N correlation crosspeaks (Figure 1a, right). This observation indicates the absence of specific interactions between GB1 and other proteins or large macromolecules in the cell. Some line broadening of the 19F signal is observed in cells compared to that in solution. We evaluated the origin of the line broadening by measuring 19F longitudinal relaxation rates (19F R1), since these are only sensitive to internal motion and insensitive to binding interactions, therefore reporting on the viscosity of the medium.[14] This is valid since the large Trp 43 side chain is rigidly packed inside the hydrophobic core and does not undergo appreciable internal motions. We obtained very similar R1 values for GB1 in buffer (2.37 s−1) and in the cell (2.25 s−1), indicating that the cellular viscosity is only slightly higher than that of aqueous buffer.[14] These findings agree well with recent 15N R1 and R2 measurements in A2780 cells.[15] These data suggest that the larger linewidths originate from non-specific interactions between the negatively charged surface of GB1 and concentrated cellular milieu.[16]
Figure 1.

In-cell spectra of 5F-Trp, U-15N WT GB1 (a) and D22N/D36R/E42K GB1 (b). Superpositions of in-cell GB1 (magenta), in-buffer GB1 (black) 19F spectra and the supernatant spectrum (grey) are displayed in the left panels. The structure of GB1 (PDB: 1GB1) is shown in ribbon representation (grey) overlayed with the electrostatic surface. The W43 side chain and the fluorine atom are shown in stick representation and magenta sphere, respectively. In (b) the substituted side chains in D22N/D36R/E42K GB1 are shown in stick representation. The right panels depict superpositions of in-cell (teal) and in-buffer 1H-15N HSQC spectra (black), with resonances labelled by amino acid name and number for GB1. Folded resonances (E56 and T49) are enclosed in brackets.
Surface charges have been implicated to influence protein interactions with other components in the crowded cellular environment, as a single D to K amino acid change results in a destabilization of ~1.5 kcal/mol for D40K GB1 in E.coli.[17] For this reason, we evaluated a GB1 variant in which three negatively charged side chains were substituted by positively and neutral polar charged ones (D22N/D36R/E42K).[18] This +5-charge difference changes the surface electrostatic potential of this variant (Figure 1) and increases the experimental isoelectric point from 4.5 for WT GB1 to 8.0 (data not shown) without altering the overall structure. The in-cell 19F signal of D22N/D36R/E42K GB1 is significantly broader (∆v =161 Hz) than that of WT GB1 (∆v =70 Hz), while in buffer the 19F linewidths for both are identical (Supporting Information, Table S1), suggesting that non-specific electrostatic interactions are responsible for the increased linewidth of D22N/D36R/E42K GB1 in cells. Significantly, the in-cell 1H-15N HSQC spectrum for D22N/D36R/E42K GB1 is devoid of cross-peaks except a few from flexible glutamine and arginine sidechains (Figure 1b and Supporting Information, Figure S1). Collectively, these results show that electrostatic interactions in the crowded cellular environment play the predominant role in line broadening and prevent the detection of all, but a few resonances in the 1H-15N HSQC spectrum of the D22N/D36R/E42K GB1 variant. Importantly, even under these circumstances, the in-cell 19F signal is still easily detectable.
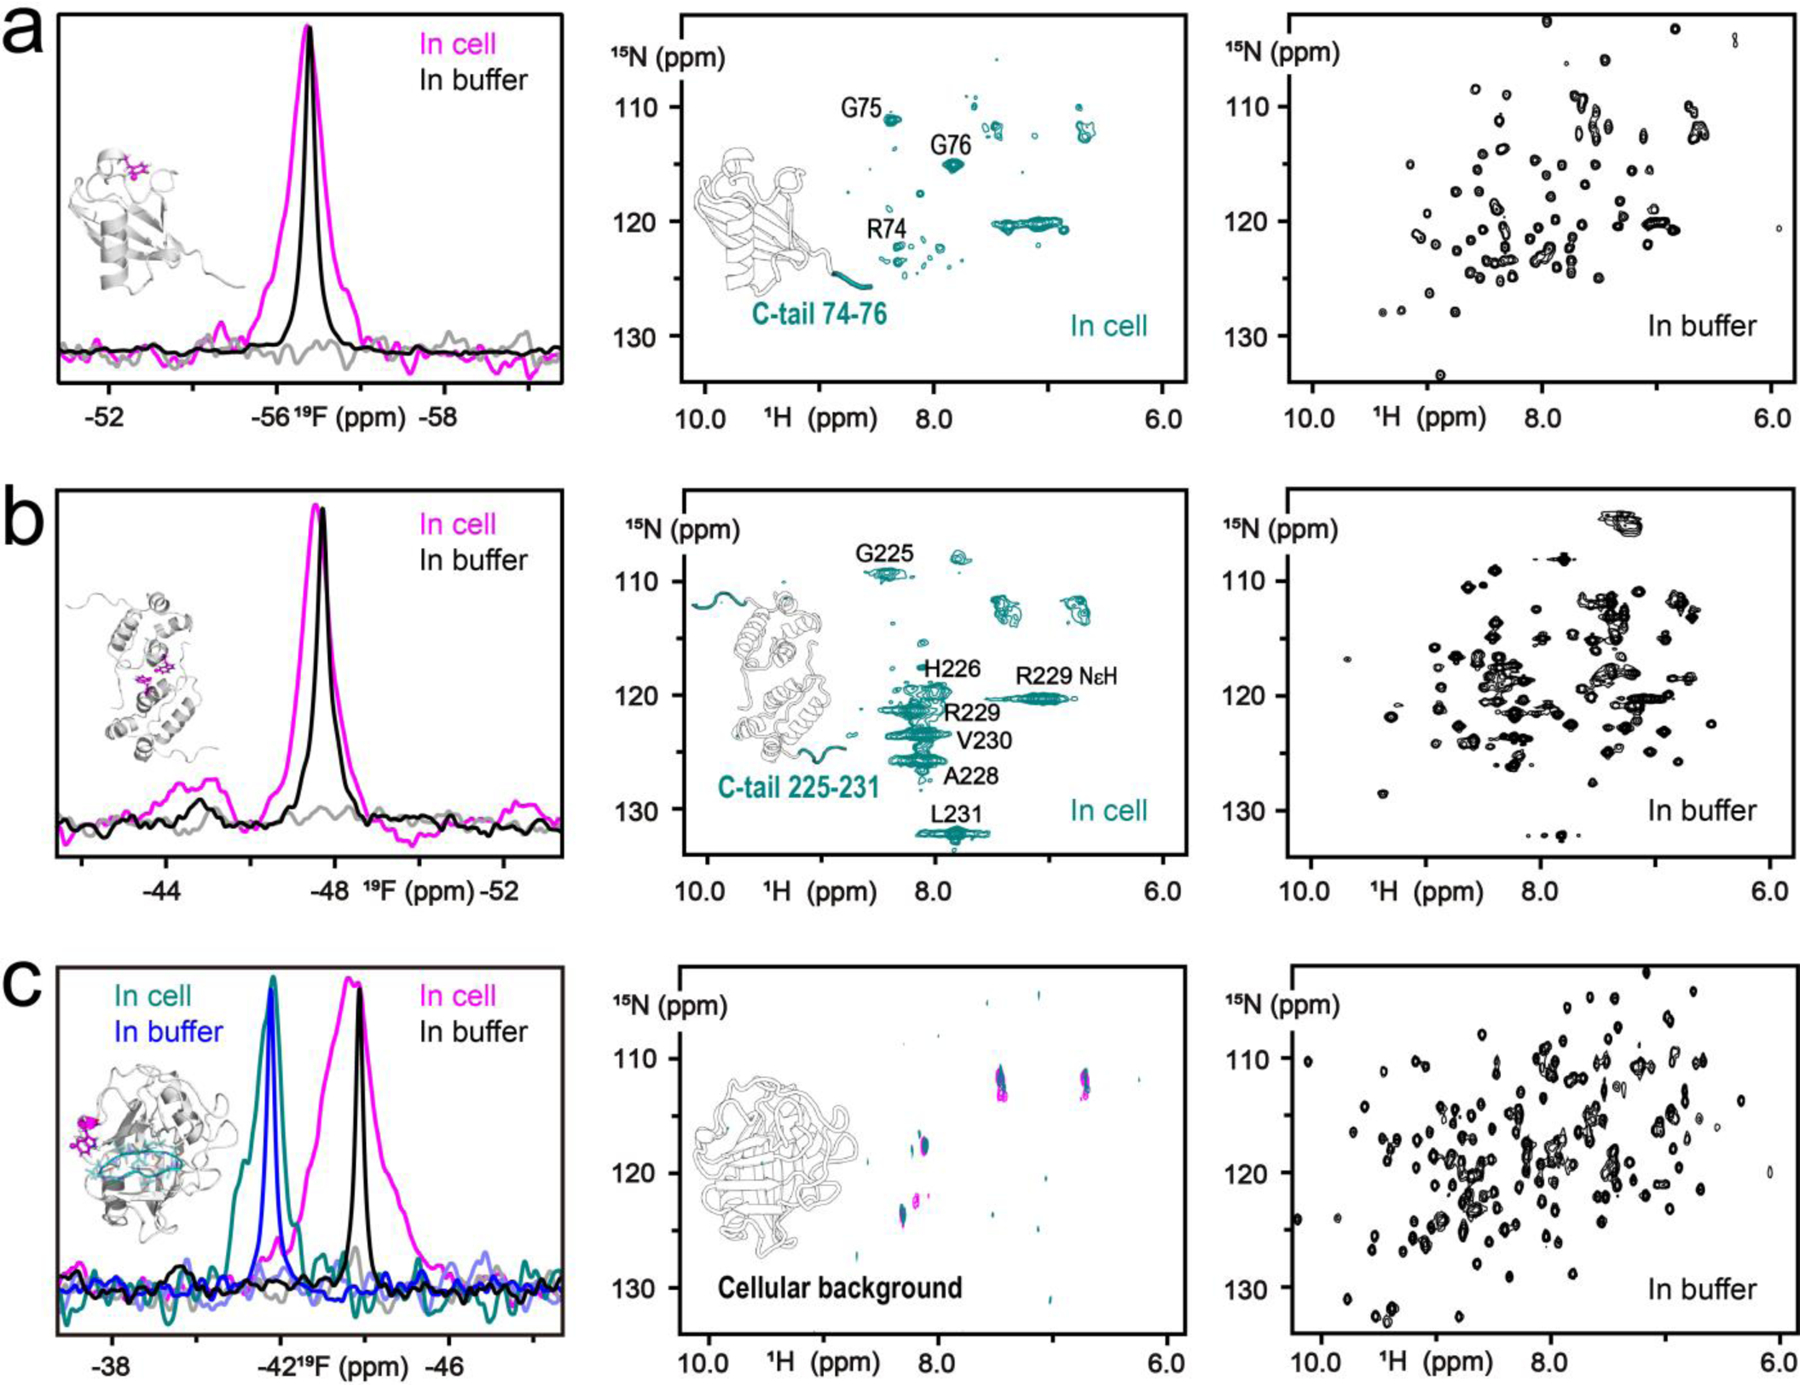
In contrast to GB1, which is not usually present in a eukaryotic cell, Ubiquitin (Ub) is a ubiquitous protein and possesses more than 150 cellular binding partners.[19] As reported previously, Ub is invisible in the in-cell 1H-15N HSQC spectrum, apart from resonances for three residues (R74, G75, G76) in the flexible C-terminal tail.[6c, 20] The same is true for K63R Ub, a variant incapable of G76–K63 ubiquitin chain assembly, for which the 19F signal of 3F-Tyr U-15N labeled protein (Y59) is clearly visible, albeit broader than the one in buffer (Figure 2a). The increased linewidths or disappearance of resonances is caused by the myriad of specific interactions of Ub in the cellular environment, in addition to any non-specific interactions. The fact that resonances for the last three residues are visible in the SOFAST 1H-15N HMQC spectrum suggests that the C-terminal tail is very flexible and essentially tumbling independently from the rest of Ub or its complexes. Likewise, for the C-terminal domain of the HIV-1 capsid protein (CA-CTD), only a few residues associated with amino acids in the flexible C-terminal tail (G225-L231) are visible in the in-cell SOFAST 1H-15N HMQC spectrum. In contrast, the 19F resonance for 5-19F-Trp, U-15N HIV-1 CA-CTD (W184) is readily observed (Figure 2b). As a fourth protein, we delivered human Cyclophilin A (CypA). CypA is involved in cis-trans proline isomerization of substrate proteins and the single Trp in CypA (W121) abuts the catalytic pocket, ideally located for sensing interactions with target proteins in the cell. The in-cell SOFAST 1H-15N HMQC and methyl 1H-13C HMQC spectra for CypA are completely invisible and only resonances from the cellular background are present (Figure 2c middle and Supporting Information, Figure S2 and S5). Again, gratifyingly the 19F signal in the 1D spectrum is readily observed (Figure 2c left). The 19F signal of CypA is extremely broad (∆v =756 Hz), while those of CA-CTD and Ub are only little broadened, compared to the in-buffer spectra. In addition, a small shift in resonance frequency compared to the free protein spectrum in buffer is present (Supporting Information, Table S1). Cyclosporin A (CsA), binds to the CypA catalytic pocket with nM affinity, and blocks specific interactions of CypA with cellular binding partners. As a result, the 19F signal of the CsA-bound CypA, whether delivered as the complex into the cell or formed by treating cells with excess CsA (Figure 2c and Supporting Information, Figure S3), is significantly sharper than for CypA alone (∆v =370 Hz) (Supporting Information, Table S1). In contrast, CsA binding to CypA in buffer does not affect the 19F peak linewidth (Supporting Information, Figure S3). This is consistent with CsA binding to CypA in the cells and blocking interactions with cellular target proteins, thereby sharpening the 19F signal. Similarly, in cell lysate, all resonances in the SOFAST 1H-15N HMQC spectrum of CypA are broadened beyond detection, while for the CypA-CsA complex all cross-peaks are visible (Supporting Information, Figure S4). At this juncture it should be pointed out that all in-cell NMR spectra were recorded at 283 K to ensure optimal cell viability throughout the duration of the experiments and that the increases in linewidths due to the slower tumbling at low temperatures is minimal, compared to the contributions from interactions with cellular components. The above combined findings clearly demonstrate the remarkable potential of 19F NMR for probing protein-protein/ligand interactions in the cellular environment.
Figure 2.

(a) In-cell (magenta), in-buffer (black) and supernatant (grey) 19F spectra of −19F-Tyr U-15N K63R Ub. The Ub structure (PDB ID: 1UBQ) is shown in the inset in grey ribbon representation with the Tyr side chain in magenta stick representation and the fluorine atom as sphere. The backbone atoms of the last three residues (R74, G75 and G76) for which resonances are visible in the in-cell SOFAST 1H-15N HMQC spectrum (middle panel) are coloured in teal. (b) In-cell (magenta), in-buffer (black) and supernatant (grey) 19F spectra of 5-19F-Trp, U-15N HIV-1 CA-CTD dimer. The CA-CTD dimer structure (PDB ID: 2KOD) is shown in the inset in grey ribbon representation with the Trp side chain in magenta stick representation and fluorine atom as sphere. The backbone of the C-terminal tail (G225-L231) for which resonances are visible in the in-cell SOFAST 1H-15N HMQC spectrum (middle panel) are colored in teal. (c) In-cell (magenta and teal), in-buffer (black and blue) and supernatant (grey and light blue) 19F spectra of 5-19F-Trp, U-15N CypA and the CypA-CsA complex, respectively. The CypA-CsA structure (PDB ID: 1CWA) is shown in the inset in grey ribbon representation with the Trp side chain in magenta stick representation and fluorine atom as sphere. CsA in the CypA binding pocket is coloured in teal. For all three proteins, the in-cell and in-buffer SOFAST 1H-15N HMQC spectra are depicted in the middle and right-hand side panels, respectively.
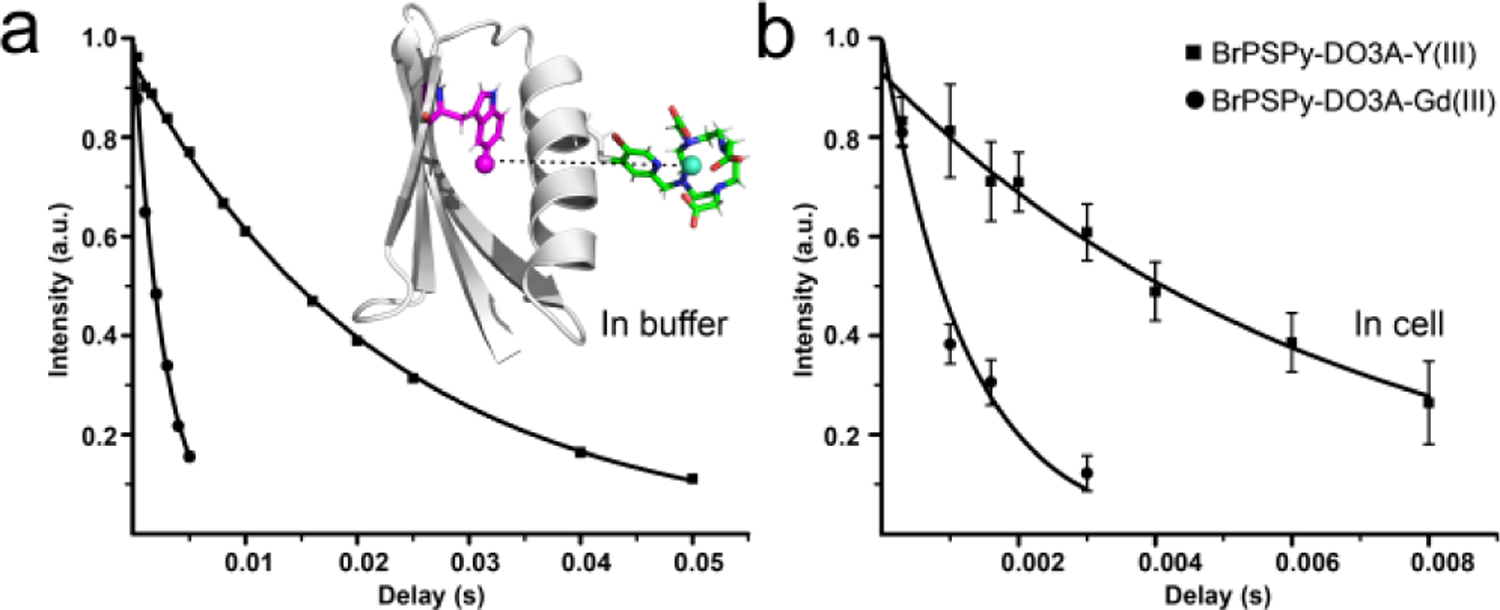
In order to obtain structural information on proteins in the cell, it is necessary to extract distance restraints from measurable observables, e.g., chemical shifts, couplings, NOEs or paramagnetic relaxation enhancements (PREs). Pseudocontact shifts (PCSs) have been successfully used for structure determination of GB1 in Xenopus laevis oocytes.[10, 12b] We previously provided proof-of-concept and initial applications of 19F PREs (Г2) for measuring distances in selectively 19F-labeled proteins[21] and distances extracted from 19F Г1 values for a protein were also reported recently.[22] Here, we evaluated whether 19F PREs can be measured and exploited in cells. To this end, a chelated lanthanide ion paramagnetic tag, BrPSPy-DO3A-Gd(III), as well as its diamagnetic counterpart, BrPSPy-DO3A-Y(III), were conjugated to Q32C GB1 via a reduction-stable C-S thioether bond[4b] and both tagged proteins were delivered into cells. The large PRE effect generated by Gd(III) permits measurement of distances up to ~35 Å. BrPSPy-DO3A was chosen for its rigidity, high affinity for lanthanides and stability in the reducing cellular environment. 19F-R2 relaxation rates were extracted from 1D 19F resonance signal intensity decays, recorded with different delays, for paramagnetic and diamagnetic tagged GB1 (Figure 3). For the in-cell 19F PRE experiment, we recorded spectra for four and eight relaxation delays on BrPSPy-DO3A-Gd(III)- and BrPSPy-DO3A-Y(III) tagged GB1, respectively, given the limited lifetime of the cells (Supporting Information, Figure S6). As can be appreciated, the data for tagged GB1 in cell and buffer fit well to an exponential function and distances were derived according to the Solomon-Bloembergen equation[23] (Materials and Methods). For GB1 in buffer, the 19F PRE-derived distance between the Gd(III) and fluorine was calculated as 14.7 ± 0.1 Å, in excellent agreement with the predicted distance of 14.6 ± 1.0 Å (Materials and Methods) from the model. In the cell, the equivalent distance lies between 13.7 Å and 14.6 Å, taking into account contributions from non-specific binding (Supporting Information, Figure S7). Therefore, our in-cell 19F PRE experiments demonstrate that the cellular environment does not influence the structure of GB1, consistent with previous studies.[10, 12b, 24]
Figure 3.

19F PREs for 5-19F-Trp Q32C GB1 tagged with BrPSPy-DO3A-Gd(III) (filled circles) and BrPSPy-DO3A-Y(III) (filled squares), in buffer (a) and cells (b), respectively. The intensities of the 19F resonances for different relaxation delays are plotted and fitted to an exponential function. The intensity errors are estimated based on the signal-to-noise ratio in the 19F spectra. The inset displays a structural model of BrPSPy-DO3A-Gd(III)-tagged GB1 with the tag shown in stick representation and the distance between Gd(III) (green) and fluorine (magenta) atoms indicated by the dashed line.
In summary, we demonstrate in this report that 19F NMR can be successfully used to characterize proteins in mammalian cells, even for proteins that engage in strong interactions with other components in the cellular environment and for which difficulties are encountered with traditional 1H-15N HSQC based NMR approaches. The use of 19F as a probe expands the applicability of in-cell NMR and opens new avenues for in situ atomic-level characterization of protein structure, protein-protein/ligand interactions, and future in-cell drug-binding methodologies.
Supplementary Material
Acknowledgements
The authors thank Rieko Ishima and Daniella Goldfarb for constructive and valuable discussions, Teresa Brosenitsch for critical reading of the manuscript, Gregor Hagelueken for adding BrPSPy-DO3A to MtsslWizard, Doug Bevan for computer and Michael J. Delk for NMR technical support. This work was supported by NIH grant P50AI150481 and NSF grants CHE 1708773 and MCB 2116534 (to A.M.G.) and National Natural Science Foundation of China grant 21991081 (to X.C.S). A.J.G. is a Merck fellow of the Life Science Research Foundation and holds a Postdoctoral Enrichment Program Award from the Burroughs Wellcome Fund.
References
- [1].a) Danielsson J, Mu X, Lang L, Wang H, Binolfi A, Theillet FX, Bekei B, Logan DT, Selenko P, Wennerstrom H, Oliveberg M, Proc. Natl Acad. Sci. USA 2015, 112, 12402–12407; [DOI] [PMC free article] [PubMed] [Google Scholar]; b) Song X, Lv T, Chen J, Wang J, Yao L, J. Am. Chem. Soc 2019, 141, 11363–11366. [DOI] [PubMed] [Google Scholar]
- [2].Theillet FX, Binolfi A, Bekei B, Martorana A, Rose HM, Stuiver M, Verzini S, Lorenz D, van Rossum M, Goldfarb D, Selenko P, Nature 2016, 530, 45–50. [DOI] [PubMed] [Google Scholar]
- [3].Zhao Q, Fujimiya R, Kubo S, Marshall CB, Ikura M, Shimada I, Nishida N, Cell. Rep 2020, 32, 108074. [DOI] [PubMed] [Google Scholar]
- [4].a) Luchinat E, Barbieri L, Cremonini M, Nocentini A, Supuran CT, Banci L, Angew. Chem. Int. Ed 2020, 59, 6535–6539; [DOI] [PMC free article] [PubMed] [Google Scholar]; b) Yang Y, Chen SN, Yang F, Li XY, Feintuch A, Su XC, Goldfarb D, Proc. Natl Acad. Sci. USA 2020, 117, 20566–20575. [DOI] [PMC free article] [PubMed] [Google Scholar]
- [5].a) Robinson CV, Sali A, Baumeister W, Nature 2007, 450, 973–982; [DOI] [PubMed] [Google Scholar]; b) Lucic V, Rigort A, Baumeister W, J. Cell. Biol 2013, 202, 407–419. [DOI] [PMC free article] [PubMed] [Google Scholar]
- [6].a) Hänsel R, Luh LM, Corbeski I, Trantirek L, Dötsch V, Angew. Chem. Int. Ed 2014, 53, 10300–10314; [DOI] [PubMed] [Google Scholar]; b) Li C, Zhao J, Cheng K, Ge Y, Wu Q, Ye Y, Xu G, Zhang Z, Zheng W, Zhang X, Zhou X, Pielak G, Liu M, Annu. Rev. Anal. Chem 2017, 10, 157–182; [DOI] [PubMed] [Google Scholar]; c) Inomata K, Ohno A, Tochio H, Isogai S, Tenno T, Nakase I, Takeuchi T, Futaki S, Ito Y, Hiroaki H, Shirakawa M, Nature 2009, 458, 106–109; [DOI] [PubMed] [Google Scholar]; d) Banci L, Barbieri L, Bertini I, Luchinat E, Secci E, Zhao Y, Aricescu AR, Nat. Chem. Biol 2013, 9, 297–299; [DOI] [PMC free article] [PubMed] [Google Scholar]; e) Siegal G, Selenko P, J. Magn. Reson 2019, 306, 202–212. [DOI] [PubMed] [Google Scholar]
- [7].Barbieri L, Luchinat E, Banci L, Nat. Protoc 2016, 11, 1101–1111. [DOI] [PubMed] [Google Scholar]
- [8].Ogino S, Kubo S, Umemoto R, Huang S, Nishida N, Shimada I, J. Am. Chem. Soc 2009, 131, 10834–10835. [DOI] [PubMed] [Google Scholar]
- [9].a) Campos-Olivas R, Aziz R, Helms GL, Evans JN, Gronenborn AM, FEBS. Lett 2002, 517, 55–60; [DOI] [PubMed] [Google Scholar]; b) Sharaf NG, Gronenborn AM, in Isotope Labeling of Biomolecules - Labeling Methods, Vol. 565 (Ed.: Kelman Z), Elsevier Academic Press Inc, San Diego, 2015, pp. 67–95; [Google Scholar]; c) Gerig J, 2001, 1–35 (https://www.biophysics.org/Portals/0/BPSAssets/Articles/gerig.pdf).
- [10].Müntener T, Häussinger D, Selenko P, Theillet FX, J. Phys. Chem. Lett 2016, 7, 2821–2825. [DOI] [PubMed] [Google Scholar]
- [11].Ikeya T, Hanashima T, Hosoya S, Shimazaki M, Ikeda S, Mishima M, Güntert P, Ito Y, Sci. Rep 2016, 6, 38312. [DOI] [PMC free article] [PubMed] [Google Scholar]
- [12].a) Selenko P, Serber Z, Gadea B, Ruderman J, Wagner G, Proc. Natl Acad. Sci. USA 2006, 103, 11904–11909; [DOI] [PMC free article] [PubMed] [Google Scholar]; b) Pan BB, Yang F, Ye Y, Wu Q, Li C, Huber T, Su XC, Chem. Commun 2016, 52, 10237–10240. [DOI] [PubMed] [Google Scholar]
- [13].Hamatsu J, O’Donovan D, Tanaka T, Shirai T, Hourai Y, Mikawa T, Ikeya T, Mishima M, Boucher W, Smith BO, Laue ED, Shirakawa M, Ito Y, J. Am. Chem. Soc 2013, 135, 1688–1691. [DOI] [PubMed] [Google Scholar]
- [14].Ye Y, Liu X, Zhang Z, Wu Q, Jiang B, Jiang L, Zhang X, Liu M, Pielak GJ, Li C, Chemistry 2013, 19, 12705–12710. [DOI] [PubMed] [Google Scholar]
- [15].Leeb S, Yang F, Oliveberg M, Danielsson J, J. Phys. Chem. B 2020, 124, 10698–10707. [DOI] [PMC free article] [PubMed] [Google Scholar]
- [16].Ye Y, Wu Q, Zheng W, Jiang B, Pielak GJ, Liu M, Li C, J. Phys. Chem. B 2019, 123, 4527–4533. [DOI] [PubMed] [Google Scholar]
- [17].Monteith WB, Cohen RD, Smith AE, Guzman-Cisneros E, Pielak GJ, Proc. Natl Acad. Sci. USA 2015, 112, 1739–1742. [DOI] [PMC free article] [PubMed] [Google Scholar]
- [18].Zhou P, Wagner G, J. Biomol. NMR 2010, 46, 23–31. [DOI] [PMC free article] [PubMed] [Google Scholar]
- [19].Husnjak K, Dikic I, Annu. Rev. Biochem 2012, 81, 291–322. [DOI] [PubMed] [Google Scholar]
- [20].Narasimhan S, Scherpe S, Lucini Paioni A, van der Zwan J, Folkers GE, Ovaa H, Baldus M, Angew. Chem. Int. Ed 2019, 58, 12969–12973. [DOI] [PMC free article] [PubMed] [Google Scholar]
- [21].Matei E, Gronenborn AM, Angew. Chem. Int. Ed 2016, 55, 150–154. [DOI] [PMC free article] [PubMed] [Google Scholar]
- [22].Huang Y, Wang X, Lv G, Razavi AM, Huysmans GHM, Weinstein H, Bracken C, Eliezer D, Boudker O, Nat. Chem. Biol 2020, 16, 1006–1012. [DOI] [PMC free article] [PubMed] [Google Scholar]
- [23].a) Solomon I, Phys. Rev 1955, 99, 559–565; [Google Scholar]; b) Bloembergen N, J. Chem. Phys 1957, 27, 572–573. [Google Scholar]
- [24].Tanaka T, Ikeya T, Kamoshida H, Suemoto Y, Mishima M, Shirakawa M, Güntert P, Ito Y, Angew. Chem. Int. Ed 2019, 58, 7284–7288. [DOI] [PubMed] [Google Scholar]
Associated Data
This section collects any data citations, data availability statements, or supplementary materials included in this article.


