Abstract
Purpose:
To evaluate the injection location effect on the distribution of yttrium-90 (90Y) microspheres in the liver during radioembolization and discuss the potential effects of radial movements of the catheter tip.
Materials and Methods:
Numerical studies were conducted using images from a representative patient with hepatocellular carcinoma. The right hepatic artery (RHA) was segmented from the patient contrast-enhanced cone-beam computed tomography scans. The blood flow was investigated in the trunk of the RHA using numerical simulations for six injection position scenarios in two sites located at a distance of ~5 and 20 mm upstream of the first bifurcation (RHA diameters ~ 4.6 mm). The 90Y delivery to downstream vessels was calculated from the simulated hepatic artery hemodynamics.
Results:
Varying the injection location along the RHA and across the vessel cross-section resulted in different simulated microsphere distributions in the downstream vascular bed. When the catheter tip was at 5 mm upstream of the bifurcation, 90Y distribution in the downstream branches varied as large as 53% with a 1.5 mm-radial-movement of the catheter tip. However, the catheter radial movement had a weaker effect on the microsphere distribution when the injection plane was farther from the first bifurcation (20 mm) with a maximum delivery variation of 9% to a downstream branch.
Conclusion:
An injection location far from bifurcations is recommended to minimize the effect of radial movements of the catheter tip on the microsphere distribution.
INTRODUCTION
Liver cancer radioembolization with yttrium-90 (90Y) microspheres is widely used for the treatment of hepatocellular carcinoma and hepatic metastases [1], [2]. After careful planning of the injection location and activity before treatment [3], the microspheres are injected into the hepatic artery through a catheter to irradiate the tumors internally. Clinical studies have suggested that the injection location, catheter tip position, and catheter design (e.g. conventional end-hole versus antireflux) affect the microsphere distribution and potentially the procedure efficacy [4]–[6]. A more quantitative understanding of the effect of the catheter position on the microsphere distribution can guide the optimization of the injection for each patient [7].
Computational fluid dynamics (CFD) simulations use numerical methods to analyze hemodynamics by solving fluid mechanics governing equations in regions of interest (i.e., computational domain). Previous investigations used CFD simulation of the hepatic blood flow to predict the 90Y microsphere distribution in the liver [8]–[10]. CFD simulations were also used to make recommendations about the injection flow rate, location within the arterial cross-section (i.e., radial location), and location along the hepatic artery (i.e., axial location) to target the tumors more efficiently [11]–[14]. Clinical implementation of these engineering recommendations may not be technically feasible yet because of the limited control over catheter tip placement with respect to the radial location at a given axial location [11]. The objective of this work is to utilize pre-treatment noninvasive numerical simulations to suggest clinically relevant and practicable recommendations on the effect of the injection location on 90Y microsphere distribution, focusing on factors that can be controlled during administration. This is an pilot investigation on one patient dataset to develop the necessary foundation for more complex simulations with a larger patient cohort.
MATERIALS AND METHODS
Hemodynamics simulations were used to investigate the transport of 90Y microspheres in an image-based reconstruction of a section of the hepatic artery defining the computational domain. Figure 1 shows the flowchart of this retrospective study which was conducted after institutional review board approval.
Figure 1 –
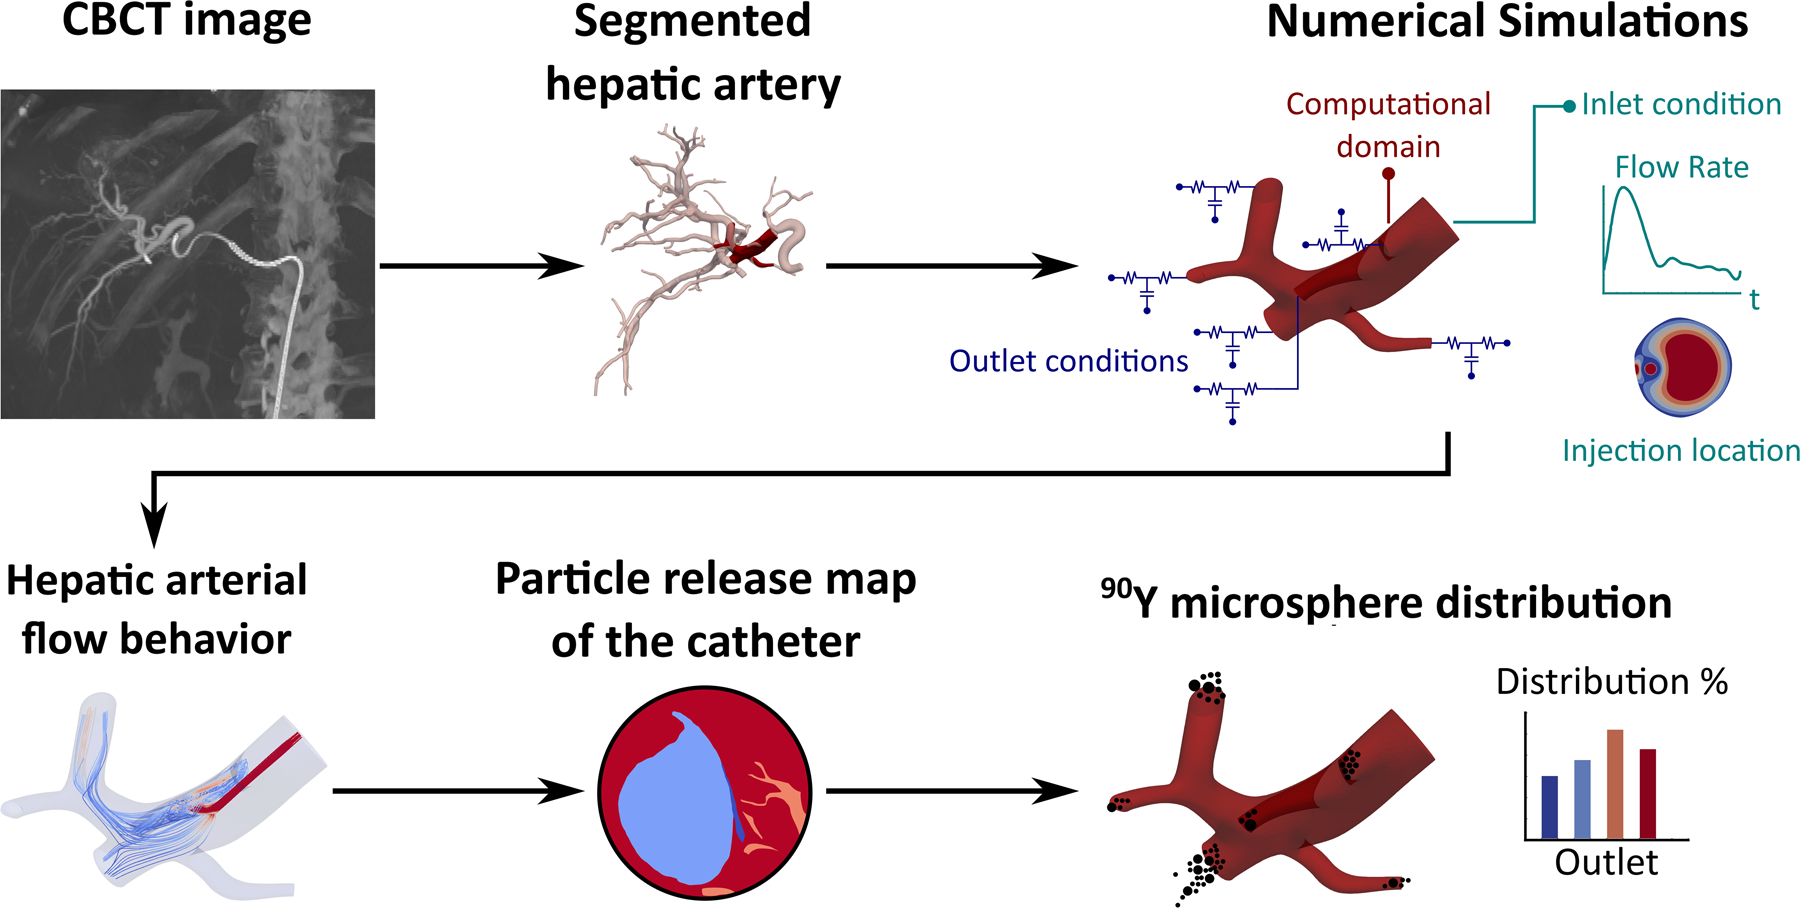
Flowchart of the study.
A contrast-enhanced C-arm cone-beam computed tomography (CBCT) of a sample patient with hepatocellular carcinoma (scheduled for lobectomy) was acquired during treatment planning. The CBCT scan was obtained under breath-hold with a coverage of 198 degrees and angular sampling of 0.5 degrees using an Artis Zeego angiography system (Siemens Healthineers, Knoxville, TN). The tumor was located in the right hepatic lobe (involving segments 6, 7, and 8). Iohexol (Omnipaque 300, GE Healthcare, Chicago, IL) was administered to visualize the arteries. Figure 2a-c shows the coronal view of the CBCT with a correlated image from a digital subtraction angiography (DSA) and an axial contrast-enhanced CT performed during the procedure.
Figure 2 –
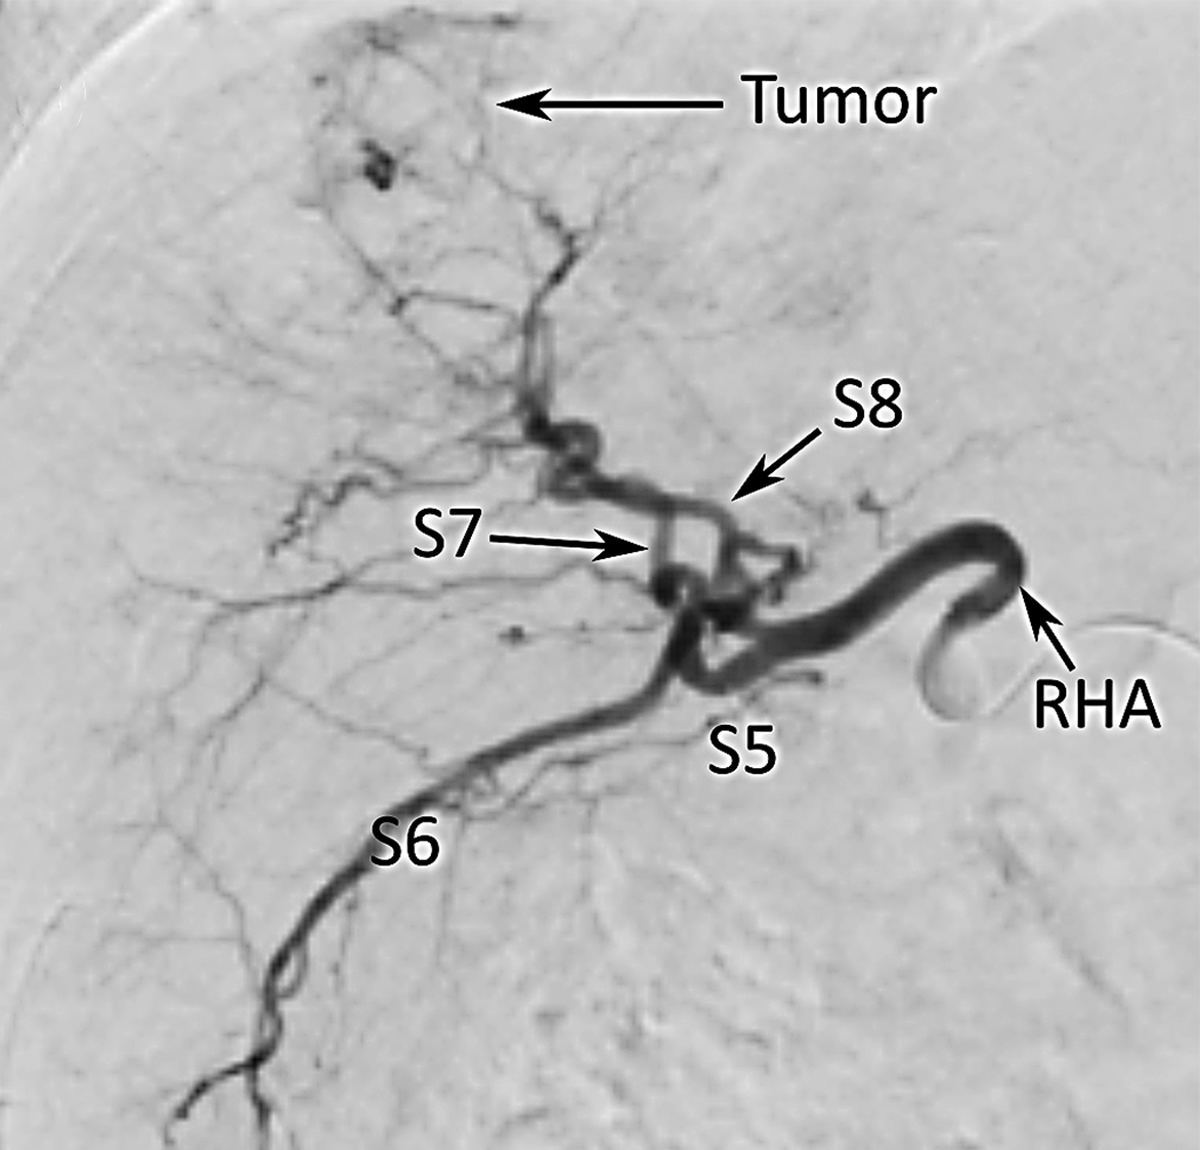
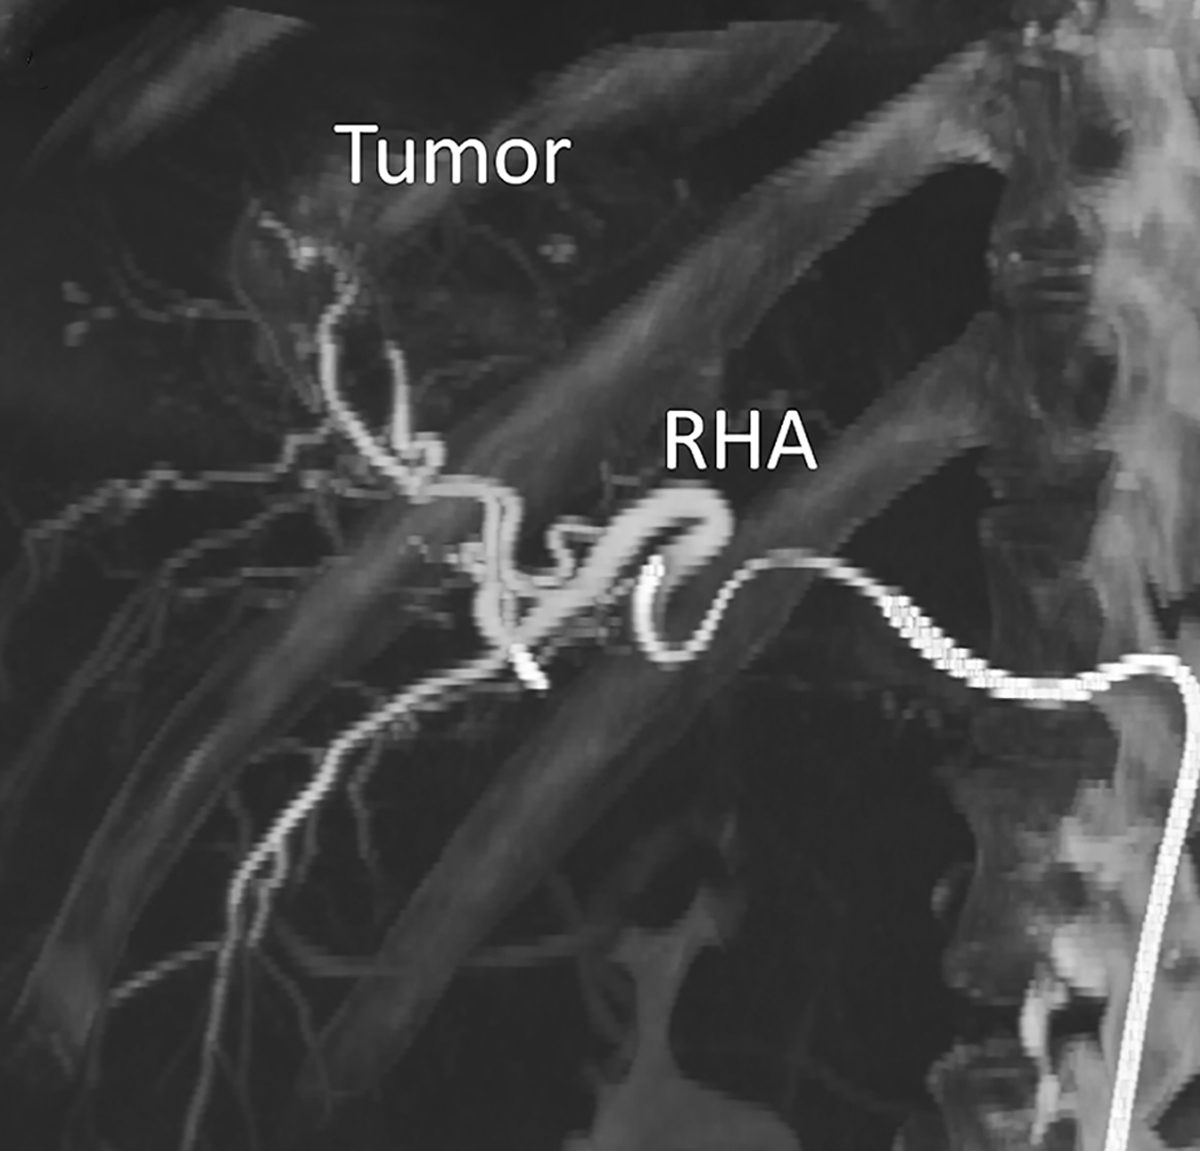
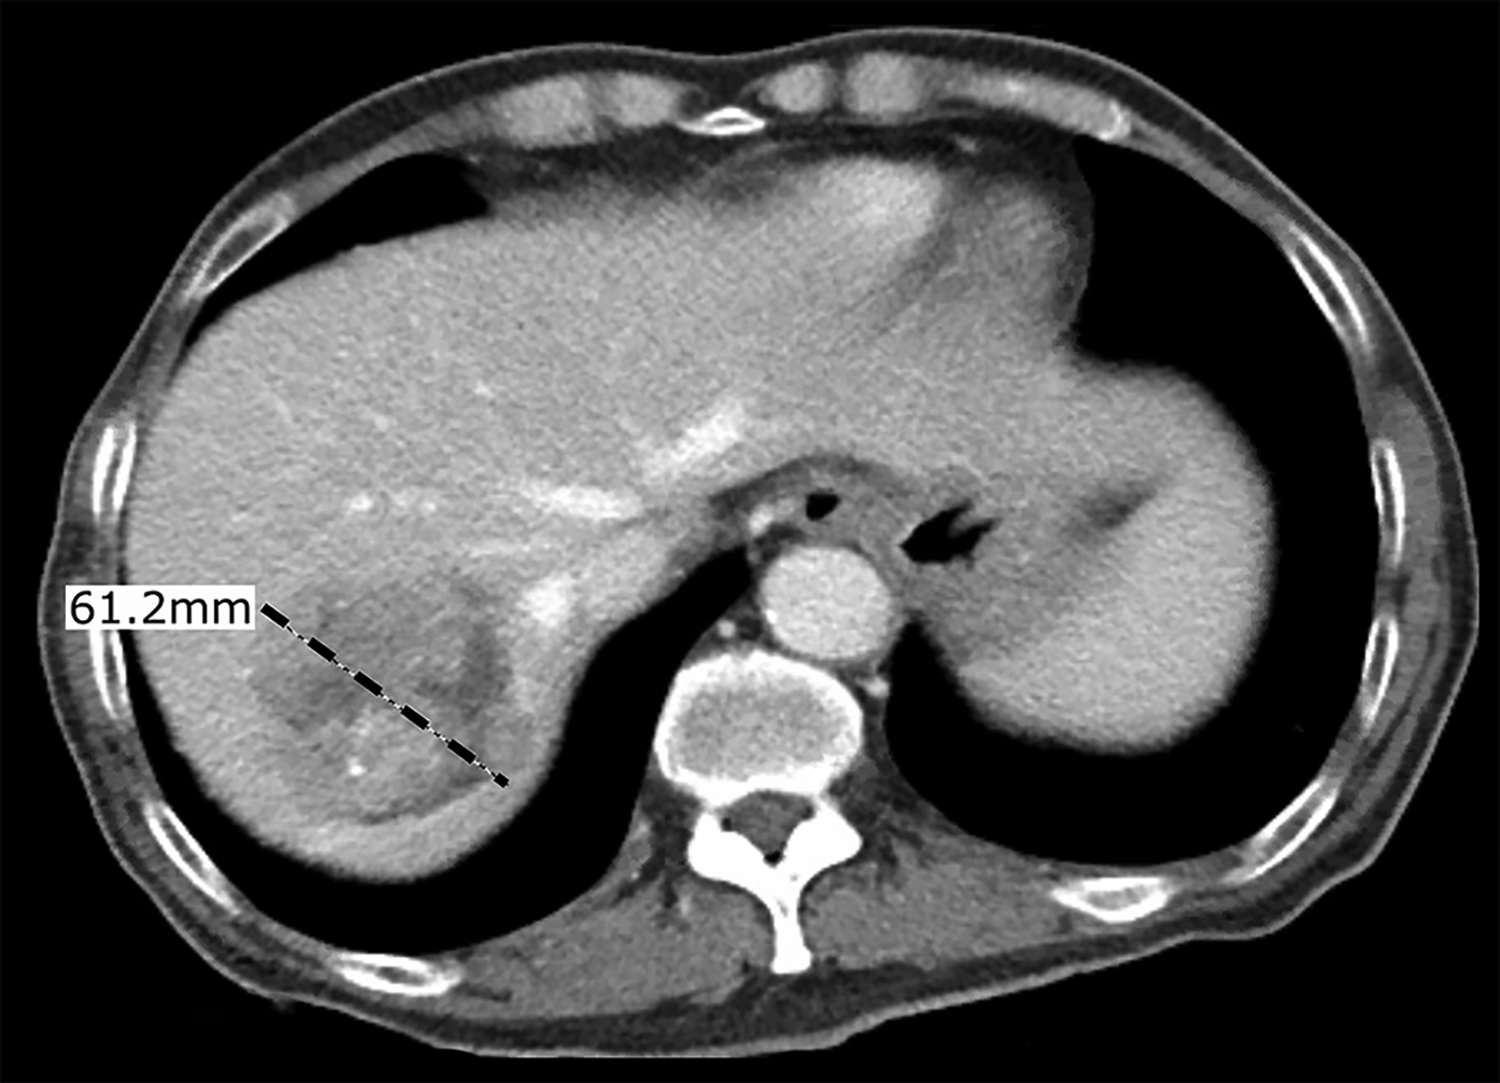
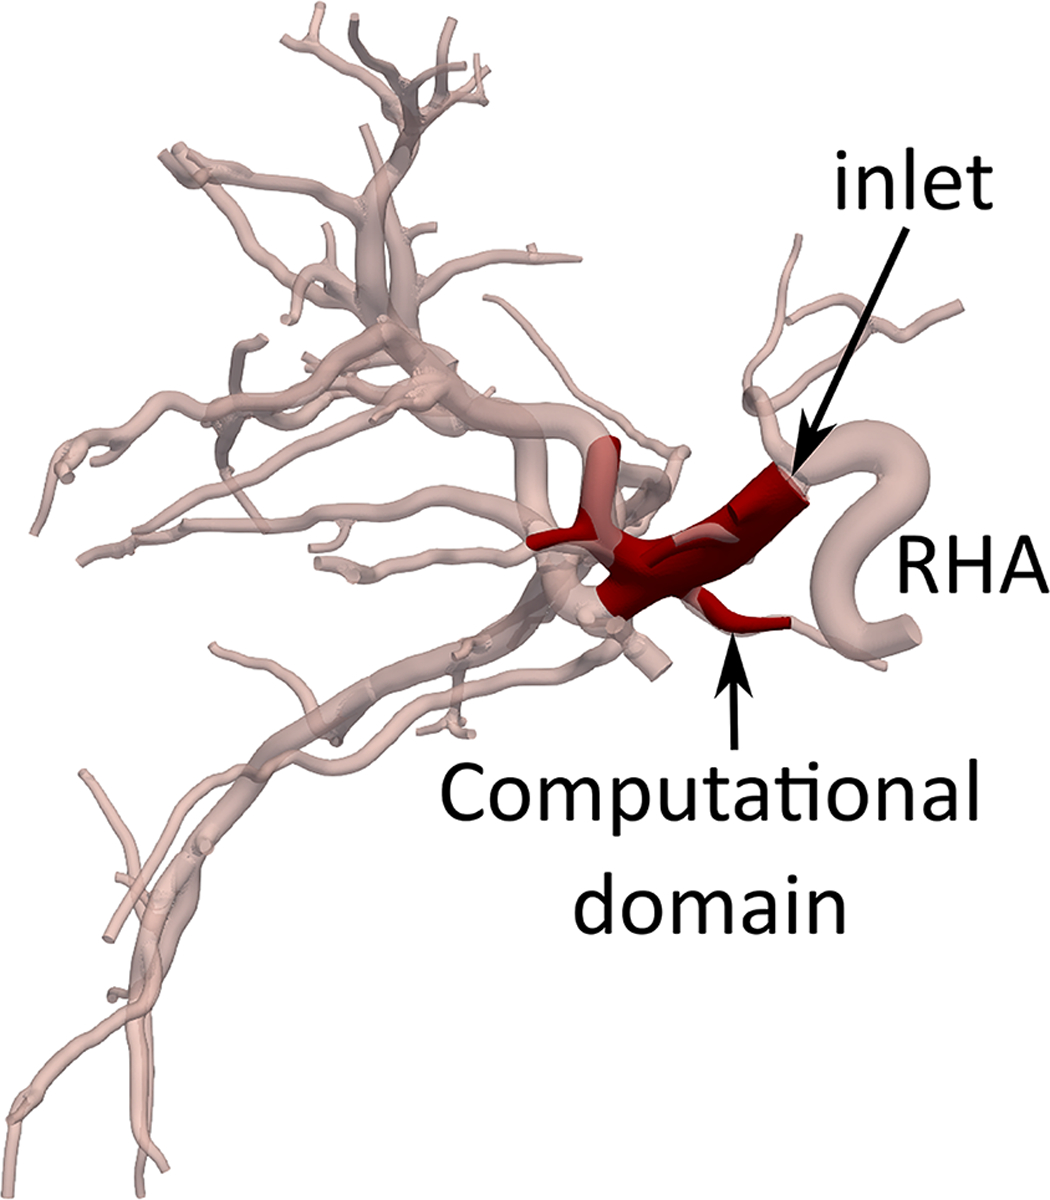

Hepatic arterial tree segmentation and the region of interest definition. The patient was diagnosed with hepatocellular carcinoma in segments 7 and 8, based on a 4-phase contrast-enhanced CT obtained prior to treatment planning. The main lesion was measured to be 61.2 mm. Outlet O5 is located in a branch going to the tumor. The patient was treated with a total of GBq of 90Y microspheres delivered in a selective injection (1.37 GBq) and a lobar injection (1.63 Gbq). (a) Digital subtraction angiography. (b) Coronal view of cone-beam CT scan. (c) Axial view of contrast-enhanced CT scan. (d) 3D right hepatic arterial tree segmented from cone-beam CT. The viewing angle is slightly different in subfigures (a), (b), and (d). (e) Section of the right hepatic artery trunk selected as the region of interest, i.e., the computational domain.
Hepatic Artery Segmentation
The hepatic arterial tree was segmented from the CBCT scans by a previously developed fast marching method [15] using the open-source Vascular Modeling Toolkit (vmtk 1.4.0, Orobix Srl, Bergamo, Italy) and MATLAB (R2018b, The MathWorks, Inc., Natick, MA, USA). Figure 2d shows the 3D right hepatic artery (RHA) and its daughter branches with 70 segmented outlets feeding the downstream vascular bed in the right hepatic lobe. The segmented artery diameters ranged from 0.56 mm to 4.60 mm.
Computational Domain
The computational domain was chosen to allow for the sampling of the injection location and study the resulting downstream microsphere distribution. The computational domain (Fig 2e) was limited to the trunk of the RHA with one inlet and six outlets (O1-O6) in order to reduce the computation time to an affordable level. This reduction has previously shown minimal effects on CFD simulation results (i.e., distal 90Y distribution estimation) [16].
Blood Flow Simulation
To simulate a lobar injection (intended to shrink the right lobe before lobectomy), the injection sites were only selected in the RHA upstream of the first bifurcation. Since the radial position of the catheter in the injection plane changes due to the cardiac cycle and injection velocity, the blood flow in the computational domain was modeled for injection locations at different eccentricities in two planes of A and B (~20 mm and 5 mm upstream of the first bifurcation, respectively). The axial and radial arrangements of these locations are shown in Fig 3. The goal of this study was not to replicate the clinical procedure (e.g., the catheter location used during the procedure), rather to sample the parameter space defined by the catheter geometry, positioning, and patient arterial tree. The patient’s hepatic artery geometry was used as an experimental model to study the effect of catheter location in a realistic geometry. The computational domain was discretized by tetrahedral mesh elements (Appendix A).
Figure 3 –
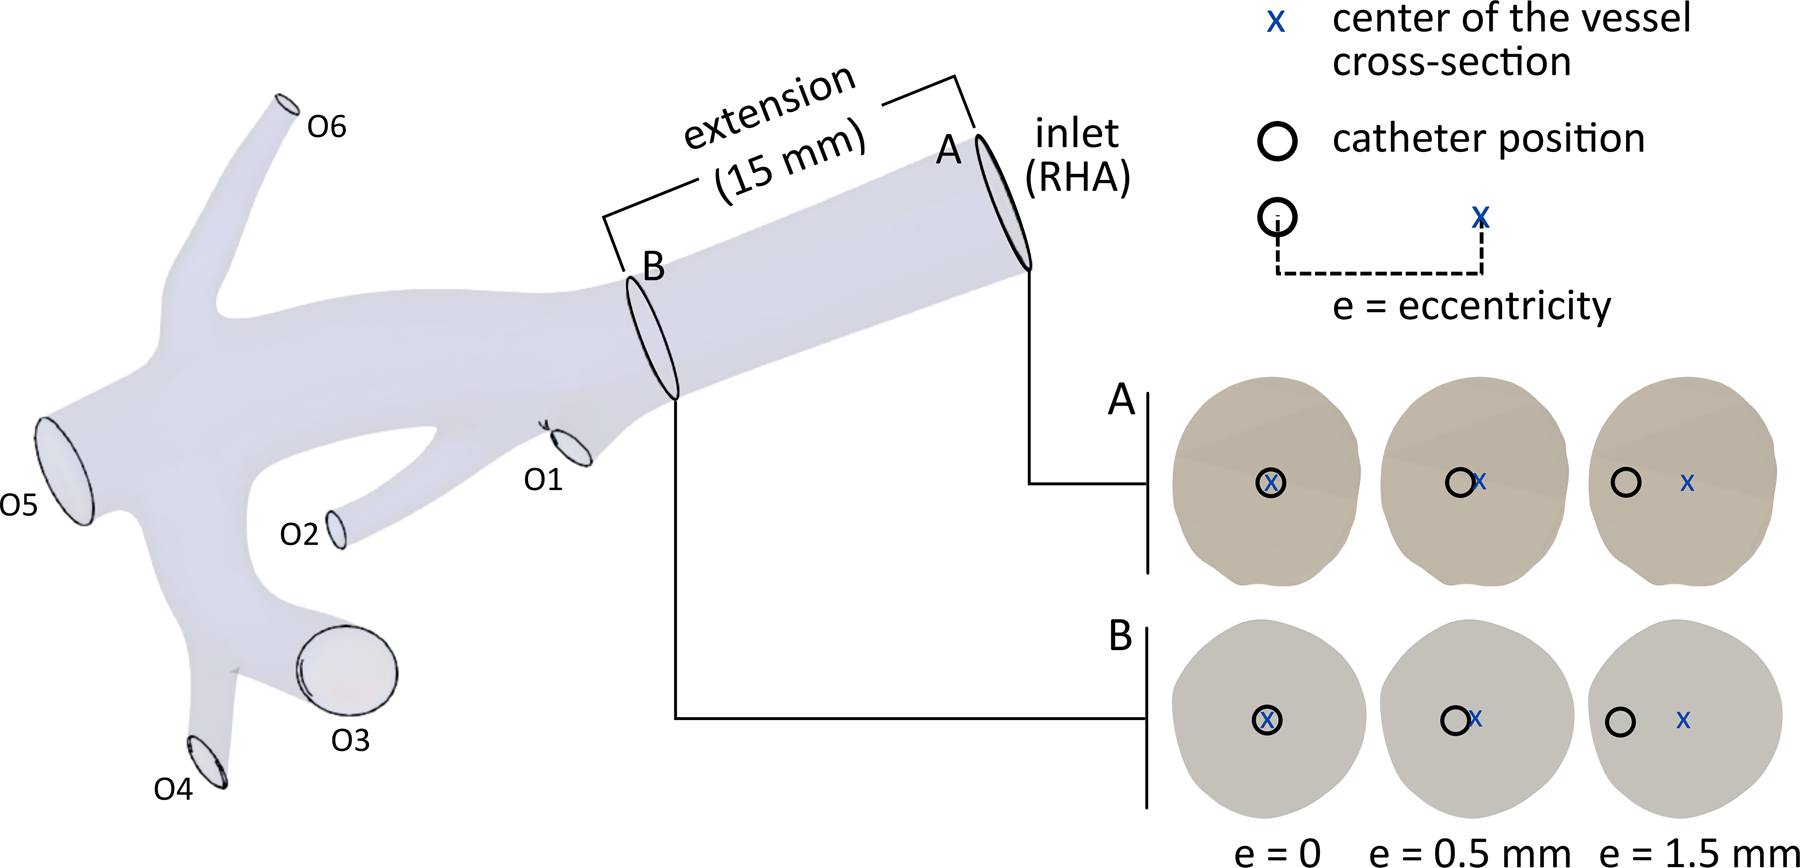
Computational domain, two injection planes A and B along the axis of the RHA, and radial injection locations, i.e., injections in the same injection plane but with different eccentricities. The eccentricity (e), which is calculated as the distance between the centers of the vessel and the catheter, varies from 0 to 1.5 mm.
A pulsatile blood flow rate was imposed at the inlet for unsteady simulations. The flow rate was corrected for the tumor presence in the right hepatic lobe compared to a healthy liver [8], [17]. For each catheter position, the velocity profile at the inlet was calculated using a pipeline that generates the inlet boundary condition in the presence of a catheter [18]. In all simulations, a 2.4F microcatheter (ProGreat, Terumo Interventional Systems, Somerset, NJ) with an outer diameter of 0.8 mm and an inner diameter of 0.57 mm was modeled at the inlet, similar to what is routinely used clinically. The injection flow was assumed to be fully-developed with a parabolic velocity profile and a rate of 0.33 ml/sec (~ injection using a 20 ml syringe injected over 60 seconds). At each outlet, the behavior of the downstream vascular bed including the differences in blood flow to the tumor and normal parenchyma was represented with a lumped parameter model consisting of a proximal resistance, a distal resistance, and a capacitance. The total resistance (i.e. summation of distal and proximal resistances), the ratio between proximal and distal resistances, and the total capacitance of each liver segment were calculated based on previous studies [19], [20] and were split between the outlets associated with that segment based on Murray’s law [21] with a Murray coefficient of 2.5 [22]. A distal pressure of 19 mmHg was considered at the sinusoid level [20].
Blood was assumed to be an incompressible Newtonian fluid with a dynamic viscosity and density of 4 × 10⁻³ gr.mm−1.sec−1 and 1.06 × 10⁻³ gr.mm−3, respectively. Similar to prior CFD studies [11], [23], the arterial walls were assumed to be rigid. A no-slip condition was considered at the arterial and catheter walls. The incompressible Navier-Stokes equations of conservation of mass and momentum were solved to calculate the flow field. The simulations were run for a duration of six cardiac cycles with a step size of 0.01 of a cardiac cycle (~ 0.01 sec) to ensure convergence (lower bound on the residual norm equal to 10−3). The open-source software SimVascular was used to carry out the CFD simulations [21]. Each simulation took about seven hours on a 64-bit Windows machine with Intel Xeon Silver 4110 CPU and 64 GB RAM.
90Y Microsphere Distribution
Based on the blood viscosity, the density (~ 3600 kg.m−3) and diameter (20–30 µm) of 90Y glass microspheres (TheraSpheres®, Boston Scientific, Marlborough MA), the Stokes number that determines the microsphere behavior in the flow is much less than 1 in all investigated cases. Therefore, it was assumed that the 90Y microspheres were transported along the blood flow streamlines [24] and that the microsphere distribution was correlated with the blood flow distribution in the hepatic arterial tree. Furthermore, it was assumed that the microspheres do not alter the downstream flow. This assumption may not be accurate for dose vials with a high number of particles (or the use of multiple vials with large numbers of particles).
To quantitatively analyze the distribution of 90Y microspheres, the CFD simulation results were used to create particle release maps (PRMs) at the catheter outlet for 10 intervals of the cardiac cycle. A PRM is a map generated by integrating the blood flow streamlines from the catheter outlet (located within the computational domain inlet) to the computational domain outlets. Thus, it depicts the final destination of the microspheres released from any specific point in the catheter outlet cross-section (e.g., which outlet or hepatic segment). Figure 4a shows a representative PRM where each color corresponds to an outlet.
Figure 4 –
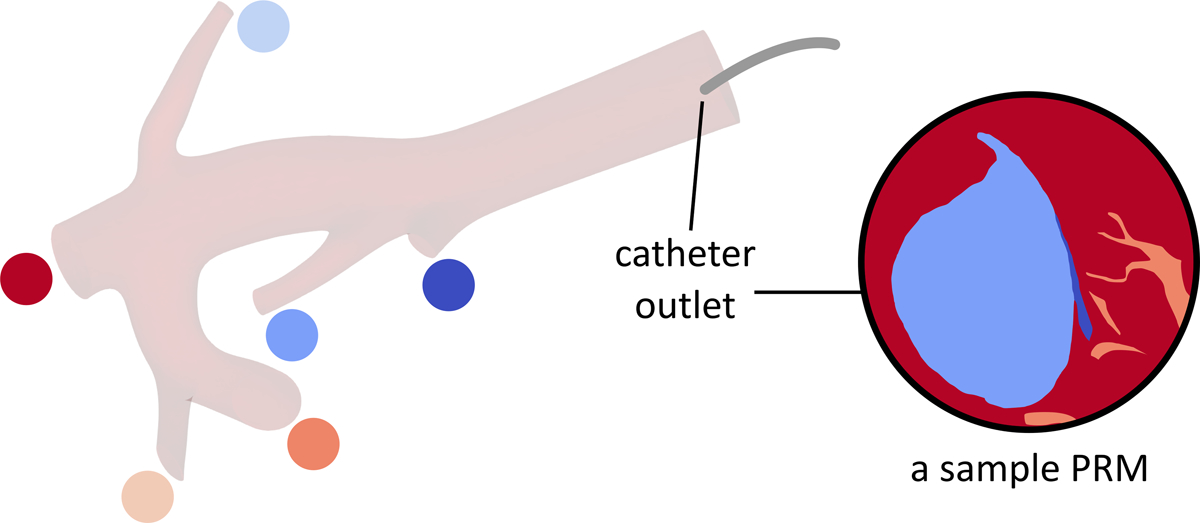
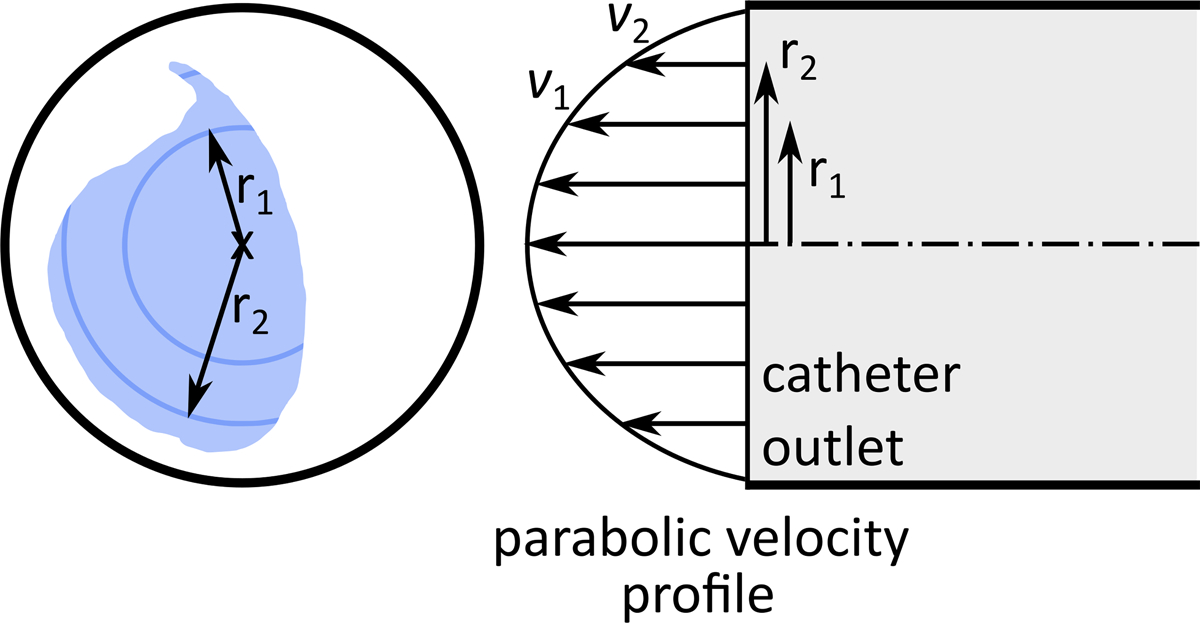
(a) An arbitrary particle release map (PRM). (b) Injection parabolic velocity profile.
It was assumed that the microspheres were distributed homogenously in the catheter tip cross-section. Due to the parabolic velocity profile of the injection flow, the farther the microspheres are from the catheter wall, the faster they move (Fig 4b). Thus, to calculate the fraction of microspheres delivered to each outlet, the injection velocity was integrated over the PRM area corresponding to each outlet (i.e., with the same color in Fig 4). The results were then integrated over a cardiac cycle since the PRMs vary with the pulsatile blood flow [19].
RESULTS
Catheter Flow Streamlines
Figure 5 shows the catheter flow streamlines (i.e., the flow ejected from the catheter) for all models at three time points during a cardiac cycle (t* =0, 0.2, and 0.5). The streamline colors represent the axial velocity of the blood flow. The streamlines and their corresponding target outlets changed during the cardiac cycle in all simulations regardless of the injection location. For example, for an injection at the center of plane A, while a part of the 90Y microspheres was delivered to outlet O2 at t* = 0, this outlet received no activity at either t* = 0.2 or 0.5. Similar variations can be seen for the rest of the injection locations. The final delivery of the microspheres highly depends on the injection plane and the catheter eccentricity. For example, at t* = 0.5, while the catheter flow was distributed between outlets O3, O4, and O5 for an injection at the center of plane A, it was delivered to outlets O2, O3, and O5 when the catheter was placed at the center of plane B.
Figure 5 –
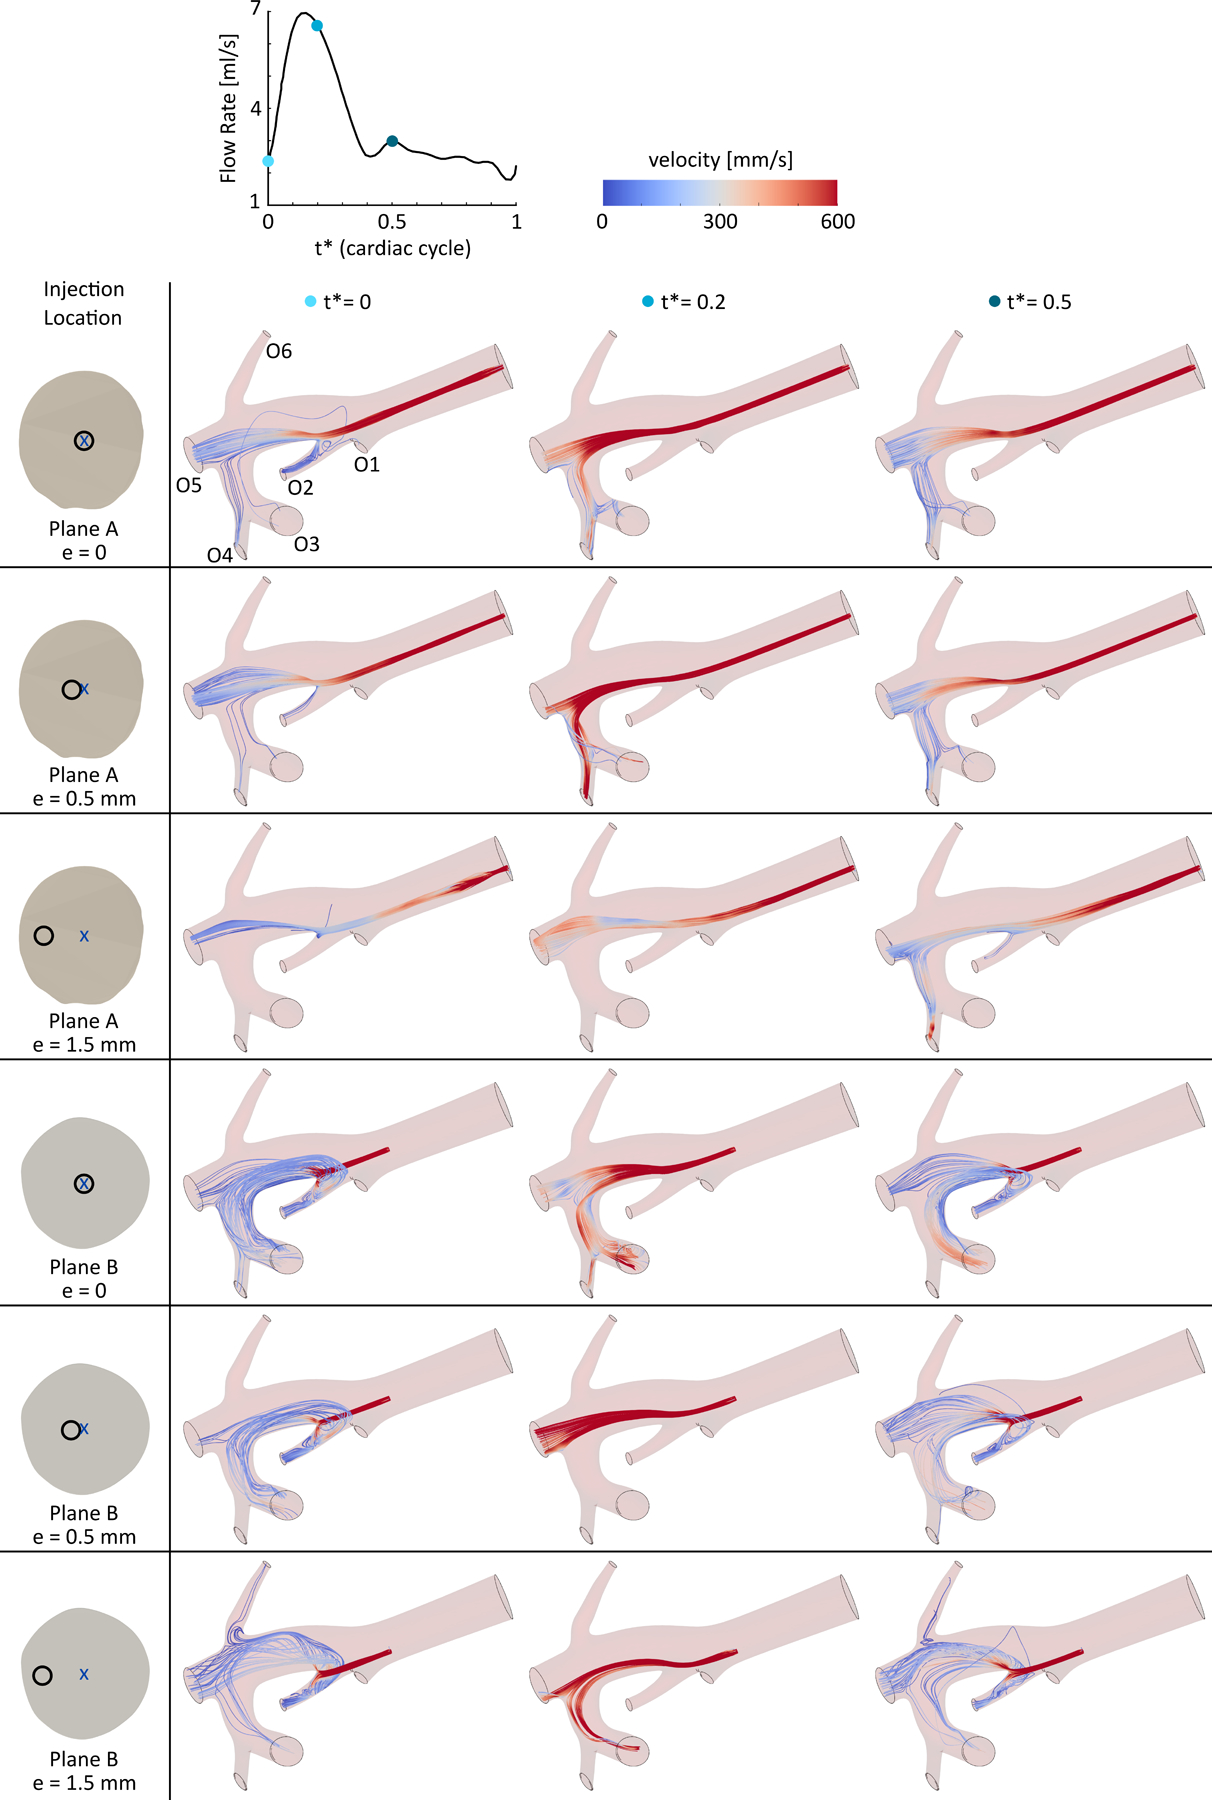
Catheter flow streamlines at three time points (t* = 0, 0.2, and 0.5) during a cardiac cycle for different injection locations in planes A and B with eccentricities ranging from 0 to 1.5 mm. See online supplementary video for dynamic streamlines during a cardiac cycle.
Local Circulations
Figure 6 shows the blood flow and catheter flow streamlines downstream of the injection location for the CFD models with the catheter tip in plane A at t* = 0.8. The slower blood flow adjacent to the catheter tended to mix with the faster catheter flow close to the catheter outlet. Similar behavior was observed when considering other injection time points within the cardiac cycle. Recirculation zones were also observed in configurations where the catheter was closer to the arterial wall (i.e., larger eccentricity values). This was due to the catheter flow faster than the blood flow between the catheter jet and the arterial walls. A recirculation zone is shown in the right panel of Fig 6 with an eccentricity of 1.5 mm (~ 65% of the RHA radius).
Figure 6 –
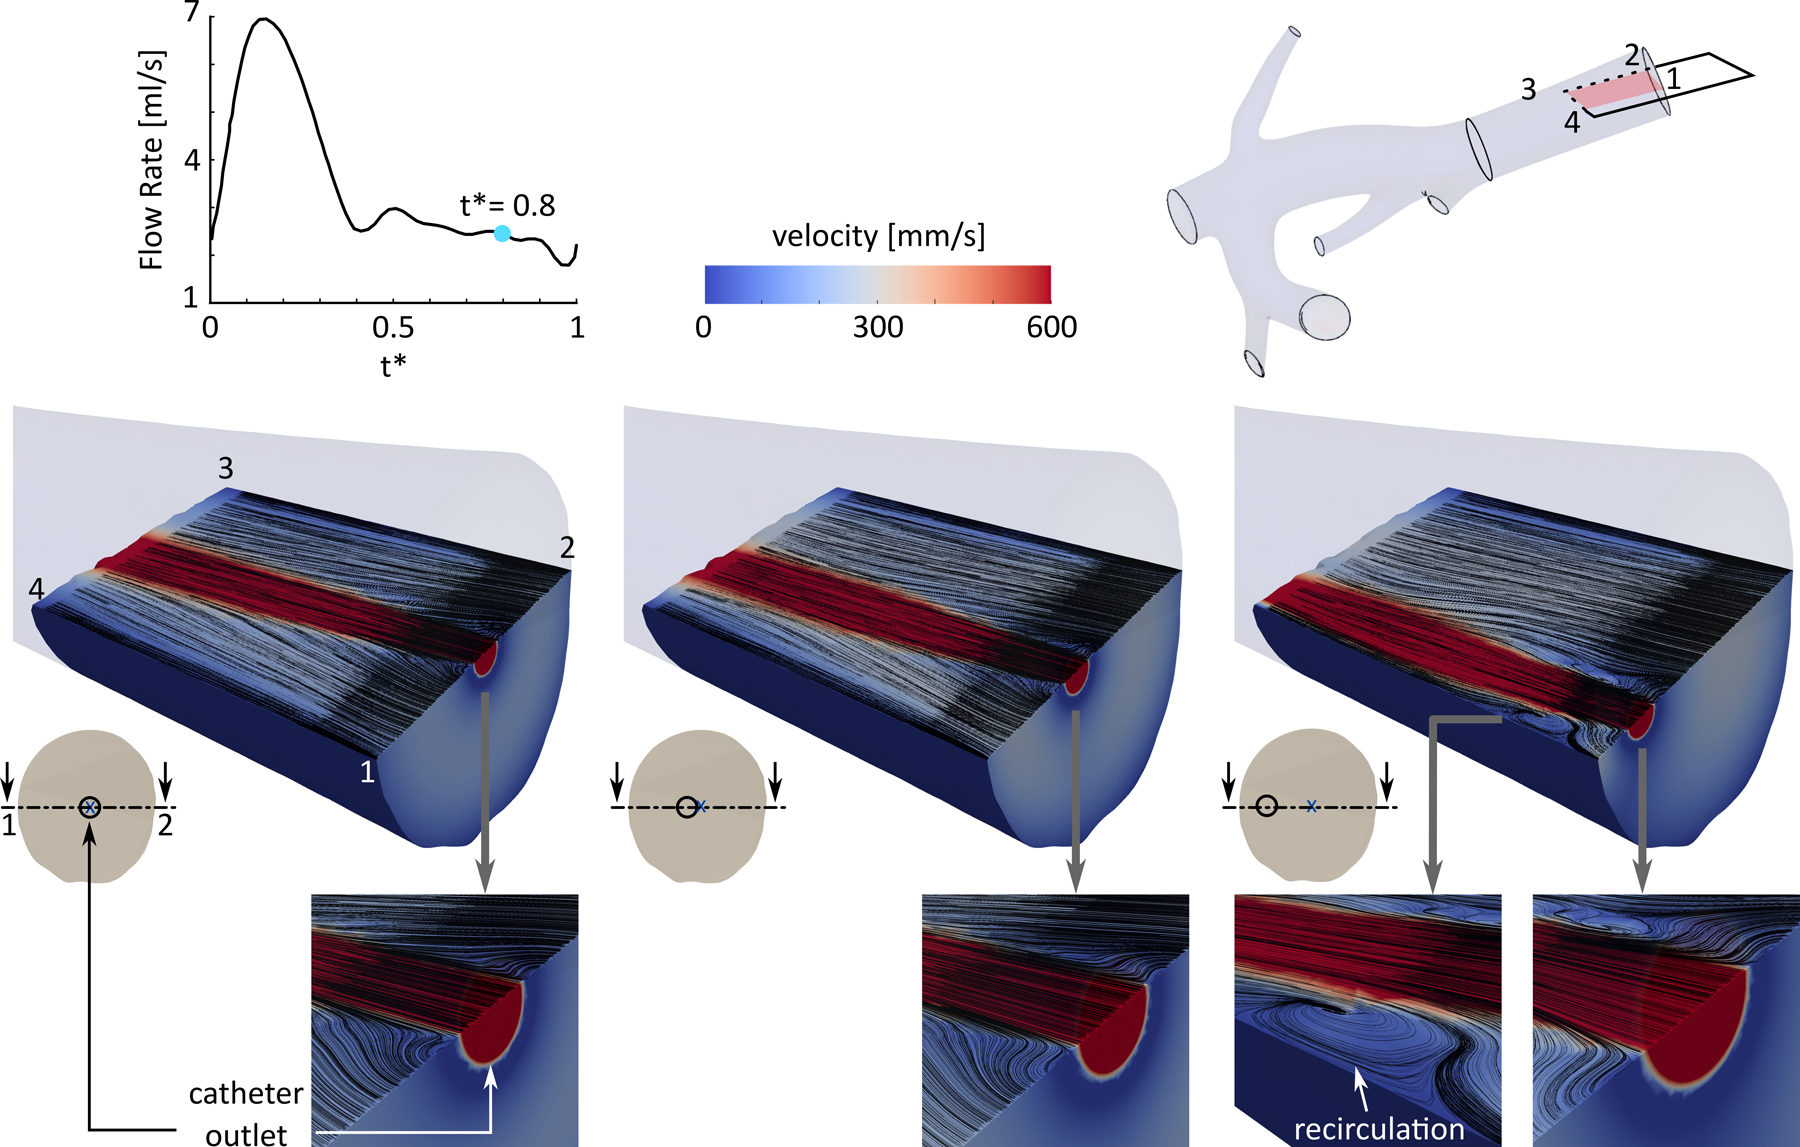
Local flow field downstream of the injection plane for three catheter locations in plane A at t* = 0.8, shown in arterial cross-sections. The black lines show the catheter and blood flow streamlines.
When the injection is closer to the bifurcation (plane B versus plane A), stronger recirculation zones appear close to the bifurcations, affecting the downstream blood flow streamlines and microsphere distribution. For example, Fig 7 shows the recirculation zone generated in the entrance of outlet O2 when the catheter was located in plane B compared to plane A with an eccentricity of 0.5 mm. The arrows indicate the magnitude of the velocity components in the selected cross-section, i.e., section 5–6-7–8. Results showed that the recirculation zone existed with varying swirl strength throughout the cardiac cycle. When the blood flow is slower (e.g., at t* = 0), the difference between the velocity of the blood flow and the catheter jet is larger, resulting in a larger swirl strength. While at t* = 0.2 with a higher blood flow rate, the recirculation was weaker.
Figure 7 –
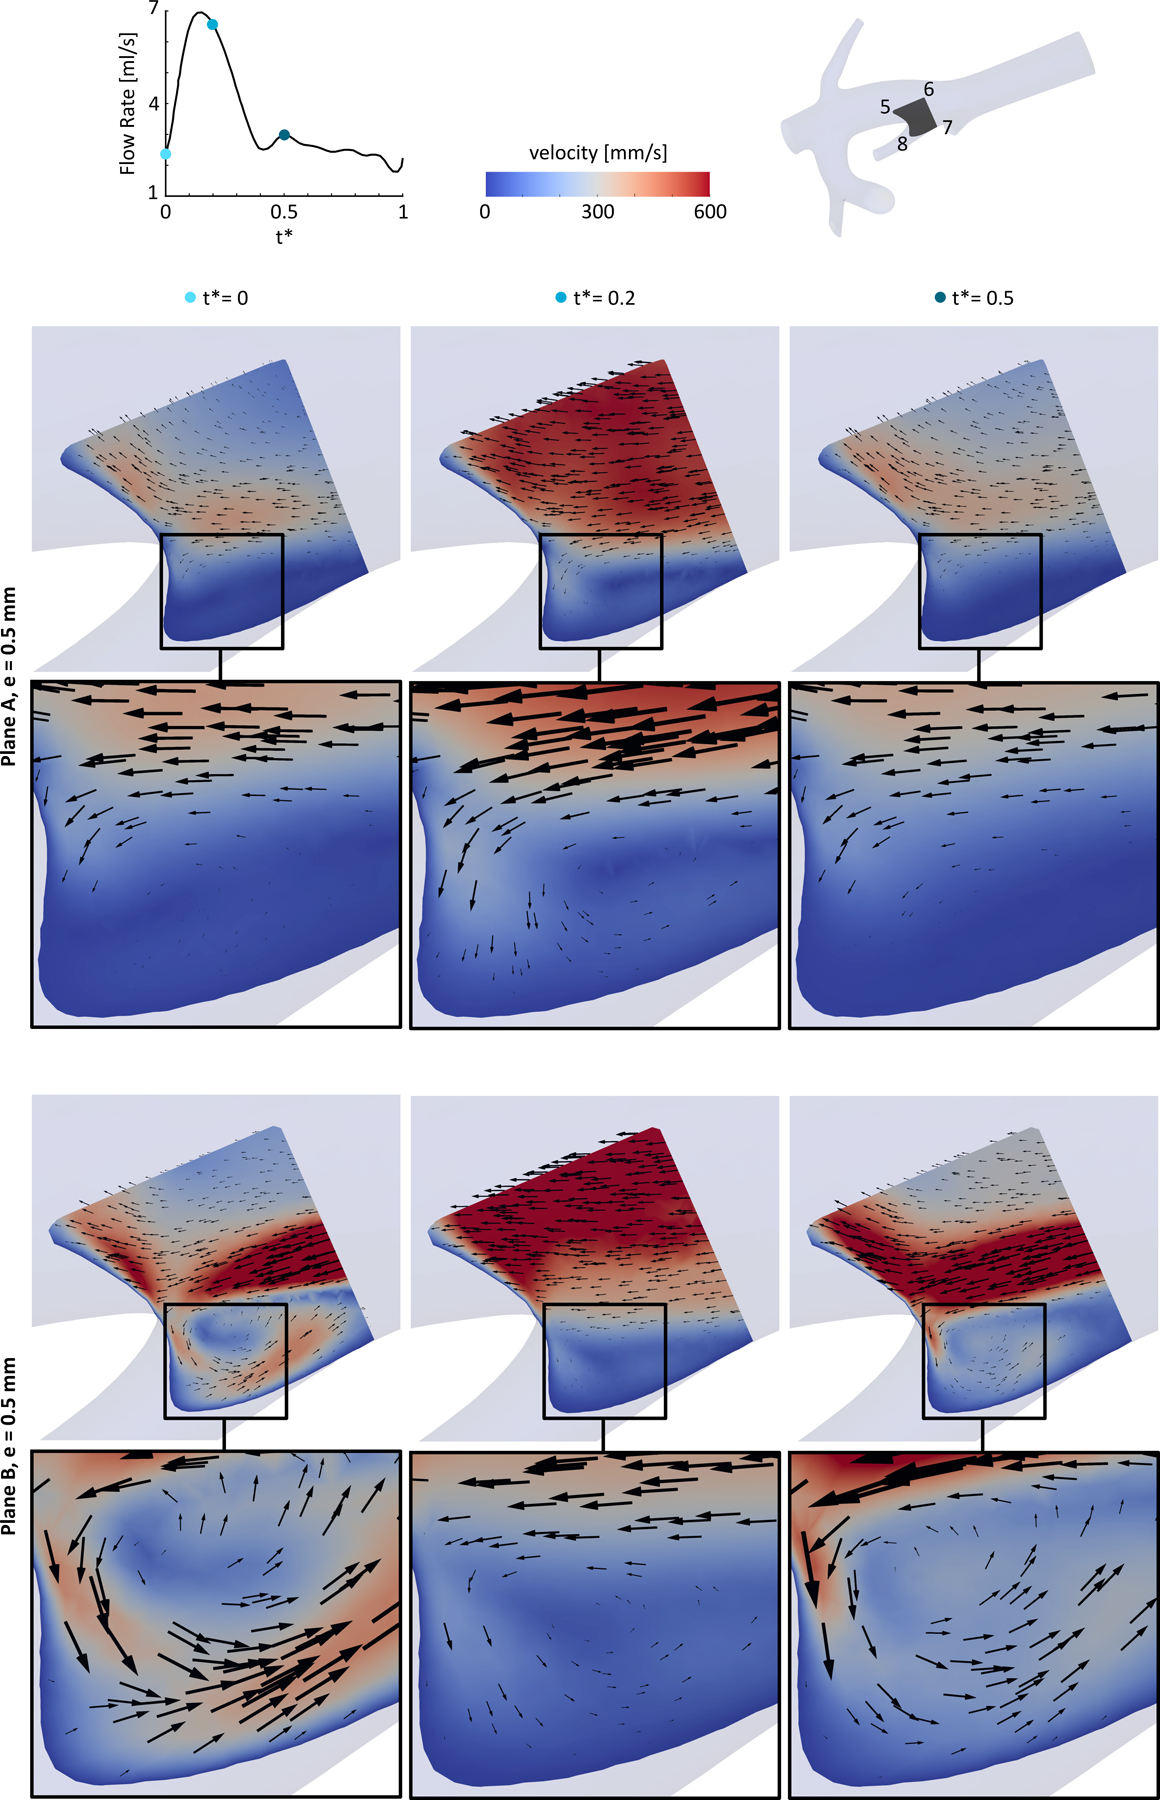
A recirculation zone in a cross-section close to one of the bifurcations splitting to outlet O2 and the main trunk. The catheter was located in plane A and plane B with an eccentricity of 0.5 mm.
Particle Release Maps and 90Y Distribution
Figure 8 shows the delivery of 90Y microspheres to each outlet calculated from the PRMs for each injection location (far or near the bifurcation and for different eccentricities). Results show that the microsphere distribution depends on the axial and radial position of the catheter inside the RHA. For the catheter tip in plane A (far from the bifurcation), 63–72%microspheres were delivered to outlet O5 and 20–23% to outlet O3. Outlets O1 and O6 almost received no catheter flow and microspheres. When the catheter outlet was positioned in plane B, the microsphere distribution varied significantly with the catheter eccentricity. For example, by positioning the catheter 1.5 mm off the vessel center, while the microsphere delivery to outlet O4 decreased by 53% (from 62% to 9%), it increased by ~21% to outlet O2. These simulations in a truncated geometry indicate large differences in microsphere distribution between daughter branches considered in this computational domain. These variations will propagate in smaller branches further downstream, affecting the irradiation of the tumor.
Figure 8 –

90Y distribution for injection locations in planes A and B with different eccentricities, 0 < e < 1.5 mm.
DISCUSSION
Numerical simulations were carried out to noninvasively investigate and quantify the effect of injection location on the microsphere delivery in liver cancer radioembolization in one patient, with the ultimate goal of providing guidance on the importance of these parameters when planning the intervention. These results, presented for one patient, do not yield general quantitative conclusions (e.g., about 90Y distribution).
Results confirmed that the injection location affects the local flow field downstream of the inlet and consequently changes the 90Y microsphere distribution. These results are consistent with previous studies about the impact of the catheter tip position on the hepatic artery hemodynamics [25]. These CFD simulations are part of a broader framework called CFDose under development to calculate the absorbed dose distribution in the liver using voxel dosimetry by combining 90Y radiation physics and CFD [10]. We qualitatively validated this approach against positron emission tomography (PET) and have recently demonstrated the use of total body PET which high sensitivity and spatial resolution will be leveraged for quantitative validation [26].
One of the main objectives of this study was to evaluate the impact of the injection distance from a bifurcation. Considering the computational cost of numerical simulations and the infinite combinations of radial and axial catheter tip positions upstream of a bifurcation, it is impossible to sample all potential injection sites in these simulations. Therefore, two injection sites, far and near the bifurcation, were selected. In addition, since the radial position of the catheter cannot be controlled clinically, the microsphere distribution was estimated at three different radial positions in each injection site to investigate the effect of radial movements of the catheter tip during the injection. Results showed that variations in the microsphere distribution between the outlets resulting from placing the catheter in different radial locations (i.e., different eccentricities) were within 10% of the total number of microspheres when the catheter tip was at an axial distance of three times the RHA diameter from the first bifurcation. However, an injection plane closer to the first downstream bifurcation created stronger flow disturbances downstream of the catheter.
It then strongly affected the catheter flow distribution when changing the catheter’s radial position. The following suggestions are made based on these findings.
First, the variations in the microsphere distribution due to radial movement of the catheter position within the injection plane depend on the distance between the injection plane and the first bifurcation in the downstream vascular bed. The farther the injection plane from the bifurcation is selected, the smaller the variations. Therefore, since it is difficult or impossible to control the radial position of the catheter especially in the distal locations, these results recommend using an injection plane where the effect of radial position is smaller. The optimal distance between the injection plane and the first bifurcation depends on different factors, including the hepatic arterial velocity and anatomy. For the vascular bed considered in this work, an injection plane at a distance of three RHA diameters upstream of the first bifurcation resulted in a maximum of 10% variations (due to inevitable radial movements of the catheter tip) in the microspheres delivered to the downstream branches.
Second, the strong effect of catheter positioning can be extended to 99mTc-macroaggregated albumin (MAA). Even if it is assumed that MAA can simulate the behavior of 90Y microspheres regardless of their different physical properties, any deviation from the position of the catheter during the pre-treatment injection might result in a different distribution of the 90Y microspheres during the treatment especially when the injection plane is near a bifurcation. This is consistent with the previous clinical studies suggesting that the misposition of the catheter tip results in disagreements between 99mTc-MAA and 90Y distribution of activity concentration [4].
This study was carried out for one patient only with some assumptions, such as a fully-developed injection flow. Future studies may employ a more realistic inlet condition to account for other parameters such as the effect of the release valve in glass microsphere administrative kits, microsphere clumping, nonuniform trapping, impact of tumor vascularity, additional tumors, pulsatile 90Y injection (to enhance turbulence), different rates of injection, injection during specific phases of the cardiac cycle (e.g., diastole to increase eddies), and vascular bed saturation. A larger patient cohort might also bring general recommendations such as the minimum distance of the catheter tip from the first downstream bifurcation.
In conclusion, this study proved the feasibility of using pre-treatment simulations to quantify the impact of injection location from bifurcation on 90Y microsphere distribution. These numerical simulations could estimate the range of the number of microspheres transported to different parts of the liver for different radial locations of the catheter in the injection plane and thus provide a measure of the resulting error for the interventional radiologist to choose accordingly. These estimations can help achieve personalized dosimetry based on the hepatic hemodynamics of each patient to increase the radiation dose to the diseased region while decreasing it to normal tissue. This study also offered a validation of clinical findings that microsphere distribution is often affected when the tip of the catheter is near the bifurcation especially in the presence of inevitable radial movements of the catheter tip.
Supplementary Material
Research Highlights.
In radioembolization, the variations in the 90Y microsphere distribution due to radial movement of the catheter tip within the injection plane depend on the distance between the injection site and the first bifurcation in the downstream vascular bed
An injection location far from bifurcations is recommended to minimize the effect of radial movements of the catheter tip on the microsphere distribution
Numerical simulations could estimate the variation of the microsphere distribution in different parts of the liver as a result of unwanted radial movements of the catheter tip in the injection plane
Acknowledgments:
The authors would like to thank Selin Berk from the University of California Los Angeles for helping in the preparation of the CAD model with extension at the inlet.
Funding sources:
This research was funded by the National Institutes of Health, Grant Numbers NCI (CCSG) P30 CA093373 and R21 CA237686.
Footnotes
Publisher's Disclaimer: This is a PDF file of an unedited manuscript that has been accepted for publication. As a service to our customers we are providing this early version of the manuscript. The manuscript will undergo copyediting, typesetting, and review of the resulting proof before it is published in its final form. Please note that during the production process errors may be discovered which could affect the content, and all legal disclaimers that apply to the journal pertain.
Conflicts of interest and financial disclosures: Catherine Vu is in the Medical Advisory Board of Boston Scientific and TriSalus Life Sciences. Other authors declare no conflict of interest.
SIR meeting: This material is not presented at an SIR Annual Scientific Meeting.
References
- [1].Padia SA et al. , “Radioembolization of Hepatic Malignancies: Background, Quality Improvement Guidelines, and Future Directions,” J. Vasc. Interv. Radiol, vol. 28, no. 1, pp. 1–15, Jan. 2017, doi: 10.1016/j.jvir.2016.09.024. [DOI] [PubMed] [Google Scholar]
- [2].Levillain H et al. , “International recommendations for personalised selective internal radiation therapy of primary and metastatic liver diseases with yttrium-90 resin microspheres,” Eur. J. Nucl. Med. Mol. Imaging, vol. 48, no. 5, pp. 1570–1584, May 2021, doi: 10.1007/s00259-020-05163-5. [DOI] [PMC free article] [PubMed] [Google Scholar]
- [3].Chiesa C et al. , “Radioembolization of hepatocarcinoma with 90Y glass microspheres: development of an individualized treatment planning strategy based on dosimetry and radiobiology,” Eur. J. Nucl. Med. Mol. Imaging, vol. 42, no. 11, pp. 1718–1738, Oct. 2015, doi: 10.1007/s00259-015-3068-8. [DOI] [PubMed] [Google Scholar]
- [4].Wondergem M et al. , “99mTc-Macroaggregated Albumin Poorly Predicts the Intrahepatic Distribution of 90Y Resin Microspheres in Hepatic Radioembolization,” J. Nucl. Med, vol. 54, no. 8, pp. 1294–1301, Aug. 2013, doi: 10.2967/jnumed.112.117614. [DOI] [PubMed] [Google Scholar]
- [5].Jiang M et al. , “Segmental Perfusion Differences on Paired Tc-99m Macroaggregated Albumin (MAA) Hepatic Perfusion Imaging and Yttrium-90 (Y-90) Bremsstrahlung Imaging Studies in SIR-Sphere Radioembolization: Associations with Angiography,” J. Nucl. Med. Radiat. Ther., vol. 03, no. 01, 2012, doi: 10.4172/2155-9619.1000122. [DOI] [Google Scholar]
- [6].Arepally A et al. , “Quantification and Reduction of Reflux during Embolotherapy Using an Antireflux Catheter and Tantalum Microspheres: Ex Vivo Analysis,” J. Vasc. Interv. Radiol, vol. 24, no. 4, pp. 575–580, Apr. 2013, doi: 10.1016/j.jvir.2012.12.018. [DOI] [PubMed] [Google Scholar]
- [7].Smits MLJ et al. , “Radioembolization Dosimetry: The Road Ahead,” Cardiovasc. Intervent. Radiol, vol. 38, no. 2, pp. 261–269, Apr. 2015, doi: 10.1007/s00270-014-1042-7. [DOI] [PubMed] [Google Scholar]
- [8].C. A. Basciano et al. , “Computer modeling of controlled microsphere release and targeting in a representative hepatic artery system,” Ann. Biomed. Eng, vol. 38, no. 5, pp. 1862–1879, 2010, doi: 10.1007/s10439-010-9955-z. [DOI] [PubMed] [Google Scholar]
- [9].Taebi A et al. , “Computational Modeling of the Liver Arterial Blood Flow for Microsphere Therapy: Effect of Boundary Conditions,” Bioengineering, vol. 7, no. 3, p. 64, Jun. 2020, doi: 10.3390/bioengineering7030064. [DOI] [PMC free article] [PubMed] [Google Scholar]
- [10].Roncali E et al. , “Personalized Dosimetry for Liver Cancer Y-90 Radioembolization Using Computational Fluid Dynamics and Monte Carlo Simulation,” Ann. Biomed. Eng, vol. 48, no. 5, pp. 1499–1510, May 2020, doi: 10.1007/s10439-020-02469-1. [DOI] [PMC free article] [PubMed] [Google Scholar]
- [11].Kleinstreuer C et al. , “A New Catheter for Tumor Targeting With Radioactive Microspheres in Representative Hepatic Artery Systems. Part I: Impact of Catheter Presence on Local Blood Flow and Microsphere Delivery,” J. Biomech. Eng, vol. 134, no. 5, p. 051004, May 2012, doi: 10.1115/1.4006684. [DOI] [PubMed] [Google Scholar]
- [12].Childress EM et al. , “A New Catheter for Tumor-Targeting With Radioactive Microspheres in Representative Hepatic Artery Systems—Part II: Solid Tumor-Targeting in a Patient-Inspired Hepatic Artery System,” J. Biomech. Eng, vol. 134, no. 5, p. 051005, May 2012, doi: 10.1115/1.4006685. [DOI] [PubMed] [Google Scholar]
- [13].Childress EM and Kleinstreuer C, “Computationally Efficient Particle Release Map Determination for Direct Tumor-Targeting in a Representative Hepatic Artery System,” J. Biomech. Eng, vol. 136, no. 1, p. 011012, Dec. 2013, doi: 10.1115/1.4025881. [DOI] [PubMed] [Google Scholar]
- [14].Aramburu J et al. , “Computational Fluid Dynamics Modeling of Liver Radioembolization: A Review,” Cardiovasc. Intervent. Radiol, vol. 45, no. 1, pp. 12–20, Jan. 2022, doi: 10.1007/s00270-021-02956-5. [DOI] [PMC free article] [PubMed] [Google Scholar]
- [15].Taebi A et al. , “Hepatic arterial tree segmentation: Towards patient-specific dosimetry for liver cancer radioembolization,” J. Nucl. Med, vol. 60, no. supplement 1, p. 122, 2019.29976695 [Google Scholar]
- [16].Lertxundi U et al. , “CFD Simulations of Radioembolization: A Proof-of-Concept Study on the Impact of the Hepatic Artery Tree Truncation,” Mathematics, vol. 9, no. 8, p. 839, Apr. 2021, doi: 10.3390/math9080839. [DOI] [Google Scholar]
- [17].Aramburu J et al. , “Liver cancer arterial perfusion modelling and CFD boundary conditions methodology: a case study of the haemodynamics of a patient-specific hepatic artery in literature-based healthy and tumour-bearing liver scenarios,” Int. j. numer. method. biomed. eng, vol. 32, no. 11, p. e02764, Nov. 2016, doi: 10.1002/cnm.2764. [DOI] [PubMed] [Google Scholar]
- [18].Taebi A et al. , “Realistic boundary conditions in SimVascular through inlet catheter modeling,” BMC Res. Notes, vol. 14, no. 1, p. 215, Dec. 2021, doi: 10.1186/s13104-021-05631-7. [DOI] [PMC free article] [PubMed] [Google Scholar]
- [19].Taebi A et al. , “Multiscale Computational Fluid Dynamics Modeling for Personalized Liver Cancer Radioembolization Dosimetry,” J. Biomech. Eng, vol. 143, no. 1, Jan. 2021, doi: 10.1115/1.4047656. [DOI] [PMC free article] [PubMed] [Google Scholar]
- [20].Wang T et al. , “Global sensitivity analysis of hepatic venous pressure gradient (HVPG) measurement with a stochastic computational model of the hepatic circulation,” Comput. Biol. Med, vol. 97, no. 800, pp. 124–136, 2018, doi: 10.1016/j.compbiomed.2018.04.017. [DOI] [PubMed] [Google Scholar]
- [21].Lan H et al. , “A Re-Engineered Software Interface and Workflow for the Open-Source SimVascular Cardiovascular Modeling Package,” J. Biomech. Eng, vol. 140, no. 2, p. 024501, Jan. 2018, doi: 10.1115/1.4038751. [DOI] [PMC free article] [PubMed] [Google Scholar]
- [22].Sherman TF, “On connecting large vessels to small. The meaning of Murray’s law.,” J. Gen. Physiol, vol. 78, no. 4, pp. 431–453, Oct. 1981, doi: 10.1085/jgp.78.4.431. [DOI] [PMC free article] [PubMed] [Google Scholar]
- [23].Simoncini C et al. , “Towards a patient-specific hepatic arterial modeling for microspheres distribution optimization in SIRT protocol,” Med. Biol. Eng. Comput, vol. 56, no. 3, pp. 515–529, 2018, doi: 10.1007/s11517-017-1703-1. [DOI] [PubMed] [Google Scholar]
- [24].Smith JP et al. , “Microfluidic transport in microdevices for rare cell capture,” Electrophoresis, vol. 33, no. 21, pp. 3133–3142, Nov. 2012, doi: 10.1002/elps.201200263. [DOI] [PMC free article] [PubMed] [Google Scholar]
- [25].Aramburu J et al. , “Numerical investigation of liver radioembolization via computational particle–hemodynamics: The role of the microcatheter distal direction and microsphere injection point and velocity,” J. Biomech, vol. 49, no. 15, pp. 3714–3721, Nov. 2016, doi: 10.1016/j.jbiomech.2016.09.034. [DOI] [PubMed] [Google Scholar]
- [26].Costa GCA et al. , “Radioembolization Dosimetry with Total-Body 90 Y PET,” J. Nucl. Med, p. jnumed.121.263145, Nov. 2021, doi: 10.2967/jnumed.121.263145. [DOI] [PMC free article] [PubMed] [Google Scholar]
Associated Data
This section collects any data citations, data availability statements, or supplementary materials included in this article.


