

Abstract
Medical 3D printing of anatomical models is being increasingly applied in healthcare facilities. The accuracy of such 3D-printed anatomical models is an important aspect of their overall quality control. The purpose of this research was to test whether the accuracy of a variety of anatomical models 3D printed using Material Extrusion (MEX) lies within a reasonable tolerance level, defined as less than 1-mm dimensional error. Six medical models spanning across anatomical regions (musculoskeletal, neurological, abdominal, cardiovascular) and sizes (model volumes ranging from ~ 4 to 203 cc) were chosen for the primary study. Three measurement landing blocks were strategically designed within each of the six medical models to allow high-resolution caliper measurements. An 8-cc reference cube was printed as the 7th model in the primary study. In the secondary study, the effect of model rotation and scale was assessed using two of the models from the first study. All models were 3D printed using an Ultimaker 3 printer in triplicates. All absolute measurement errors were found to be less than 1 mm with a maximum error of 0.89 mm. The maximum relative error was 2.78%. The average absolute error was 0.26 mm, and the average relative error was 0.71% in the primary study, and the results were similar in the secondary study with an average absolute error of 0.30 mm and an average relative error of 0.60%. The relative errors demonstrated certain patterns in the data, which were explained based on the mechanics of MEX 3D printing. Results indicate that the MEX process, when carefully assessed on a case-by-case basis, could be suitable for the 3D printing of multi-pathological anatomical models for surgical planning if an accuracy level of 1 mm is deemed sufficient for the application.
Keywords: Medical 3D printing, Anatomical models, Surgical planning, Material extrusion, Accuracy, Ultimaker 3
Introduction
Medical 3D printing in healthcare facilities is increasing [1–4]. This has been also termed “Point of Care” 3D printing. Reproducible dimensional accuracy (or “accuracy”) is defined as the agreement between the measured and designed dimension of the 3D-printed part. It is important for the quality control of anatomic models. The most common anatomic models are 3D printed from segmented medical images such as CT and MRI, and accuracy is clinically important for the region of pathology printed, for example, the size of an aneurysm arising from a blood vessel or the volume of a tumor within otherwise normal soft tissues. The impact of imaging spatial resolution and contrast, segmentation, tessellation density, 3D printing, and post-processing of the part on anatomical model accuracy has been described [1, 5, 6]. The greatest error typically occurs at segmentation [2]. Error is also introduced at the 3D printing and post-processing stages, depending on the type of 3D-printing technology utilized. Dimensional accuracy of models is evaluated using calipers or coordinate measuring machines (CMMs), photographic measurements, surface scanning, photogrammetry, and computed tomography (CT) scans [7]. The majority of accuracy reports focus on a single pathology or similar pathological conditions involving a single anatomic region.
The dimensional accuracy of medical 3D-printed models has been recently evaluated by several research groups. In a study of the accuracy of an L4 vertebra model using MEX and vat photopolymerization (VP) 3D printing, the modified Hausdorff distance values along the surface mesh of the scanned models were found to be less than 1 mm for 99% of the dataset [8]. The accuracy of mandibles 3D printed using MEX and powder bed fusion (PBF) via 3D scanning showed agreement between the scanned and source STLs with less than 0.3 mm deviation in all instances [9]. In a separate study evaluating the dimensional accuracy of a mandibular model using MEX, PBF, VP, material jetting (MJT), and binder jetting (BJT) technologies, the highest mean agreement was found in the PBF-printed models (0.11 mm), followed by the BJT-printed models (0.14 mm), and finally the MEX-printed models (0.16 mm) [10]. The displacement of VP and MJT 3D-printed single-tooth implant casts was measured in a research study, and it was found that the values were lower in the MJT casts compared to conventional gypsum casts [11]. The effect of layer height and printing technology on the accuracy of orthodontic models was investigated, and both factors were found to influence accuracy [12]. The dimensional accuracy of complete-arch casts using MEX and VP technologies was evaluated, and the accuracy was discovered to not correlate with the cost of the 3D printers used [13]. The accuracy of dental models was studied using VP, and the accuracy of VP models was found to reduce with increasing layer height [14]. In a study measuring the accuracy of medical models 3D printed using MJT, PBF, and BJT, the accuracy of MJT was higher than the other two [15]. The dimensional accuracy for a collection of anatomic models 3D printed using inverted vat polymerization showed that the accuracy was superior to 1 mm [16].
The purpose of this research is to test whether MEX, a desktop 3D-printing technology commonly used in hospital-based laboratories, can be used to 3D print a diverse set of anatomical models with varying anatomy and pathology with less than 1 mm error. Three solid landing blocks were 3D printed with each model for enabling high-resolution caliper measurements. The effect of rotation and scaling on the accuracy was also assessed. The accuracy data were further analyzed to reveal patterns in the accuracy data that were subsequently explained based on the mechanics of the MEX process in a subset of these models.
Materials and Methods
Image Segmentation and Model Creation
The proposed research was considered exempt from review by the institutional human research committee. Imaging sets (CT and MRI scans) from multiple pathologies in different sizes (Table 1) and shapes (Figs. 1 and 2) were used [16]. Imaging data was acquired using standard CT protocols at the University of Cincinnati Medical Center, Cincinnati, OH, USA. CT was acquired helically using a 256 × 0.625-mm detector row CT (GE Revolution Medical Systems, Madison, USA). Automated dose modulation was used according to vendor recommendations, with kV of 100–120 and tube current adjusted by the hardware. Noncardiac images were reconstructed at 1.0–1.25 mm increments with 0–0.625 overlap. For the cardiac imaging, prospective ECG gating was used with a narrow phase window width focused at 75% of the R-R interval, and images were reconstructed at 0.625 mm increments. Between 60 and 100 cc of iodinated contrast was administered intravenously, and as needed imaging was timed using bolus tracking on the aorta. Images were evaluated by an attending radiologist to determine that there was sufficient contrast, low image noise (suitable for clinical interpretation), and there were no artifacts that would adversely impact 3D printing. The pathologies were as follows: basilar tip aneurysm (BTA), hepatic vein-inferior vena cava anastomoses (HVA), low-grade glioma (LGG), mandibular osteomyelitis (MO), renal cell carcinoma (RC), and left atrial appendage (LAA). The STL volumes varied from 8 to 203 cc, and the mesh density varied from 368 to 869,402 triangles. Three landing blocks were created on each of the 6 anatomic models. The three face pairs of the cube served as measurement blocks for that geometry. The landing blocks were created in orthogonal planes, and at least one of the landing blocks was created around the pathological feature/abnormality in each model. The cuboidal landing blocks all had a 5 mm × 5 mm square cross section with lengths varying depending on the model (Table 1).
Table 1.
The 6 anatomic models and a reference cube selected in this study with their corresponding model type, volume, mesh density, and landing block lengths
| Label | Model | Type | STL volume (cc) | STL mesh density (triangles) | Length of the 3 landing blocks (mm) |
|---|---|---|---|---|---|
| A | Cube (reference) | Solid | 8.01 | 368 | 20, 20, 20 |
| B | Basilar tip aneurysm (BTA) | Hollow | 4.33 | 12,450 | 50, 37, 17.5 |
| C | Hepatic vein-inferior vena cava anastomoses (HVA) | Hollow | 8.42 | 15,774 | 45, 20, 20 |
| D | Low-grade glioma (LGG) | Solid | 88.69 | 869,402 | 48, 95, 35 |
| E | Mandibular osteomyelitis (MO) | Solid | 47.44 | 224,388 | 48, 33, 106 |
| F | Renal cell carcinoma (RC) | Solid | 203.08 | 65,682 | 109, 49, 95 |
| G | Left atrial appendage (LAA) | Hollow | 35.57 | 94,752 | 32, 100, 105 |
Fig. 1.

The anatomical models in this study with the three pairs of measurement landing blocks highlighted on each model. The models were 3D printed in the orientation shown. Note: Models are not to scale. For scale, refer to Table 1 and Fig. 2
Fig. 2.

The models 3D printed in Ultimaker white PLA with the three pairs of measurement landing blocks highlighted on each model. Internal supports are highlighted on the LAA model using a blue arrow. A US nickel (19 mm diameter) is shown at the center for scale
Primary Study Design and 3D Printing of Models
All 7 (6 medical anatomical models and 1 reference cube) models were 3D printed using an Ultimaker 3 printer (Ultimaker B.V., Utrecht, The Netherlands) and Ultimaker PLA filament (Ultimaker B.V., Utrecht, The Netherlands) in triplicates (21 prints, 7 models × 3 replicates). The slicing software used was Ultimaker Cura (Ultimaker B.V., Utrecht, The Netherlands). The model orientation employed for 3D printing is as shown in Fig. 1. The nozzle diameter was set to 0.4 mm, layer height to 0.2 mm, and infill to 20% (triangles) as part of the “Fast” profile preset within the Cura software. The nozzle temperature was 200 °C, and the print bed temperature was 60 °C. The support overhang angle was set to 60°. A brim was generated for superior adhesion of models to the build plate. The print speed was 70 mm/s. After 3D printing, the models were carefully removed from the build plate; the support structures and brim were meticulously separated from the model.
Secondary Study Design and 3D Printing of Models
The secondary study was designed to assess the effect of model rotation and scaling on accuracy. In the first experiment, the MO model from the primary study was rotated 60° about the X-axis in the Ultimaker Cura software (Fig. 3) and printed three times, in separate print runs. In the second experiment, the MO model from the primary study was rotated 60° about the Y-axis in Ultimaker Cura software (Fig. 3) and printed three times in separate print runs. In the third experiment, the MO model from the primary study, in the same orientation as the primary study (Fig. 1E), was scaled down to 50% (Fig. 3) and printed three times in separate print runs. Finally, all three experiments were replicated using the RC model. The total number of models 3D printed in the secondary study was therefore 18 (2 models × 3 variations × 3 replicates). The print settings were identical to the primary study and the “Fast” profile preset within Ultimaker Cura software was used.
Fig. 3.
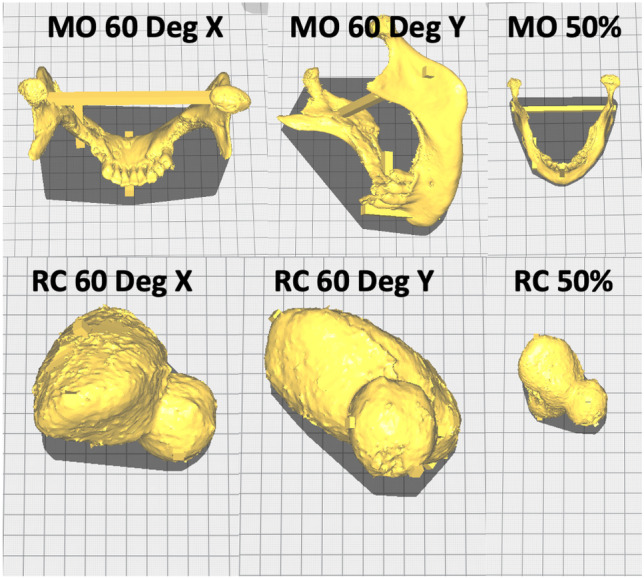
The anatomical models in the secondary study show the 60° rotation about the X- and Y-axis and the 50% scaling in the original orientation from the primary study for the MO and RC models. For the scale and volume of the models, please refer to Table 1 and Fig. 2
Accuracy Measurement, Data Analysis, and Statistical Comparison
The three measurement blocks on each of the replicates were measured using calipers (Mitutoyo America, Aurora, IL, USA). The absolute difference (without regard to the sign) was defined as the difference between the measured block length and designed block length. The relative difference was defined as the absolute difference divided by the designed length multiplied by 100. For the 50% scaled models in the secondary study, the length of the blocks used in the calculations was halved, corresponding to the scaled size of the model and the measurement blocks. The absolute and relative differences across the 3 landing blocks were averaged to find a single absolute difference and a single relative difference per replicate. These mean values were in turn averaged across the 3 replicates to yield a single absolute and relative difference value per model. Statistical comparisons were conducted using Tukey’s HSD test with p < 0.05 considered significant.
Results
Primary Study
All models were 3D printed without any obvious defects (Fig. 2). All of the measured absolute differences were less than 1 mm across all the measurement blocks and models. The maximum absolute difference across the measured landing blocks was 0.89 mm; the minimum was 0.00 mm. The maximum relative difference across the measured landing blocks was 2.78%, and the minimum was 0.00%. The average absolute difference across all the measured blocks was 0.26 mm (standard deviation of 0.14 mm). Only the RC model had an average absolute difference equal to 0.5 mm. All other models had values less than 0.5 mm. The BTA model had the lowest average absolute difference of 0.123 mm (standard deviation of 0.025 mm). Grouped by model, the absolute differences tended to be higher for the larger models (Table 2) and increased with landing block length (Fig. 4). The average absolute difference showed two distinct groups based on the measurement landing block length averaged by model type (Fig. 4). When the average landing block was less than 50 mm in length, the absolute differences were around 0.2 mm and showed a slightly reducing trend with increasing block length. When the average landing block length was larger than 50 mm in length, the absolute differences were around 0.3 mm and showed a clearly increasing trend with increasing block length. These two groups of average absolute difference values (less than and greater than 50 mm average block length) were significantly different. There was no significant difference in either the average absolute or relative difference between the solid and hollow models (Table 1).
Table 2.
Average absolute difference and standard deviation grouped by the model in the primary study
| Label | Model | Avg. abs. diff. (mm) | Std. dev. (mm) |
|---|---|---|---|
| A | Cube (reference) | 0.233 | 0.047 |
| B | Basilar tip aneurysm (BTA) | 0.123 | 0.025 |
| C | Hepatic vein-inferior vena cava anastomoses (HVA) | 0.197 | 0.031 |
| D | Low-grade glioma (LGG) | 0.137 | 0.080 |
| E | Mandibular osteomyelitis (MO) | 0.260 | 0.036 |
| F | Renal cell carcinoma (RC) | 0.500 | 0.035 |
| G | Left atrial appendage (LAA) | 0.377 | 0.040 |
Fig. 4.

Average absolute difference plotted against the average measurement landing block length in the primary study
The average relative difference across all the measured blocks was 0.71% (standard deviation of 0.33%). Only the cube model had an average relative difference larger than 1% (Fig. 5). The BTA and LGG models both had average relative differences of less than 0.5%. Out of the 21 unique pairs between the 7 models, only the average relative differences between 10 pairs were significantly different. The cube model was significantly different than the RC, MO, BTA, and LGG models. The HVA model was significantly different than the BTA and LGG models. The RC model was different than the BTA and LGG models. The BTA model was different than the LAA model, and the LGG model was different than the LAA model.
Fig. 5.

The relative differences of measured landing blocks averaged by model in the primary study. The corresponding standard error bars are shown
The average relative difference was the largest at 2.22% (standard deviation of 0.53%) across the triplicates of the LAA model for the landing block with one measuring surface completely above the support structures (Figs. 6 and 8). In comparison, the average relative difference across the triplicates of the LAA model for the remaining two landing blocks was 0.21% (standard deviation of 0.13%). These two groups within the LAA model were significantly different. Similarly, for the RC model, the average relative difference for the landing block with measuring surface directly above supports was 1.50% (standard deviation of 0.11%). In contrast, the average relative difference across the triplicates of the RC model for the remaining two landing blocks was 0.38% (standard deviation of 0.09%), and these two groups within the RC model were significantly different (Fig. 6). The average relative difference of the horizontal measurement blocks in the HVA model (Figs. 7 and 8) was 1.40% (standard deviation of 0.30%). In comparison, the average relative difference of the vertical measurement landing block directly atop the brim in the HVA model was 0.07% (standard deviation of 0.04%). Both these groups within the HVA model were significantly different. Similarly, the average relative difference of the horizontal measurement surface of the cube model (Figs. 7 and 9) was 1.43% (standard deviation of 0.53%), whereas the average relative difference of the vertical measurement surface with the bottom directly atop the brim was 0.62% (standard deviation of 0.25%). These two groups within the cube model were significantly different. This trend was also observed in the LGG model with an average relative difference of 0.36% (standard deviation of 0.22%) in the horizontal blocks and 0.06% (standard deviation of 0.04%) in the vertical blocks with the difference being significant.
Fig. 6.

Average relative difference of the vertical landing block with measurement surface directly above support structures for the LAA and RC models with standard errors in the primary study. Both pairs (LAA, vertical vs. LAA, other and RC, vertical vs. RC, other) were significantly different
Fig. 8.

The sliced print preview of the I LAA model (red) showing the measurement surface of one of the landing blocks (black circle) directly atop the support structures (cyan) and the II HVA model (red/yellow) showing the horizontal measurement blocks (black arrows) and the vertical measurement block (white arrow) in the primary study
Fig. 7.

Average relative difference of the horizontal landing blocks and vertical block directly on the bed for the HVA and cube models with standard errors in the primary study. Both pairs (HVA, horizontal vs. HVA, vertical and cube, horizontal vs. cube, vertical) were significantly different
Fig. 9.

The sliced preview of I the BTA model and II the cube model showing the outer perimeter (shell) start/stop points as white dots highlighted by the black oval on the cube model in the primary study. These points are relatively spread on the BTA model. The support structures and brim are seen in cyan color
Secondary Study
The models in the secondary study were printed without any visible defects. All the measured deviations were smaller than 1 mm (Table 3). The maximum absolute difference was 0.71 mm, and the minimum was 0.00 mm. The average of absolute differences across the 18 printed models in the secondary study was 0.30 mm (standard deviation of 0.16 mm), similar to the results in the primary study. The relative differences were all less than 3% (Fig. 10), with a maximum of 2.73% and a minimum of 0.00%. The average of the relative differences across the 18 printed models in the secondary study was 0.60% (standard deviation of 0.31%). Only the 50% scaled RC model had a relative error greater than 1%.
Table 3.
Average absolute difference and standard deviation grouped by models in the secondary study
| Model | Avg. abs. diff. (mm) | Std. dev. (mm) |
|---|---|---|
| MO, rotated 60° about X | 0.178 | 0.068 |
| MO, rotated 60° about Y | 0.297 | 0.040 |
| MO, scaled 50% | 0.099 | 0.056 |
| RC, rotated 60° about X | 0.557 | 0.019 |
| RC, rotated 60° about Y | 0.290 | 0.066 |
| RC, scaled 50% | 0.364 | 0.081 |
Fig. 10.

The relative differences of measured landing blocks averaged by model in the secondary study. The corresponding standard error bars are shown
Compared to the relative difference of the MO model in the primary study, none of the MO 60° X, MO 60° Y, or MO 50% models were significantly different. Similarly, compared to the relative difference of the RC model in the primary study, none of the RC 60° X, RC 60° Y, or RC 50% models were significantly different. However, in the 50% RC model, the vertical measurement block atop the supports was found to have a relative difference of 2.42% compared to the relative difference of 0.48% found in the other measurement blocks, and this difference was statistically different from what was observed in the primary study (Fig. 6). In the 50% MO model, the vertical measurement block atop the supports was found to have a relative difference of 0.72% compared to the relative difference of 0.22% in the other measurement blocks, and this was significantly different. The average relative difference of the RC 60° X model was significantly different than that of the RC 60° Y model.
Discussion
The mean absolute difference of 0.26–0.30 mm in the primary and secondary studies was less than 1 mm and comparable to that reported for inverted vat polymerization (0.25 mm) [16]. This supports MEX technology for desktop 3D printing of anatomic models as commonly practiced in hospitals and medical centers if the accuracy cutoff of 1 mm is satisfactory for the intended application. Individual 3D prints of anatomic models should be carefully assessed, with tolerance levels determined by the clinical application on a case-by-case basis. There are some comparable reports of accuracy in the literature. Ten replicates of a single mandibular model using an Ultimaker 3 Extended printer resulted in a mean accuracy of 0.16 mm [10]. A median deviation of 0.163 mm was reported for full-arch maxillary casts 3D printed using an Ultimaker 2 + printer [13]. Using the Ultimaker 3, 3D anatomic models of the pelvis, foot, and hand demonstrated a relative difference range of 0.3 to 2.5% [17], and there was a 2.5% relative difference in the wall diameter of abdominal aortic aneurysm models [18]. The current study spans a wider variety of model geometries and sizes, plus it includes meticulous caliper measurements for anatomic model accuracy studies. Other accuracy measurement techniques have inferior spatial resolution when compared to digital calipers (10–20 µm) such as surface scanning 50–100 µm and CT ~ 500 µm [16]. The disadvantage of caliper measurements with respect to these other technologies is that measurements are only available at the landing points. However, these were chosen at the point of pathology, and errors in the other anatomy have no, at most very limited, clinical relevance.
The average absolute difference increased with block length since error generally tends to grow with model/feature size. Although there were two distinct groups, less than and greater than 50 mm block length, the average absolute difference was similar when the block length was less than 50 mm. The cube model had the largest relative difference of all the geometries despite the lowest average block length (Table 2), which may be due to the larger accumulation of material along the seams due to the aligned start/stop points of the nozzle compared to other geometries (Fig. 9). Distributing these start/stop points across the model could be a potential solution to reduce this error. The LGG model had the lowest relative difference (highest accuracy) likely because of a combination of solid geometry with relatively low block lengths (Table 2 and Fig. 5). Overall, the data had good reproducibility, and this was evident in the 10 pairs of statistical differences between the model average relative differences.
The landing blocks with measuring surfaces directly above the supports had poor print quality and were less accurate. This occurred because there was a 2-layer gap between the support structure and model to reduce adhesion and enable easier separation. Furthermore, the support structures had low infill (20%), similar to the model, to reduce material consumption. This further exacerbated distortion of model regions directly above the support structures due to the reduced scaffolding effect compared to a fully solid support structure. These effects explain the larger relative difference (lower accuracy) seen in the landing blocks with measurement surfaces directly atop the support structures (LAA and RC models) as well as horizontal landing blocks with a substantial overhanging portion atop the support structures (HVA model). The landing blocks, which were vertical with the bottom surface directly atop the brim, had the lowest relative difference (highest accuracy) as seen in the HVA, LGG, and cube models. The use of dissolvable supports, such as is available in other commercial industry-grade 3D printers, would likely reduce this error since the contact between the model and support structures is good without the need for substantial gaps to be present. Thermal distortion in MEX results in the warping of printed models due to the buildup of residual stresses from the temperature cycling during the printing process [19]. Neither rotation nor scaling had an appreciable effect on the observed relative differences.
We acknowledge the study design limitation that we did not evaluate models across different patients (e.g., with the same pathology) to assess the effect of individual anatomical differences on accuracy. Furthermore, it was challenging to separate the contributions of anatomy and the printing process to the measured inaccuracies. Our study focuses on 3D printing the physical part. We acknowledge that other components of the workflow [1, 3] including image acquisition, segmentation, and the final post-processing of the physical model can impact overall quality. However, the practical implication of our work is that MEX 3D printing using the Ultimaker 3 printer yields inaccuracies less than 1 mm for generating the physical model. This is one clinical benchmark that can be used for anatomic modeling in healthcare facilities, but it is not the only one. It remains important to consider 3D printing accuracy requirements based on the clinical scenario, and the intended use on a case-by-case basis.
Conclusions
Desktop, hospital-based MEX 3D printing of anatomic models provides dimensional accuracy superior to 1 mm for different pathologies used clinically. The average relative error was uniformly errored less than 1% across the six medical models. The interface between the support material and model and the location of nozzle start/stop points, particularly when aligned, were prone to larger errors although still less than 1 mm. The effect of rotation and scaling on the accuracy was found to not be significant. Results indicate that MEX is a viable technology for manufacturing accurate multi-pathological presurgical anatomical models using a 1 mm cutoff. Care should be taken to benchmark clinically meaningful accuracy metrics on a case-by-case basis.
Author Contribution
FJR and LC conceived the study. PR segmented the models, measured the accuracy, analyzed data, and drafted the paper. FJR and LC critically revised the paper. GVS and BSJ 3D printed the models and provided input regarding the 3D-printing process. All authors provided textual contributions to the manuscript draft. All others contributed to revising the manuscript and approved the final version.
Availability of Data and Materials
The raw dataset can be shared upon reasonable request for noncommercial purposes.
Code Availability
Not applicable.
Declarations
Ethics Approval
Not applicable.
Consent to Participate
Not applicable.
Consent for Publication
Not applicable.
Conflict of Interest
The authors declare no competing interests.
Footnotes
Publisher's Note
Springer Nature remains neutral with regard to jurisdictional claims in published maps and institutional affiliations.
References
- 1.Mitsouras D, Liacouras P, Imanzadeh A, Giannopoulos AA, Cai T, Kumamaru KK, George E, Wake N, Caterson EJ, Pomahac B, Ho VB, Grant GT, Rybicki FJ. Medical 3D printing for the radiologist. Radiographics. 2015;35:1965–1988. doi: 10.1148/rg.2015140320. [DOI] [PMC free article] [PubMed] [Google Scholar]
- 2.George E, Liacouras P, Rybicki FJ, Mitsouras D. Measuring and establishing the accuracy and reproducibility of 3D printed medical models. Radiographics. 2017;37:1424–1450. doi: 10.1148/rg.2017160165. [DOI] [PMC free article] [PubMed] [Google Scholar]
- 3.L. Chepelev, N. Wake, J. Ryan, W. Althobaity, A. Gupta, E. Arribas, L. Santiago, D.H. Ballard, K.C. Wang, W. Weadock, C.N. Ionita, D. Mitsouras, J. Morris, J. Matsumoto, A. Christensen, P. Liacouras, F.J. Rybicki, A. Sheikh, Radiological Society of North America (RSNA) 3D printing Special Interest Group (SIG): guidelines for medical 3D printing and appropriateness for clinical scenarios, 3D Print. Med. 4 (2018). 10.1186/s41205-018-0030-y. [DOI] [PMC free article] [PubMed]
- 4.Rybicki FJ, Grant GT. 3D printing in medicine: a practical guide for medical professionals. Springer. 2017 doi: 10.1007/978-3-319-61924-8_1. [DOI] [Google Scholar]
- 5.S. Leng, K. McGee, J. Morris, A. Alexander, J. Kuhlmann, T. Vrieze, C.H. McCollough, J. Matsumoto, Anatomic modeling using 3D printing: quality assurance and optimization, 3D Print. Med. 3 (2017). 10.1186/s41205-017-0014-3. [DOI] [PMC free article] [PubMed]
- 6.Searle B, Starkey D. An investigation into the effect of changing the computed tomography slice reconstruction interval on the spatial replication accuracy of three-dimensional printed anatomical models constructed by fused deposition modelling. J. Med. Radiat. Sci. 2020;67:43–53. doi: 10.1002/jmrs.382. [DOI] [PMC free article] [PubMed] [Google Scholar]
- 7.M. Odeh, D. Levin, J. Inziello, F. Lobo Fenoglietto, M. Mathur, J. Hermsen, J. Stubbs, B. Ripley, Methods for verification of 3D printed anatomic model accuracy using cardiac models as an example, 3D Print. Med. 5 (2019) 1–12. 10.1186/s41205-019-0043-1. [DOI] [PMC free article] [PubMed]
- 8.Eltes PE, Kiss L, Bartos M, Gyorgy ZM, Csakany T, Bereczki F, Lesko V, Puhl M, Varga PP, Lazary A. Geometrical accuracy evaluation of an affordable 3D printing technology for spine physical models. J. Clin. Neurosci. 2020;72:438–446. doi: 10.1016/j.jocn.2019.12.027. [DOI] [PubMed] [Google Scholar]
- 9.Hatz CR, Msallem B, Aghlmandi S, Brantner P, Thieringer FM. Can an entry-level 3D printer create high-quality anatomical models? Accuracy assessment of mandibular models printed by a desktop 3D printer and a professional device. Int. J. Oral Maxillofac. Surg. 2020;49:143–148. doi: 10.1016/j.ijom.2019.03.962. [DOI] [PubMed] [Google Scholar]
- 10.Msallem B, Sharma N, Cao S, Halbeisen FS, Zeilhofer H-F, Thieringer FM. Evaluation of the dimensional accuracy of 3D-printed anatomical mandibular models using FFF, SLA, SLS, MJ, and BJ printing technology. J. Clin. Med. 2020;9:817. doi: 10.3390/jcm9030817. [DOI] [PMC free article] [PubMed] [Google Scholar]
- 11.Buda M, Bratos M, Sorensen JA. Accuracy of 3-dimensional computer-aided manufactured single-tooth implant definitive casts. J. Prosthet. Dent. 2018;120:913–918. doi: 10.1016/j.prosdent.2018.02.011. [DOI] [PubMed] [Google Scholar]
- 12.Favero CS, English JD, Cozad BE, Wirthlin JO, Short MM, Kasper FK. Effect of print layer height and printer type on the accuracy of 3-dimensional printed orthodontic models. Am. J. Orthod. Dentofac. Orthop. 2017;152:557–565. doi: 10.1016/j.ajodo.2017.06.012. [DOI] [PubMed] [Google Scholar]
- 13.N. Nestler, C. Wesemann, B.C. Spies, F. Beuer, A. Bumann, Dimensional accuracy of extrusion- and photopolymerization-based 3D printers: in vitro study comparing printed casts, J. Prosthet. Dent. (2020) 1–8. 10.1016/j.prosdent.2019.11.011. [DOI] [PubMed]
- 14.Z. chen Zhang, P. lun Li, F. ting Chu, G. Shen, Influence of the three-dimensional printing technique and printing layer thickness on model accuracy, J. Orofac. Orthop. 80 (2019) 194–204. 10.1007/s00056-019-00180-y. [DOI] [PubMed]
- 15.Salmi M, Paloheimo KS, Tuomi J, Wolff J, Mäkitie A. Accuracy of medical models made by additive manufacturing (rapid manufacturing) J. Cranio-Maxillofacial Surg. 2013;41:603–609. doi: 10.1016/j.jcms.2012.11.041. [DOI] [PubMed] [Google Scholar]
- 16.Ravi P, Chepelev L, Lawera N. A systematic evaluation of medical 3D printing accuracy of multi-pathological anatomical models for surgical planning manufactured in elastic and rigid material using desktop inverted vat photopolymerization. Med. Phys. 2021;48:3223–3233. doi: 10.1002/mp.14850. [DOI] [PubMed] [Google Scholar]
- 17.L. Brouwers, A. Teutelink, FAJB. van Tilborg, MAC. de Jongh, KWW. Lansink, M. Bemelman, Validation study of 3D-printed anatomical models using 2 PLA printers for preoperative planning in trauma surgery, a human cadaver study. Eur J. Trauma Emerg. Surg. 45 (2019) 1013–1020. 10.1007/s00068-018-0970-3. [DOI] [PMC free article] [PubMed]
- 18.M. Chung, N. Radacsi, C. Robert, E.D. McCarthy, A. Callanan, N. Conlisk, P.R. Hoskins, V. Koutsos, On the optimization of low-cost FDM 3D printers for accurate replication of patient-specific abdominal aortic aneurysm geometry, 3D Print. Med. 4 (2018) 0–9. 10.1186/s41205-017-0023-2. [DOI] [PMC free article] [PubMed]
- 19.B.N. Turner, S.A. Gold, A review of melt extrusion additive manufacturing processes: II. Materials, dimensional accuracy, and surface roughness, Rapid Prototyp. J. 21 (2015) 250–261. 10.1108/RPJ-02-2013-0017.
Associated Data
This section collects any data citations, data availability statements, or supplementary materials included in this article.
Data Availability Statement
The raw dataset can be shared upon reasonable request for noncommercial purposes.
Not applicable.