

Abstract
The genomic imbalance caused by varying the dosage of individual chromosomes or chromosomal segments (aneuploidy) has more detrimental effects than altering the dosage of complete chromosome sets (ploidy). Previous analysis of maize (Zea mays) aneuploids revealed global modulation of gene expression both on the varied chromosome (cis) and the remainder of the genome (trans). However, little is known regarding the role of microRNAs (miRNAs) under genomic imbalance. Here, we report the impact of aneuploidy and polyploidy on the expression of miRNAs. In general, cis miRNAs in aneuploids present a predominant gene-dosage effect, whereas trans miRNAs trend toward the inverse level, although other types of responses including dosage compensation, increased effect, and decreased effect also occur. By contrast, polyploids show less differential miRNA expression than aneuploids. Significant correlations between expression levels of miRNAs and their targets are identified in aneuploids, indicating the regulatory role of miRNAs on gene expression triggered by genomic imbalance.
Subject terms: Gene expression, Plant genetics, Agricultural genetics
The role of miRNAs in genome imbalance is unclear. Here, the authors show that cis miRNAs in aneuploids present a predominant gene-dosage effect, whereas trans miRNAs trend toward the inverse level by examining global miRNA modulation in haploid and diploid aneuploids with the varied dosage of multiple chromosomal segments in maize.
Introduction
The concept of genome imbalance has been known for nearly a century in that changing the dosage of individual chromosomes or chromosomal segments (aneuploidy) has more phenotypic defects than changing the dosage of the whole set of chromosomes (ploidy)1–5. This phenomenon was presumed to be caused by a dosage effect related to varied gene copy numbers6–11. Early studies illustrated that altering the dosage of a gene would result in varied expression of the gene product in different ways. For example, the amount of gene product could be a directly proportional reflection of the varied gene dosage, a phenomenon referred to as a gene-dosage effect6,7,12. In addition, dosage compensation refers to the scenario that the amount of gene product in aneuploids could be equivalent to that in the control despite changes in gene dosage8–10. Furthermore, an inverse correlation between the chromosomal dosage and the amount of gene product located elsewhere in the genome was observed while examining the modulation of gene expression from the unvaried portion of the genome, known as the inverse dosage effect. In other cases, positive correlations were also found but to a lesser degree8,10,11,13.
The molecular functions of the genes that are responsible for these dosage effects were identified, including transcription factors (TFs), components of signal transduction, and chromatin proteins, which are typically members of macromolecular complexes and multicomponent DNA-binding complexes11,14–21. A gene balance hypothesis (GBH) was proposed based on these findings. It states that changing the stoichiometry of members of multisubunit complexes will affect their mode of assembly, kinetics, and function of the whole, thus resulting in negative fitness consequences22–25. If these multisubunit complexes are composed of TFs or components of signal transduction cascades that affect targets (e.g., other TFs), varying a portion of the genome would be predicted to influence the global gene expression14. Indeed, such effects have been found in large-scale biology studies in many organisms such as Drosophila, Arabidopsis, human, and maize (Zea mays), and in reanalysis of yeast and mouse data26–36. A greater spread of modulation was observed in the aneuploids than in the ploidy series in studies of global gene expression modulations using mRNA-sequencing (mRNA-seq) in Arabidopsis and maize30,32,34,35, which matches the phenotypic observation of aneuploids versus the whole-genome ploidy series2. These findings further support the GBH that when there is a partial rather than a whole-genomic variation, the stoichiometry of certain subunits relative to the others would be altered, which consequently affects the function of the whole complex. Further, in both Arabidopsis and maize, gene expression on the varied chromosome ranged from dosage compensation to a gene-dosage effect, whereas that from the remainder of the genome ranged from no effect to an inverse effect with positive modulations found to a lesser degree30,32,34,35. Recent studies of a dosage series of the human sex chromosomes demonstrate global gene modulations of a subset of genes, which were predominantly inverse effects31,33. Analyses on global gene expression of autosomal and sex chromosome trisomy in Drosophila show that most genes on the varied chromosome present dosage compensation, while the remainder of the genome exhibits widespread inverse dosage effects28,29,36.
The GBH is further supported by evolutionary genomic studies. Components of macromolecular interactions including TFs and signal transduction genes are preferentially retained as duplicates for a longer period of evolutionary time after whole-genome duplication (WGD)21,37–46. The loss of a member of a duplicated pair can be expected to have profound deleterious effects on the fitness of plants and thus would be selected against22,42. Interestingly, over 1/3 of ancestral microRNA (miRNA) positions were retained at both homoeologous sites following WGD in grass species including rice, sorghum, maize, and Brachypodium47,48. The proportion of retained miRNA sites was greater than that for protein-coding genes in maize, or close to that for TFs in rice47,48. Grass miRNAs were found to preferentially target genes involved in regulatory and metabolic pathways47,48. Further, most retained miRNA families were associated with retained target genes in all four grass species48. Considering that most retained genes are TFs and signal transduction genes21,37–46, this phenomenon suggests that miRNAs are involved with complex regulatory networks. Thus, mutations in miRNAs were postulated to have a detrimental effect on plant growth and development, consistent with the observation of biased retention of regulatory genes. Therefore, miRNAs in grass species are important regulators in transcription/translation that are dosage-sensitive and possibly function similarly to TFs under genomic imbalance.
miRNAs are a class of 20- to 24-nt endogenous small non-coding RNAs that control gene expression through translational inhibition and mRNA target cleavage49. Primary miRNA (pri-miRNA) transcripts are transcribed by RNA polymerase II from the MIR gene, subsequently excised from stem-loop structures by Dicer-like 1 (DCL1), 2’-O-methylated by Hua-Enhancer 1 (HEN1) to produce mature miRNA, exported to the cytoplasm by the Hasty (HST) protein, and then loaded into the Argonaute (AGO) component of an RNA-induced silencing complex (RISC)49. Recent studies demonstrated that miRNAs can be exported to the cytoplasm after assembly into RISC by CRM1/EXPORTIN1 (EXPO1), while HST also regulates pri-miRNA transcription and processing50,51. miRNAs play critical regulatory roles in various biological processes in plants, including growth, development, cell fate, and stress responses52–56. A great deal of interest has been placed on the dosage effect of miRNAs in mammals due to their importance in human diseases. Changes in global miRNA abundance were found in multiple human cancers57,58. Subtle alteration of miRNA dosage had profound consequences for the development and maintenance of the heart in mice59. A recent study reported that dysregulation of global miRNA dosage control affected lipid metabolic pathways and interfered with embryonic development by disrupting germ layer specification in mammalian cells60. In a study of vertebrates, miRNA genes were retained from the WGDs but not from tandem events illustrating stoichiometric constraints61. These results imply the importance of precise dosage control of mammalian miRNAs.
Despite all the advances in the study of the dosage effect of miRNAs in mammals, little is known about the impact of dysregulated miRNA dosage in plants. miRNA pathways in plants and animals might have undergone parallel evolution and are different in miRNA biogenesis and mode of action62–64. Therefore, it is possible that the dosage effect of plant miRNAs is different. It is also unclear how the variation of the partial genome or whole-genome doses affects miRNA expression on a global scale and on a per miRNA basis. To address these questions, small RNA sequencing (sRNA-seq) is performed on the maize mature leaf tissue in this work of a collection of 20 maize B–A translocation lines created by translocations between the normal chromosomes and the B chromosome65–68 containing various copies of chromosomal segments covering 82.1% of the maize W22 genome, in concert with a whole-genome ploidy series of haploid, diploid, triploid, and tetraploid lines. Further, interactions between miRNAs and their predicted gene targets are examined because small RNAs (sRNAs) in this study are co-extracted with mRNAs in the recent comprehensive studies of global gene modulation in maize aneuploids and polyploids34,35. The results provide insight into the impact of genomic imbalance on miRNA expression and the role of miRNAs in the unbalanced regulatory network.
Results
Aneuploidy causes changes in miRNA expression both in cis and in trans
A collection of 20 maize B–A translocation lines containing various copies of chromosomal segments was screened and verified by fluorescence in situ hybridization (FISH) as described in previous studies34,35. We analyzed 15 diploid aneuploids with 1–3 copies for 1S (the short arm of chromosome 1), 1L (long arm of chromosome 1), 3S, 3L, 4S, 4L, 5L, 6L, 7L, 8L, 9S, and 9L, 2–4 copies for 6S and 1–4 copies for 5S and 10L (10L18), and 17 haploid aneuploids with 1-2 copies for 1S, 1L, 2S, 2S_deletion (which contains a deleted part compared to 2S), 3S, 3L, 4S, 4L, 5S, 5L, 6L, 7S, 7L, 8L, 9S, 9L, and 10L (10L19). The breakpoint of TB-10L18 is very close to that of TB-10L19, which are only 0.5 Mb apart34,35. These lines are called distal aneuploids as their segmental aneuploidy does not include the respective centromeres. In addition, trisomies and tetrasomies with breakpoints spanning the centromere of chromosome 4, named Proximal Duplication 4 (Dp4)69 as interstitial segmental aneuploids, produced by overlapping reciprocal B–A translocations, were examined. Further, a collection of polyploids including haploids, triploids, tetraploids, and their corresponding diploid controls were also assayed. The grouping information and read mapping statistics of these plants are listed in Supplementary Data 1. Monosomies, trisomies, tetrasomies, and their corresponding diploid controls in each aneuploid were referred to as 1D, 3D, 4D, and 2D, respectively, whereas disomies and their haploid controls were named h2D and h1D. In addition, haploids, triploids, and tetraploids and their diploid controls in the ploidy series were named 1X, 3X, 4X, and 2X.
45-day-leaf tissue of the above-mentioned materials was used to examine the effect of aneuploidy and polyploidy on miRNA expression through sRNA-seq. In addition, analysis of W22 diploid plants with one B chromosome (1B) relative to plants without any B chromosome (0B) was used as a control to rule out the effect of the B chromosome on miRNA expression, as some aneuploids contain part or the equivalent of a whole B chromosome or more, whereas their diploid or haploid controls do not have any B chromosome. Reads of all samples were treated and mapped to the W22 reference genome by ShortStack as described in “Methods”70–73. Reads per million mapped reads (RPM) normalization was performed and differential gene expression analysis was conducted by Empirical Analysis of Digital Gene Expression Data in R (edgeR)74,75. The similarity of miRNA expression levels among biological replicates was determined by principal components analysis (PCA) using normalized read counts (Supplementary Figs. 1 and 2). For all genotypes, values of principal components (PC1 and PC2) for each replicate were within two standard deviations (SDs) from the mean, indicating none of the samples should be considered an outlier. The Pearson correlation coefficient (PCC) between normalized expression levels of each pair of biological replicates was calculated, and the results showed that expression levels of all pairs are significantly correlated (P value < 0.05). However, the read length distribution of three sRNA libraries after structural RNAs had been removed did not show distinct peaks at 21 and 24 nt, indicating the lower quality of data (Supplementary Fig. 3). Thus, these samples (4Dp22C5, 1La20, and 1La40) were excluded from further study. Lowly expressed miRNAs with a mean of normalized counts less than 0.5 in experimental and control groups are excluded from further study.
miRNAs for each aneuploid were partitioned into ones that are present on the varied chromosome (cis) versus ones that locate in the remainder of the genome (trans) according to their locations relative to breakpoints in each B–A translocation line documented in previous studies34,35. miRNAs that fall in the cis regions of each B–A translocation line are listed, with each line containing 1–7 cis miRNAs (Supplementary Data 2). The number of cis miRNAs is positively correlated with the size of the corresponding cis region (Pearson correlation: P value = 0.011, R = 0.55) (Supplementary Data 3).
Normalized counts of biological replicates were averaged and ratios of individual miRNAs of each experimental condition to the control were computed (Supplementary Data 4). The medians of trans ratios of distal aneuploids including monosomies, trisomies, and disomies relative to their corresponding controls were plotted to illustrate the overall trend of trans miRNA modulation (Fig. 1a). The medians of ratios distribute over or under a ratio of 1.0, indicating trends of both up-and downregulation exist for trans miRNAs triggered by aneuploidy of different chromosomal regions. Further, the finding that the medians of trans ratios of miRNAs cluster toward ratios presenting an inverse effect (2.0 for 1D/2D, 0.67 for 3D/2D, and 0.5 for h2D/h1D) suggests that the predominant effect in trans miRNAs is an inverse modulation.
Fig. 1. Relationship between expression of trans genes and trans MIRNAs in each distal aneuploidy comparison.
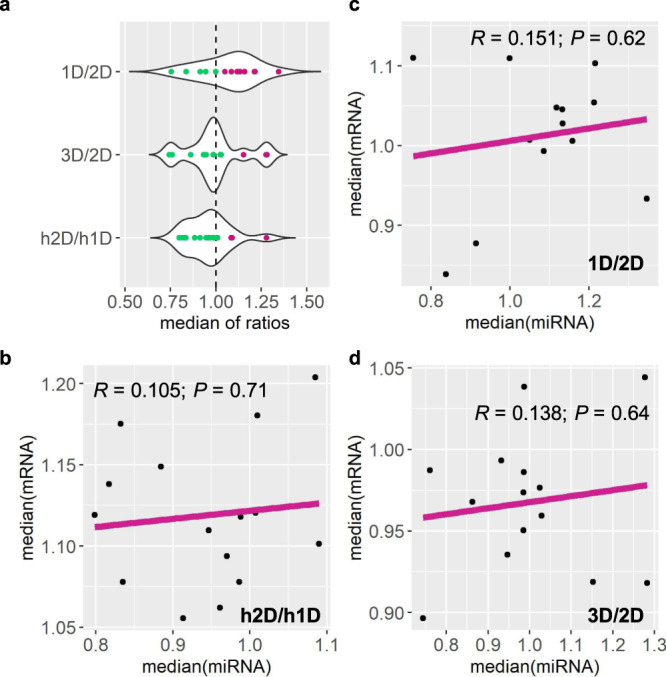
Each data point represents one comparison out of all distal aneuploids assayed. Medians of trans miRNA ratios were computed as in Supplementary Data 5. a Medians of trans miRNA ratios. The x-axis refers to the median of trans miRNA ratios, while the y-axis represents the chromosomal dosage in each comparison. Data points that belong to two clusters produced by the k-means clustering algorithm were painted in different colors. b–d Medians of ratios of trans miRNAs and trans genes in each comparison were plotted on the x- and y-axes, respectively. Medians of trans gene ratios were computed in previous studies34,35. R Pearson correlation coefficient; P P value for Pearson correlation (two-sided; confidence intervals, 95%; no adjustment made for multiple comparisons). Data points with x- and y-axis values exceeding two SDs from the mean are considered outliers, and thus are excluded from the analysis. Source data are provided as a Source Data file.
Scatter plots were used to illustrate the fold change and significance of differential miRNA expression (DME)30,34,35,76. Results of the DME analysis of distal aneuploids show differential expression of miRNAs both on the cis and trans chromosomes compared with their diploid or haploid controls (Figs. 2–5 and Supplementary Data 4). Numbers of differentially expressed cis and trans miRNAs for each comparison (FDR < 0.05) were shown in Fig. 6a and Supplementary Data 3, with the disomies (h2D/h1D) and monosomies (1D/2D) bearing a greater number of differentially expressed miRNAs (DEMs) compared to aneuploids in other comparisons. There is a significant positive correlation between the number of trans DEMs in each B–A translocation line and the corresponding size of the cis region for disomies relative to haploid controls (h2D/h1D) (Pearson correlation, R = 0.528; P value = 0.029), whereas no correlation is observed for comparisons involving diploid aneuploids (Supplementary Fig. 4). Overall, more cis DEMs are upregulated in trisomies and tetrasomies relative to diploids, and disomies relative to haploids, whereas more cis DEMs are downregulated in monosomies relative to diploids (Supplementary Data 3). The result indicates most cis DEMs show a direct dosage effect under the condition of distal aneuploidy.
Fig. 2. Scatter plots of trans MIRNA expression in each monosomy compared with diploids (1D/2D).

The x-axis represents the log fold change with base 2 of each experimental genotype to the control, whereas the y-axis notes the log2 value of the mean of normalized counts of each experimental genotype and the control. Data points with an FDR < 0.05 and a corresponding logFC > 0 were depicted in magenta, while points with an FDR < 0.05 and a corresponding logFC < 0 were depicted in green. Otherwise, they were painted in black. A fold change (FC) of 1.0 (logFC of 0) represents no change. An FC of 2.0 represents the inverse ratio of MIRNA expression in trans, whereas 0.5 represents a positive modulation. These FC values are demarcated with labeled vertical lines in red (0.5), black (0), and purple (2.0). Source data are provided in Supplementary Data 4.
Fig. 5. Scatter plots of trans MIRNA expression in each disomy compared with haploids (h2D/h1D).

Analysis was conducted as described in Fig. 2. An FC of 0.5 represents the inverse ratio of MIRNA expression in trans, whereas 2.0 represents a positive modulation. These FC values are demarcated with labeled vertical lines in red (0.5), black (0), and purple (2.0). Source data are provided in Supplementary Data 4.
Fig. 6. The number of DEMs in each comparison.
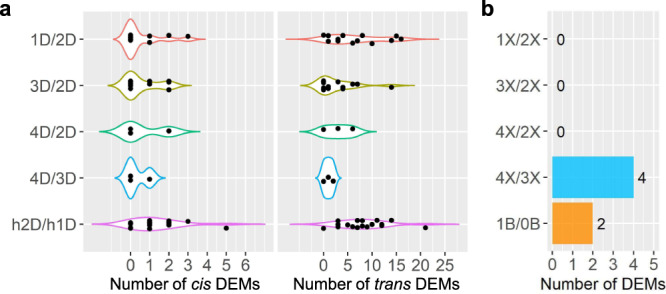
DEMs were computed by significance (FDR or adjusted P value < 0.05), as in each scatter plot in Figs. 2–5, 7. a Number of cis (left panel) and trans (right panel) DEMs in each distal aneuploid compared with the control. Each data point represents the number of DEMs (x-axis) in each comparison (y-axis) as shown in Supplementary Data 3. b Number of DEMs in the ploidy series and B chromosome series compared with the control. Source data are provided in Supplementary Data 3.
Monosomies, trisomies, tetrasomies, and disomies act differently in trans to some degree in response to changed chromosomal dosage. Scatter plots of DME in comparing monosomies to diploids (1D/2D) show a greater fraction of upregulated trans DEMs in most comparisons including 1L, 3S, 3L, 5S, 6L, 7L, 8L, 9L, and 10L, whereas more downregulated trans DEMs are observed in 1S, 4L and 5L monosomies (Fig. 2 and Supplementary Data 3). Those in the trisomy/diploid (3D/2D) and tetrasomy/diploid (4D/2D) comparisons display a lesser degree of differential expression, with more downregulated trans DEMs for 3S, 5L, and 8L trisomies, and 5S and 10L tetrasomies, whereas there is a greater number of upregulated trans DEMs in 1L, 6L, and 10L trisomies (Figs. 3, 4; Supplementary Data 3). The finding of a greater number of trans DEMs being modulated towards the direction of an inverse effect for diploid aneuploids further supports the conclusion regarding the predominant inverse effect on trans miRNAs. However, DME analysis of disomies exhibits a different trend of trans miRNA modulation compared to those of diploid aneuploids. By comparing disomies and haploid controls, 1S, 2S, 3S, 3L, 4L, 5L, 6L, 7S, 7L, and 10L disomies have more upregulated trans DEMs, while 1L, 2S_deletion, 4S, 9S, and 9L disomies contain more downregulated trans DEMs (Fig. 5 and Supplementary Data 3). By contrast, medians of trans ratios for a greater proportion of disomies relative to the haploid control are distributed below the ratio of 1.0 (Fig. 1a and Supplementary Data 5). Medians of trans ratios of these disomies are clustered toward the inverse level as determined by the k-means clustering algorithm (k = 2). In addition, medians of trans ratios of many disomies with a greater fraction of upregulated trans DEMs are below 1.0 (Supplementary Data 3 and 5). Thus, although slightly more trans DEMs are upregulated than being downregulated in disomies relative to haploids, it is still likely that the predominant effect of trans miRNA modulation is an inverse effect when analyzed collectively.
Fig. 3. Scatter plots of trans MIRNA expression in each trisomy compared with diploids (3D/2D).

Analysis was conducted as described in Fig. 2. An FC of 0.67 represents the inverse ratio of MIRNA expression in trans, whereas 1.5 represents a positive modulation. These FC values are demarcated with labeled vertical lines in pink (0.67), black (0), and green (1.5). Source data are provided in Supplementary Data 4.
Fig. 4. Scatter plots of trans MIRNA expression in each tetrasomy compared with diploids (4D/2D) or trisomies (4D/3D).
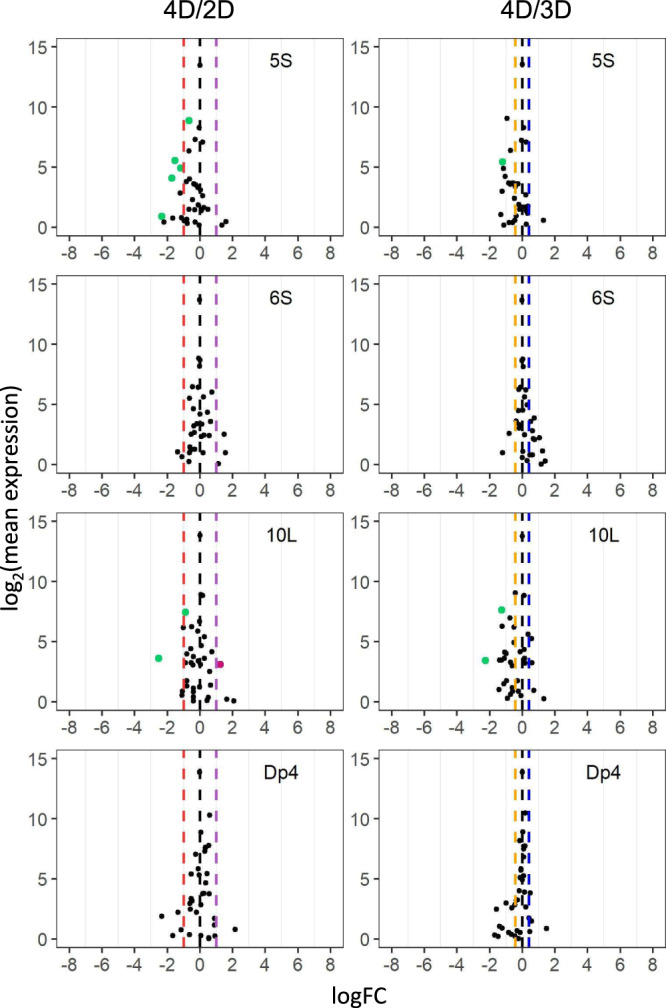
Analysis was conducted as described in Fig. 2. FCs of 0.5 (4D/2D) and 0.75 (4D/3D) represent the inverse ratio of MIRNA expression in trans, whereas 2.0 (4D/2D) and 1.33 (4D/3D) represent a positive modulation. These FC values are demarcated with labeled vertical lines in red (0.5), orange (0.75), black (0), blue (1.33), and purple (2.0). Source data are provided in Supplementary Data 4.
There are progressive cis and trans effects on gene expression in aneuploids, with greater chromosomal dosage producing greater effects as reported in previous studies34,35. To examine if such effects are also present for the expression of miRNAs, scatter plots of DME in comparing tetrasomies to trisomies were generated. Although the expression of many miRNAs in the 4D/3D comparison remains unchanged, a few cis and trans DEMs were identified (Fig. 6a and Supplementary Data 3), indicating the existence of progressive cis and trans effects on a subset of miRNAs with ascending chromosomal dosage.
Although the predominant effect on global mRNA and miRNA expression in trans is an inverse modulation, the medians of trans miRNA ratios in this study do not show much correlation with the medians of trans mRNA ratios from the corresponding comparisons in previous studies34,35, as the Pearson correlation between medians of trans ratios of miRNAs and protein-coding genes is not statistically significant as shown in Fig. 1 (P value > 0.05). Results from differential mRNA/miRNA expression analysis present a greater proportion of trans differentially expressed protein-coding genes (DEGs)/DEMs out of expressed trans mRNAs/miRNAs in most conditions (Supplementary Table 1). Thus, the extents of modulation in trans miRNAs are different from those of trans mRNAs under the influence of varied chromosomal dosages.
Apart from the distal aneuploids analyzed above, an interstitial aneuploid line, Dp4, was assayed in terms of different chromosomal dosages. Only 1 DEM was found in comparing trisomies and tetrasomies to their diploid controls (Figs. 3 and 4), indicating varied chromosomal dosage of Dp4 has little impact on cis and trans miRNA expression. In addition, only 2 DEMs (Cluster_181033 and Cluster_229850) were identified when comparing plants with 1B to those with 0B, implying that the B chromosome is not the major contributor to most miRNA modulation in aneuploids assayed in this study (Figs. 6b and 7b). These 2 miRNAs were excluded from further analysis considering it is difficult to determine whether the impact of aneuploidy on these miRNAs results from aneuploidy of the essential A chromosomal segments or the nonessential B chromosomal segments.
Fig. 7. Scatter plots of MIRNA expression in each ploidy series and B chromosome series.
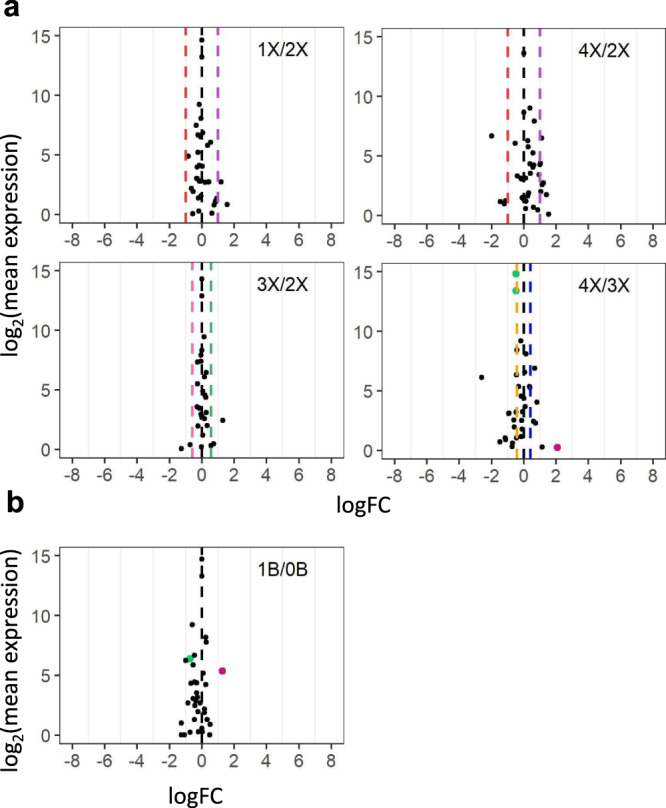
a Scatter plots in each ploidy series compared with diploids. Analysis was conducted as described in Fig. 2. A FC of 1.0 (logFC of 0) represents no change. FCs of 0.5 (1X/2X), 1.33 (4X/3X), 1.5 (3X/2X), and 2.0 (4X/2X) represent a gene-dosage effect, whereas FCs of 2.0 (1X/2X), 0.75 (4X/3X), 0.67 (3X/2X), and 0.5 (4X/2X) represent the inverse ratio of MIRNA expression. These FC values are demarcated with labeled vertical lines in red (0.5), pink (0.67), orange (0.75), black (1.0), blue (1.33), green (1.5), and purple (2.0). b Scatter plots of diploids with one B chromosome compared with the corresponding control with no B (1B/0B). Source data are provided in Supplementary Data 4.
Polyploids show less differential miRNA expression than aneuploidy
Scatter plots comparing ploidies of haploid, triploid, and tetraploid with the corresponding diploid control show much less modulation compared with aneuploids, with fewer DEMs found in each ploidy comparison than most aneuploidy comparisons (Figs. 6b and 7a). No DEM was identified in comparing ploidies of haploid, triploid, and tetraploid with the corresponding diploid control. It is generally accepted that there is a linear relationship between ploidy, cell size, and transcriptome size in Arabidopsis and maize34,77–79. Considering that the normalization method used in this study does not reflect the expression level per cell, changes in miRNA expression levels in the ploidy series would be canceled by altered cell size and transcriptome size. Thus, that no DEM was found reflects the minor changes in the relative miRNA expression in the ploidy series.
We further investigated the DME in comparing tetraploids to triploids and found 4 miRNAs to be significantly differentially expressed in the 4X/3X comparison (Figs. 6b and 7a). Analysis of ratios of these 4 DEMs (Cluster_182185, Cluster_211907, Cluster_219450, and Cluster_3815) shows a different trend of modulation in the 3X/2X comparison compared with that in the 4X/2X comparison (Supplementary Data 4). Thus, these DEMs are likely caused by a difference in the genetic background, as triploids originated from inbred line Mo17 while tetraploids were from W22. The results indicate that the trend of miRNA modulation from triploids and tetraploids is not detectable.
Responses of cis miRNAs to changes in chromosomal dosage
Previous studies examining how diploid aneuploidy influences the expression of individual DEGs revealed four types of responses34. Two of them belong to a linear relationship between expression levels and chromosomal dosage, including positive and negative correlations. The other two belong to a nonlinear relationship, in which genes are both upregulated or downregulated in monosomies and trisomies compared to the diploid control, respectively, named increased effect (both upregulated) and decreased effect (both downregulated). It was reported that a gene-dosage effect is the plurality trend for individual cis mRNA expression upon changes of chromosome dosage in the range of diploid aneuploid sizes examined34. Dosage compensation is also commonly observed for cis mRNAs in aneuploids. However, the latter type of response is difficult to be captured considering dosage compensated protein-coding genes are generally not statistically differentially expressed and the insignificance of differential gene expression could be caused by various reasons. To examine if cis miRNAs exhibit similar types of responses to chromosomal changes as cis mRNAs, the expression pattern of individual cis miRNAs was analyzed. Out of the 60 miRNAs that fall in the cis region of aneuploids assayed in this study, 45 show a detectable cis expression level. Results of DME analysis reveal that 7 cis miRNAs are differentially expressed in all aneuploidy conditions available in this study (Fig. 8 and Supplementary Fig. 5, Supplementary Table 2). Five of these miRNAs show a direct gene-dosage effect, while 2 exhibit a negative dosage effect. In addition, 15 are not differentially expressed in any aneuploidy conditions, a few of which show dosage compensation (Fig. 8c). Out of the 23 remaining miRNAs whose expression is differentially expressed in at least one aneuploid condition,11 display a direct gene-dosage effect, as a trend of increased expression with ascending chromosomal dosage was observed. One exhibits a negative dosage effect with a decreased expression upon increased chromosomal dosage. 4 present an increased effect with a greater expression level in aneuploidy compared to diploids and/or haploids, whereas one shows a decreased effect with miRNAs modulated to the opposite direction compared with the increased effect. The 6 remaining miRNAs show a mixed effect with different expression patterns between diploid aneuploidy and haploid aneuploidy (Supplementary Fig. 5). Thus, the direct gene-dosage effect is the predominant type of response of individual cis miRNAs reacting to chromosomal changes.
Fig. 8. Expression patterns of cis MIRNAs.
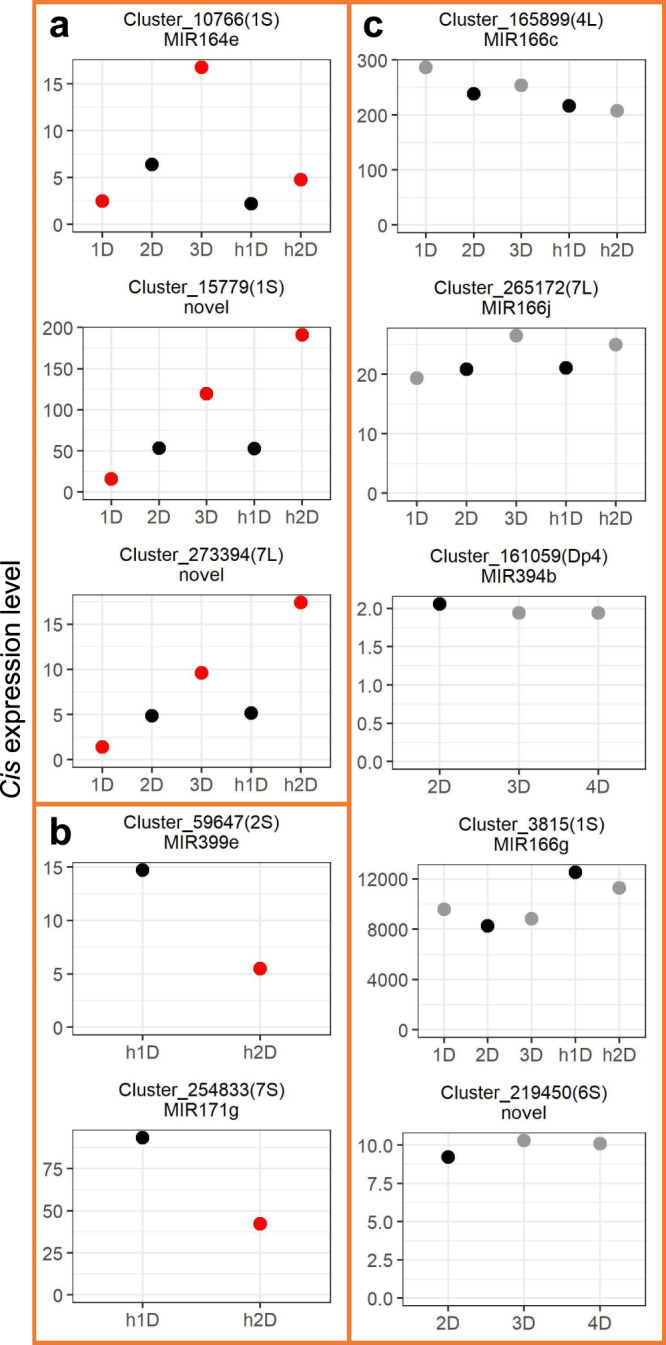
The x-axis refers to the dosage of the cis chromosomal region within parentheses, whereas the y-axis designates the cis expression level (rpm) of each MIRNA. Each MIRNA cluster was annotated as described in “Methods”. Novel MIRNAs denote ones that failed to match any preexisting annotation. Differential MIRNA expression was computed as described in Fig. 2. Control groups were painted in black. MIRNAs with FDR < 0.05 compared with the control were depicted in red, whereas ones with FDR ≥ 0.05 were depicted in gray. a Example MIRNAs showing a dosage effect. b Example MIRNAs showing a negative dosage effect. c Example MIRNAs exhibiting dosage compensation. Source data are provided in Supplementary Data 4.
Trans-acting effects of miRNAs under the influence of aneuploidy
Predominant increased and decreased effects in which the expression of many DEGs under genome imbalance is modulated toward the same direction regardless of increased or decreased chromosomal dosage were observed for trans DEGs in diploid aneuploids, although linear correlations between mRNA expression levels and chromosomal dosage were also detected34. By contrast, only the positive dosage effect and inverse dosage effect were observed in trans mRNAs in disomies compared with their corresponding haploid controls35. To investigate if miRNAs have the same trans-acting effects, expression patterns of trans DEMs were assayed. Trans DEMs that are differentially expressed in disomies compared with haploids when diploid aneuploids are not available, or those that are differentially expressed in all aneuploidy comparisons except one when diploids aneuploids are available (e.g., differentially expressed in 1D/2D and h1D/h2D but not in 3D/2D) were selected for further analysis. 25 trans miRNAs with significant differential expression in 1–7 different B–A translocation lines were identified (Fig. 9 and Supplementary Fig. 6). For the 28 trans miRNAs differentially expressed in disomies compared with haploids but not available in diploid aneuploids due to differences in chromosome arms analyzed, 21 exhibit a positive dosage effect whereas 7 show an inverse dosage effect (Fig. 9d, h, and Supplementary Fig. 6). Out of the 35 miRNAs differentially expressed in diploid aneuploids (sometimes also in disomies), 8, 6, 3, and 7 trans DEMs show a positive dosage effect, inverse dosage effect, increased effect, and decreased effect, respectively, while 11 display a mixed effect that does not belong to any of the four described above (Fig. 9 and Supplementary Fig. 6). Thus, both linear and nonlinear relationships between chromosomal dosage and the direction of genomic modulation exist in the regulation of trans miRNAs in aneuploidy.
Fig. 9. Expression patterns of trans DEMs.

The cis location of each MIRNA is depicted within parentheses. The x-axis refers to the dosage of the chromosomal region as noted in the bottom-left corner of each panel, whereas the y-axis designates the expression level (rpm) of each MIRNA corresponding to the genotype on the x-axis. Thus, all MIRNAs are in trans, with altered expression levels and unvaried DNA copy numbers. Other aspects were computed as in Fig. 8. a–d Example MIRNAs showing a positive modulation. e–h Example MIRNAs showing an inverse dosage effect. i–k Example MIRNAs exhibiting an increased effect. l–o Example MIRNAs exhibiting a decreased effect. Source data are provided in Supplementary Data 4.
In addition, trans expression of one miRNA expressed in plants with aneuploidy of different cis regions shows similar and/or different types of responses. For example, MIR171g (Cluster_254833), located in the cis region of 7S, displays a decreased trans effect in diploid and haploid aneuploidy relative to the control with the varied chromosomal dosage of 1L, 6L, and 7L (Fig. 9m–o). By contrast, trans expression of MIR166c (Cluster_165899) located on 4L shows a positive dosage effect with the varied dosage of 1S but shows an inverse effect with altered copy number of the chromosomal segment 3S (Fig. 9b, f). Another newly identified miRNA, encoded by Cluster_170541 on 4L, was expressed with a positive effect in 2S aneuploids whereas with an inverse effect in 3L and 7S aneuploids, respectively (Fig. 9d, g, h).
Cis miRNAs function as regulators of gene expression in aneuploidy
To test if miRNAs function as regulators in the changes in global gene expression induced by aneuploidy, correlations between expression levels of miRNAs and their putative targets were examined. Targets of all 64 miRNAs found in this study were predicted by psRNAtarget (Supplementary Data 6), with the two miRNAs impacted by the B chromosome excluded from further study. After data treatment, 768 predicted interactions function through target cleavage between expressed miRNAs and their corresponding targets were identified. The relationship between a miRNA and its target was determined by Pearson correlation between the expression levels of the two across all available genotypes. Expression levels of 192 (25%) of these predicted interactions are significantly correlated as shown in Supplementary Data 7 (Pearson correlation, P value < 0.05). As a complement, interactions between miRNAs and their targets were characterized by summarizing data generated from degradome sequencing from previous studies in maize (see Methods). 750 interactions were identified, 167 (22%) of which show a significant correlation across all genotypes (Pearson correlation, P value < 0.05; Supplementary Data 8). 49 of these significant interactions could be found by both psRNATarget prediction and degradome sequencing data analysis, 33 of which have a negative PCC value. A Gene Ontology (GO) Enrichment analysis on all targets whose expression levels are identified to be significantly correlated with those of their corresponding miRNAs through psRNATarget prediction or degradome sequencing data analysis revealed an enrichment of terms related to protein refolding (GO:0042026), developmental process (GO:0032502), and regulation of transcription, DNA-templated (GO:0006355) (Supplementary Table 3). Similarly, terms related to transcription, DNA-templated (GO:0006351), developmental process (GO:0032502), and regulation of transcription, DNA-templated (GO:0006355) are enriched in targets from the 49 interactions identified by both psRNATarget prediction and degradome sequencing data analysis (Supplementary Table 4). These results indicate the putative regulatory role of targets modulated by miRNAs under the impact of aneuploidy.
The results above illustrate that miRNAs function as regulators in global modulations of gene expression in aneuploidy. Now we focus on how cis miRNAs impact the expression of trans genes on a smaller scale. We assayed the expression levels of the trans targets of each miRNA when its dosage is varied in cis. PCCs between expression levels of each cis miRNA and its predicted trans targets in genotypes with the varied dosage of a specific chromosomal segment were computed. miRNAs located in the cis region of 2Sa, 2Sa_deletion, 7Sc, and 10L19 are excluded for further analysis because these miRNAs are only expressed in disomies and haploids in cis and the corresponding P value for Pearson correlation could not be produced. Lowly expressed miRNAs and genes were excluded from the analysis. 27 significant interactions predicted by psRNATarget were identified (Pearson correlation, P value < 0.05), 17 of which have a negative PCC value (Supplementary Fig. 7). In addition, 20 significant interactions derived from degradome sequencing data were found (Pearson correlation, P value < 0.05), with 13 of them being negative correlations (Supplementary Fig. 8). Five interactions, including 1 positive and 4 negative ones, were characterized by both methods (Fig. 10).
Fig. 10. Expression levels of cis MIRNAs and their trans targets.

The cis location of each MIRNA or each target is depicted within parentheses. “Other” refers to genes that do not fall in the cis region of any B–A translocation line. The x-axis refers to the dosage of the chromosomal region as noted in the bottom-left corner of each panel, whereas the y-axis designates the expression level (rpm) of each MIRNA in cis or each target in trans (normalized read counts) corresponding to the genotype on the x-axis. Correlations between cis MIRNAs (blue background panel) and their targets (white background panel below each MIRNA) were predicted by psRNATarget (yellow circled 1) or gathered from degradome sequencing data from other studies (blue circled 2). R Pearson correlation coefficient between expression levels of MIRNA and its corresponding target. P values for Pearson correlation (two-sided; confidence intervals, 95%; no adjustment made for multiple comparisons): *P value < 0.05; **P value < 0.01 (exact P values shown in Supplementary Data 7, 8). a Example MIRNA that targets SBP domain TFs. b Example MIRNAs that target GRAS domain TFs. c Example MIRNA that targets ethylene‐responsive TFs. d Example MIRNA that targets a mitochondrial-targeted gene Zm00004b040287 (ZmMORF3). Source data are provided in Supplementary Data 7, 8.
Here we present some examples illustrating how cis miRNAs regulate the expression of their trans mRNA targets. MIR156h (Cluster_355979), located on 10L, shows an increased effect while expressing in cis. It negatively regulates the expression of three genes encoding SBP-type domain-containing proteins in trans with the varied dosage of chromosomal segment 10L (Fig. 10a). MIR171n (Cluster_328824) encodes a miRNA that represses the expression of a gene (Zm00004b022266) encoding a GRAS domain-containing protein in 9L aneuploids. miR171e (Cluster_2196) that shows a direct gene-dosage effect due to changes in the dosage of 1S positively regulates the expression of another GRAS TF (Zm00004b006662) (Fig. 10b). miR396b (Cluster_312281) negatively regulates the expression of a gene (Zm00004b013149) encoding an AP2/ERF domain-containing protein (Fig. 10c). Furthermore, miR166f (Cluster_182185) that exhibits a direct dosage effect in cis causes a proportional downregulation of its trans mRNA target MORF3 (Zm00004b040287) that functions in mitochondria (Fig. 10d). These results indicate that varied chromosomal dosages can alter the expression of cis miRNAs, thus resulting in changes in the expression of their trans mRNA targets.
Discussion
Despite many recent advances in comprehensive gene expression studies on aneuploidy and polyploidy, the function of miRNAs in genomic imbalance has not been previously investigated. In this study, the global miRNA modulation in haploid and diploid aneuploids with the varied dosage of multiple chromosomal segments was examined in maize, in concert with a whole-genome ploidy series including haploids, diploids, triploids, and tetraploids. Along with the gene expression data collected from previous studies34,35, the interactions between miRNAs and their gene targets were assayed. This analysis allows one to address several questions about genomic balance. (1) How do aneuploidy and polyploidy impact the expression of miRNAs both globally and on a per miRNA basis? (2) What is the consequence of varied miRNA dosage in gene expression? (3) Does genomic imbalance similarly affect miRNA expression compared with protein-coding gene expression? This study provides insights into understanding these questions.
Aneuploidy causes varied miRNA expression both in cis and in trans. While the global trend of cis miRNA modulation could hardly be assayed due to the sample-size limit, trans miRNAs showed an overall trend of modulation toward the inverse level, although both positive and negative modulations were observed. Such a trend is similar to that of global trans protein-coding gene modulation reported in previous studies34,35. However, trans miRNAs were modulated to a lesser degree in aneuploidy compared with trans mRNA genes, indicated by the lack of correlation between medians of ratios of trans miRNAs and trans mRNAs (Fig. 1) and the proportion of trans DEMs out of expressed trans miRNAs in contrast to that of DEGs (Supplementary Table 1). Expression of individual cis miRNAs shows a predominant dosage effect, although dosage compensation, increased, and decreased effects are also observed. Cis genes in previous studies also exhibit similar expression patterns. Analysis of trans DEMs reveals the existence of both linear and nonlinear correlations between expression levels of DEMs and the corresponding chromosomal dosage. While the increased and decreased effects are the major trend for trans DEGs under genomic imbalance, it is difficult to determine the predominant type of response for trans DEMs due to the limitation of the number of miRNAs. Further, for both miRNAs and mRNAs, a lesser degree of modulation was observed in the whole-genome ploidy series than in aneuploidy. In sum, miRNAs are modulated similarly to protein-coding genes under the impact of genomic imbalance.
Apart from the distal aneuploids, the expression of an interstitial aneuploid, Dp4, surrounding the centromeric region of chromosome 4 was examined. Three miRNAs were identified in the cis region of Dp4, two of which are expressed in the leaf tissue studied. However, none of them are significantly differentially expressed in Dp4 aneuploids compared with the control. In the previous study, it was found that a larger proportion of cis protein-coding genes in Dp4 are dosage compensated than in distal aneuploids, and this phenomenon is not due to epigenetic repression of gene expression around centromeric regions34. Considering few miRNAs were identified in the cis region of Dp4, it is difficult to determine if the trend toward dosage compensation in cis is a result of a specific mechanism or the limit of sample size. Further, while a large number of trans DEGs (mRNAs) was found in Dp4 aneuploids, only 1 trans DEM (miRNAs) was identified. Ratios of trans mRNAs for protein-coding genes in Dp4 aneuploids are distributed toward the inverse level, whereas medians of trans ratios of miRNAs are close to 1.0, indicating the trend of regulation of trans mRNAs and miRNAs are different in Dp4 aneuploids. These results reveal that varied dosage of Dp4 causes limited changes in miRNA expression both in cis and trans. Additional heterochromatic regions will need to be examined to determine if the lack of modulation of miRNAs in Dp4 is generalizable for aneuploidy of centromeric heterochromatin.
Regulatory networks that involve both miRNAs and genes in aneuploidy are likely to be complicated. There could be various interactions between a miRNA and its target mRNA as well as the TFs that regulate both. For example, the varied copy number of a miRNA in cis could result in altered expression of a TF in cis or trans, which could lead to altered expression of another protein-coding gene or miRNA in cis or trans. Considering the lack of information regarding interactions between TFs and their miRNA target in maize and the complexity due to the additive impact on mRNA/miRNA expression from changes in expression of various upstream protein-coding genes/miRNAs, here we restrict our analysis to the simplest interactions. To examine the interaction between miRNAs and their targets in aneuploidy globally, expression levels of miRNAs and their targets were assayed across all genotypes regardless of cis and trans effects. In addition, to investigate interactions on a smaller scale, the expression of cis miRNAs and their trans targets with the varied chromosomal dosage of the same region was analyzed. Such type of analysis also provides information regarding whether different types of responses in trans protein-coding genes (e.g., inverse effect) are a result of varied expression of miRNAs.
Further, miRNAs control gene expression through RNA target cleavage or translational inhibition49. Since RNA-seq experiments do not provide information related to the latter aspect, this study focuses on the regulation of gene expression via RNA target cleavage. In this case, expression of the gene target is postulated to be either correlated with that of the miRNA, or not detectable due to complete gene silencing. However, when genes are totally silenced, their expression levels are approaching zero. Genes not being expressed in RNA-seq data could be caused by various reasons, not necessarily gene silencing. Further, it has been reported that the expression of miRNAs and that of their targets are generally negatively correlated in plants, although positive correlations are also observed80–82. In a study identifying miRNA expression-related quantitative trait loci in maize, both positive and negative regulations between miRNAs and their target genes have been characterized83. Thus, this study only focuses on interactions when expression levels of miRNAs are statistically significantly correlated with those of their targets predicted by psRNATarget or proven by degradome sequencing.
Associations that involve miRNAs and their targets characterized in this study are also reported in other studies. For instance, the interaction between miR171 and GRAS TFs was identified in Arabidopsis, maize, tomato, and Larix kaempferi84–88. miR171 acts to negatively regulate GRAS TFs in mediating shoot branch production and gibberellin-regulated chlorophyll biosynthesis under light conditions during leaf development in Arabidopsis84,86. It was reported in many studies that miR156 targets many SBP-box TFs that regulate a large network regulating plant growth and development89–92. For example, miR156 targets SBP-box TFs that are required for male fertility in Arabidopsis93. miR156 was also reported to target SBP-box TFs that interact with other TFs involved in bread wheat tillering and spikelet development94.
Expression levels of miRNAs and their targets in 49 interactions identified by both psRNATarget and degradome sequencing present significant correlations across all genotypes, indicating miRNAs function as regulators consistently in aneuploidy with the varied dosage of various chromosomal segments. However, PCCs of these significant interactions fall between −0.53 and 0.70 (Supplementary Data 7, 8). That the strength of the correlations is relatively low is likely caused by the influence of the tangled unbalanced regulatory network on the expression of the targets. When examined on a smaller scale, the varied chromosomal dosage of the same portion of the genome results in different expression patterns of cis miRNAs, and their targets in trans are thus modulated differently. Effects of trans targets include positive correlations, inverse effect, increased, and decreased effects (Fig. 10 and Supplementary Figs. 7, 8). Thus, the four types of responses observed in trans DEGs triggered by aneuploidy could be caused by regulation carried out by miRNAs, at least partially. The function of miRNAs in dosage response was also reported in other species. For example, Z-linked miR-2954-3p functions in dosage compensation of the bird Z chromosome, by preferentially down-regulating Z-linked dosage-sensitive genes in males in chicken and zebra finch95.
Previous studies on gene expression support the GBH in that genomic stoichiometry plays an important role in quantitative gene expression. This study further reveals the regulatory role of miRNAs fits in the GBH. Cis and trans miRNAs respond to changes in chromosomal dosage in similar ways to protein-coding genes under the impact of genomic imbalance. In addition, much less modulation of miRNA expression was observed in the whole-ploidy series compared with aneuploids. From the perspective of evolutionary genomics, miRNAs are preferentially retained as duplicates in plants47,48. This is likely due to the regulatory role of miRNAs that predominantly target genes involved in regulatory and metabolic pathways, most of which involve multicomponent interactions. Thus, the removal or deletion of a miRNA within a duplicated pair would have negative fitness consequences and would be selected against during evolution. These findings indicate miRNAs are likely to be dosage-sensitive in plants, which is further supported by the results of this study. In addition, the regulatory role of miRNAs in the expression of components of multisubunit complexes has also been verified, as an enrichment of genes involved in transcription was observed for the targets regulated by miRNAs in aneuploidy. Thus, this study reveals miRNAs as participants of the gene regulatory network under genomic imbalance. Varied chromosomal dosage results in modulation of dosage-sensitive miRNAs, and thus causes changes in expression of their targets, which could operate in cascades affecting more genes. Results in this study imply the potential application of changing the dosage of specific miRNAs as regulators of gene expression under genomic imbalance. In other words, modulation of miRNA expression could reduce the genomic imbalance through neutralizing changes in the expression of key dosage-dependent modifiers occurring with aneuploidy. This study also provides a valuable resource for the identification of potential targets of specific miRNAs. Transgenic expression of these miRNAs in maize would facilitate research on the function and molecular mechanism of specific miRNAs.
It has been reported in several studies that aneuploidy of different chromosomal regions results in various phenotypic defects, impacting the floral development and timing, the development of leaf, culm, root, and so on35,96,97. Transcriptomic analyses of mRNA-seq and sRNA-seq data in the present and previous studies as well as the phenotypic descriptions of aneuploids are valuable resources for the identification of potential quantitative trait loci34,35,96,97. However, relating a phenotypic effect to a specific miRNA, gene, or locus is not easily achieved. Varied copy number of a chromosomal region causes differential expression of hundreds to thousands of genes, likely due to the influence of the tangled unbalanced regulatory network on gene expression30,34,35. Considering the coexistence of linear and nonlinear relationships between varied chromosomal dosage and the corresponding gene expression levels34, relating changes in miRNA or gene expression to phenotypic effects would require high-quality miRNA and/or gene regulatory networks, or computational tools specifically designed for unraveling regulatory networks in aneuploidy, which still await development in maize. In addition, future studies that dissect the chromosomal regions into smaller blocks would be helpful to reduce the complexity mentioned above.
Methods
Plant material, nucleic acid isolation, and sRNA-seq library construction
45-day-old leaf tissue of monosomies, trisomies, and tetrasomies was from a former study with diploids as the control;34 whereas that of disomies and their haploid control were from another study35. Total RNA and sRNA were co-extracted from maize leaves using mirVana™ miRNA Isolation Kit (Thermo Fisher Scientific, AM1560). Total RNA was used for mRNA-seq in two former studies34,35. sRNA libraries were generated directly from total RNA with TruSeq Small RNA Library Preparation Kit (Illumina, RS-200-0048) and were sequenced on the NextSeq500 platform at the University of Missouri Genomics Technology Core. sRNA-seq data of W22 maize plants with one B chromosome and W22 wild-type plants with no B chromosome were from a previous study98. The grouping information of the above materials was summarized in Supplementary Data 1.
sRNA-seq data process
Adaptors at the end of the reads were trimmed using cutadapt version 1.1699 and low-quality reads were removed using the FASTX-Toolkit (http://hannonlab.cshl.edu/fastx_toolkit/, fastq_quality_filter -Q33 -q20 -p80). Reads mapped to known structural RNAs (rRNAs, tRNAs, sn-RNAs, and sno-RNAs) from Rfam 14.0100 using bowtie 2 were removed101. Subsequently, reads of 18-30 nt without poly(A) tails were aligned to the maize reference genome W22v2, the maize chloroplast, and mitochondrial genomes73,102,103 using ShortStack version 3.8.3 (-mincov 20)70–72. Although the A chromosomal segments with varied dosages may contain various miRNA contents due to their different background, it has been shown that genes encoding miRNAs in maize are conserved across different inbreds47,83. In addition, considering all the samples were processed simultaneously for pairwise comparison, only the miRNAs that were found among all the samples at a specific location were identified. MIRNA loci were annotated by aligning the sequence of each cluster against known miRNA sequences in miRBase 22104 and transcript sequences in the RefSeq database (restricted to Zea mays) at NCBI with BLASTN105, and by referring to the location of genes annotated in the W22v2 genome73 (Supplementary Data 2). RPM normalization was performed and lowly expressed miRNAs (the mean of RPM across all biological replicates from the experimental and control group in each comparison <0.5) were excluded from further analysis. DME analyses were performed using edgeR to test for the significance of fold change between each treatment group to the control group using raw read counts as the input74,75,106. Considering triploids originated from inbred line Mo17 while tetraploids were from W22, DME analysis in comparing tetraploids to triploids was performed by a two-sided Student’s t test, which tests for the significance of whether the mean log2 ratio of 4X/2X differs from the mean log2 ratio of 3X/2X. P values were adjusted by the Benjamini–Hochberg algorithm for computing false discovery rates. miRNAs with an FDR or adjusted P value <0.05 were defined as DEMs. PCA plots were generated in R using normalized read counts.
Generation of scatter plots
To generate scatter plots, FDR and log fold change with base 2 (logFC) produced by edgeR were used74,75,106. The logFC between treatment and control was plotted on the x-axis, while the log2 value of the mean of RPM normalized counts of the treatment and control group was plotted on the y-axis. Data points with an FDR (or adjusted P value in 4X/3X) < 0.05 and a corresponding logFC > 0 were depicted in magenta, while points with an FDR (or adjusted P value in 4X/3X) < 0.05 and a corresponding logFC < 0 were depicted in green. Otherwise, they were designated in black.
MicroRNA target prediction
Targets of miRNAs were predicted using psRNATarget with an expected value of 3 or less98,107. miRNAs that function through translation repression were filtered out while those that function through target cleavage were retained. Degradome sequencing data collected from various studies were used as a complement to show miRNA-target interactions108–116. Afterward, the gene model names of these targets were translated from B73 (AGPv4) to W22 (W22v2) using the Translate Gene Model IDs tool from MaizeGDB117. PCCs and the corresponding P values between expression levels of expressed miRNAs and their corresponding targets across the corresponding genotypes were computed (two-sided; confidence intervals, 95%; no adjustment made for multiple comparisons).
GO term enrichment analysis
GO term enrichment analysis was performed using PANTHER online tools 17.0118. Genes of interest were translated from W22 (W22v2) to B73 (AGPv4) using the Translate Gene Model IDs tool from MaizeGDB117. Subsequently, genes were tested for over-or under-representation using Fisher’s exact test against all maize genes (AGPv4). Only significant terms (Bonferroni-corrected P values < 0.05) were listed (Supplementary Tables 3 and 4).
Reporting summary
Further information on research design is available in the Nature Research Reporting Summary linked to this article.
Supplementary information
Description of Additional Supplementary Files
Acknowledgements
Research supported by National Science Foundation Grant IOS-1545780 (X.S., H.Y., C.C., J.H., J.C., and J.A.B.). T.J. is supported by National Science Foundation Grant DMS-1615789. The computation for this work was performed on the high-performance computing infrastructure provided by Research Computing Support Services and in part by the National Science Foundation under grant number CNS-1429294 at the University of Missouri, Columbia MO 10.32469/10355/69802.
Source data
Author contributions
X.S., H.Y., C.C., J.H., T.J., J.C., and J.A.B. designed research; X.S., and H.Y. performed experiments; X.S., C.C., and J.A.B. analyzed data; and X.S. and J.A.B. wrote the paper.
Peer review
Peer review information
Nature Communications thanks Guodong Ren and the other, anonymous, reviewer(s) for their contribution to the peer review of this work.
Data availability
The sRNA-sequencing data generated in this study have been deposited in the Gene Expression Omnibus (GEO) repository under the accession code GSE189317. The processed data generated in this study are provided in the Supplementary Information file. The RefSeq database is available in NCBI [https://www.ncbi.nlm.nih.gov/refseq/] and the known miRNA sequences are available in the miRBase database [https://www.mirbase.org/]. The mRNA-sequencing data that support the findings of this study are available in the GEO repository under the accession code GSE149186. Source data are provided with this paper.
Competing interests
The authors declare no competing interests.
Footnotes
Publisher’s note Springer Nature remains neutral with regard to jurisdictional claims in published maps and institutional affiliations.
These authors contributed equally: Xiaowen Shi, Hua Yang.
Supplementary information
The online version contains supplementary material available at 10.1038/s41467-022-30704-x.
References
- 1.Blakeslee AF, Belling J, Farnham ME. Chromosomal duplication and Mendelian phenomena in Datura mutants. Science. 1920;52:388–390. doi: 10.1126/science.52.1347.388. [DOI] [PubMed] [Google Scholar]
- 2.Blakeslee AF. Types of mutations and their possible significance in evolution. Am. Nat. 1921;55:254–267. doi: 10.1086/279810. [DOI] [Google Scholar]
- 3.Sinnott EW, Blakeslee AF. Structural changes associated with factor mutations and with chromosome mutations in Datura. Proc. Natl Acad. Sci. U.S.A. 1922;8:17–19. doi: 10.1073/pnas.8.2.17. [DOI] [PMC free article] [PubMed] [Google Scholar]
- 4.Bridges CB. Sex in relation to chromosomes and genes. Am. Nat. 1925;59:127–137. doi: 10.1086/280023. [DOI] [Google Scholar]
- 5.Blakeslee AF. New Jimson weeds from old chromosomes. J. Hered. 1934;25:81–108. doi: 10.1093/oxfordjournals.jhered.a103898. [DOI] [Google Scholar]
- 6.Grell EH. The dose effect of ma-l+ and ry+ on xanthine dehydrogenase activity in Drosophila melanogaster. Zeitschrift für Vererbungslehre. 1962;93:371–377. [Google Scholar]
- 7.O’Brien SJ, Gethmann RC. Segmental aneuploidy as a probe for structural genes in Drosophila: mitochondrial membrane enzymes. Genetics. 1973;75:155–167. doi: 10.1093/genetics/75.1.155. [DOI] [PMC free article] [PubMed] [Google Scholar]
- 8.Birchler JA. A study of enzyme activities in a dosage series of the long arm of chromosome one in maize. Genetics. 1979;92:1211–1229. doi: 10.1093/genetics/92.4.1211. [DOI] [PMC free article] [PubMed] [Google Scholar]
- 9.Birchler JA. The genetic basis of dosage compensation of alcohol dehydrogenase-1 in maize. Genetics. 1981;97:625–637. doi: 10.1093/genetics/97.3-4.625. [DOI] [PMC free article] [PubMed] [Google Scholar]
- 10.Birchler JA, Newton KJ. Modulation of protein levels in chromosomal dosage series of maize: the biochemical basis of aneuploid syndromes. Genetics. 1981;99:247–266. doi: 10.1093/genetics/99.2.247. [DOI] [PMC free article] [PubMed] [Google Scholar]
- 11.Rabinow L, Nguyen-Huynh AT, Birchler JA. A trans-acting regulatory gene that inversely affects the expression of the white, brown and scarlet loci in Drosophila. Genetics. 1991;129:463–480. doi: 10.1093/genetics/129.2.463. [DOI] [PMC free article] [PubMed] [Google Scholar]
- 12.Carlson PS. Locating genetic loci with aneuploids. Mol. Genet. Genom. 1972;114:273–280. doi: 10.1007/BF00267495. [DOI] [PubMed] [Google Scholar]
- 13.Guo M, Birchler JA. Trans-acting dosage effects on the expression of model gene systems in maize aneuploids. Science. 1994;266:1999–2002. doi: 10.1126/science.266.5193.1999. [DOI] [PubMed] [Google Scholar]
- 14.Birchler JA, Bhadra U, Bhadra MP, Auger DL. Dosage-dependent gene regulation in multicellular eukaryotes: implications for dosage compensation, aneuploid syndromes, and quantitative traits. Dev. Biol. 2001;234:275–288. doi: 10.1006/dbio.2001.0262. [DOI] [PubMed] [Google Scholar]
- 15.Veitia RA. Exploring the etiology of haploinsufficiency. Bioessays. 2002;24:175–184. doi: 10.1002/bies.10023. [DOI] [PubMed] [Google Scholar]
- 16.Seidman JG, Seidman C. Transcription factor haploinsufficiency: when half a loaf is not enough. J. Clin. Investig. 2002;109:451–455. doi: 10.1172/JCI0215043. [DOI] [PMC free article] [PubMed] [Google Scholar]
- 17.Papp B, Pál C, Hurst LD. Dosage sensitivity and the evolution of gene families in yeast. Nature. 2003;424:194–197. doi: 10.1038/nature01771. [DOI] [PubMed] [Google Scholar]
- 18.Kondrashov FA, Koonin EV. A common framework for understanding the origin of genetic dominance and evolutionary fates of gene duplications. Trends Genet. 2004;20:287–290. doi: 10.1016/j.tig.2004.05.001. [DOI] [PubMed] [Google Scholar]
- 19.Xie W, Birchler JA. Identification of Inverse regulator-a (Inr-a) as synonymous with pre-mRNA cleavage complex II protein (Pcf11) in Drosophila. G3. 2012;2:701–706. doi: 10.1534/g3.112.002071. [DOI] [PMC free article] [PubMed] [Google Scholar]
- 20.Veitia RA, Bottani S, Birchler JA. Gene dosage effects: nonlinearities, genetic interactions, and dosage compensation. Trends Genet. 2013;29:385–393. doi: 10.1016/j.tig.2013.04.004. [DOI] [PubMed] [Google Scholar]
- 21.Defoort J, Van de Peer Y, Carretero-Paulet L. The evolution of gene duplicates in angiosperms and the impact of protein-protein interactions and the mechanism of duplication. Genome Biol. Evol. 2019;11:2292–2305. doi: 10.1093/gbe/evz156. [DOI] [PMC free article] [PubMed] [Google Scholar]
- 22.Birchler JA, Riddle NC, Auger DL, Veitia RA. Dosage balance in gene regulation: biological implications. Trends Genet. 2005;21:219–226. doi: 10.1016/j.tig.2005.02.010. [DOI] [PubMed] [Google Scholar]
- 23.Birchler JA, Veitia RA. The gene balance hypothesis: from classical genetics to modern genomics. Plant Cell. 2007;19:395–402. doi: 10.1105/tpc.106.049338. [DOI] [PMC free article] [PubMed] [Google Scholar]
- 24.Birchler JA, Veitia RA. The gene balance hypothesis: implications for gene regulation, quantitative traits and evolution. N. Phytol. 2010;186:54–62. doi: 10.1111/j.1469-8137.2009.03087.x. [DOI] [PMC free article] [PubMed] [Google Scholar]
- 25.Birchler JA, Veitia RA. Gene balance hypothesis: connecting issues of dosage sensitivity across biological disciplines. Proc. Natl Acad. Sci. U.S.A. 2012;109:14746–14753. doi: 10.1073/pnas.1207726109. [DOI] [PMC free article] [PubMed] [Google Scholar]
- 26.Torres EM, et al. Effects of aneuploidy on cellular physiology and cell division in haploid yeast. Science. 2007;317:916–924. doi: 10.1126/science.1142210. [DOI] [PubMed] [Google Scholar]
- 27.Williams BR, et al. Aneuploidy affects proliferation and spontaneous immortalization in mammalian cells. Science. 2008;322:703–709. doi: 10.1126/science.1160058. [DOI] [PMC free article] [PubMed] [Google Scholar]
- 28.Sun L, et al. Dosage compensation and inverse effects in triple X metafemales of Drosophila. Proc. Natl Acad. Sci. USA. 2013;110:7383–7388. doi: 10.1073/pnas.1305638110. [DOI] [PMC free article] [PubMed] [Google Scholar]
- 29.Sun L, et al. Differential effect of aneuploidy on the X chromosome and genes with sex-biased expression in Drosophila. Proc. Natl Acad. Sci. USA. 2013;110:16514–16519. doi: 10.1073/pnas.1316041110. [DOI] [PMC free article] [PubMed] [Google Scholar]
- 30.Hou, J. et al. Global impacts of chromosomal imbalance on gene expression in Arabidopsis and other taxa. Proc. Natl. Acad. Sci. USA. 201807796. 10.1073/pnas.1807796115 (2018). [DOI] [PMC free article] [PubMed]
- 31.Raznahan A, et al. Sex-chromosome dosage effects on gene expression in humans. Proc. Natl Acad. Sci. USA. 2018;115:7398–7403. doi: 10.1073/pnas.1802889115. [DOI] [PMC free article] [PubMed] [Google Scholar]
- 32.Johnson AF, et al. Magnitude of modulation of gene expression in aneuploid maize depends on the extent of genomic imbalance. J. Genet. Genom. 2020;47:93–103. doi: 10.1016/j.jgg.2020.02.002. [DOI] [PubMed] [Google Scholar]
- 33.Zhang X, et al. Integrated functional genomic analyses of Klinefelter and Turner syndromes reveal global network effects of altered X chromosome dosage. Proc. Natl Acad. Sci. USA. 2020;117:4864–4873. doi: 10.1073/pnas.1910003117. [DOI] [PMC free article] [PubMed] [Google Scholar]
- 34.Shi X, et al. Genomic imbalance determines positive and negative modulation of gene expression in diploid maize. Plant Cell. 2021;33:917–939. doi: 10.1093/plcell/koab030. [DOI] [PMC free article] [PubMed] [Google Scholar]
- 35.Yang H, et al. Predominantly inverse modulation of gene expression in genomically unbalanced disomic haploid maize. Plant Cell. 2021;33:901–916. doi: 10.1093/plcell/koab029. [DOI] [PMC free article] [PubMed] [Google Scholar]
- 36.Zhang S, Wang R, Huang C, Zhang L, Sun L. Modulation of global gene expression by aneuploidy and CNV of dosage sensitive regulatory genes. Genes. 2021;12:1606. doi: 10.3390/genes12101606. [DOI] [PMC free article] [PubMed] [Google Scholar]
- 37.Simillion C, Vandepoele K, Van Montagu MCE, Zabeau M, Van de Peer Y. The hidden duplication past of Arabidopsis thaliana. Proc. Natl Acad. Sci. U.S.A. 2002;99:13627–13632. doi: 10.1073/pnas.212522399. [DOI] [PMC free article] [PubMed] [Google Scholar]
- 38.Blanc G, Wolfe KH. Functional divergence of duplicated genes formed by polyploidy during Arabidopsis evolution. Plant Cell. 2004;16:1679–1691. doi: 10.1105/tpc.021410. [DOI] [PMC free article] [PubMed] [Google Scholar]
- 39.Maere S, et al. Modeling gene and genome duplications in eukaryotes. Proc. Natl Acad. Sci. USA. 2005;102:5454–5459. doi: 10.1073/pnas.0501102102. [DOI] [PMC free article] [PubMed] [Google Scholar]
- 40.Thomas BC, Pedersen B, Freeling M. Following tetraploidy in an Arabidopsis ancestor, genes were removed preferentially from one homeolog leaving clusters enriched in dose-sensitive genes. Genome Res. 2006;16:934–946. doi: 10.1101/gr.4708406. [DOI] [PMC free article] [PubMed] [Google Scholar]
- 41.Aury J-M, et al. Global trends of whole-genome duplications revealed by the ciliate Paramecium tetraurelia. Nature. 2006;444:171–178. doi: 10.1038/nature05230. [DOI] [PubMed] [Google Scholar]
- 42.Freeling M, Thomas BC. Gene-balanced duplications, like tetraploidy, provide predictable drive to increase morphological complexity. Genome Res. 2006;16:805–814. doi: 10.1101/gr.3681406. [DOI] [PubMed] [Google Scholar]
- 43.Freeling M, et al. Many or most genes in Arabidopsis transposed after the origin of the order Brassicales. Genome Res. 2008;18:1924–1937. doi: 10.1101/gr.081026.108. [DOI] [PMC free article] [PubMed] [Google Scholar]
- 44.Jiao Y, et al. Ancestral polyploidy in seed plants and angiosperms. Nature. 2011;473:97–100. doi: 10.1038/nature09916. [DOI] [PubMed] [Google Scholar]
- 45.Tasdighian S, et al. Reciprocally retained genes in the angiosperm lineage show the hallmarks of dosage balance sensitivity. Plant Cell. 2017;29:2766–2785. doi: 10.1105/tpc.17.00313. [DOI] [PMC free article] [PubMed] [Google Scholar]
- 46.Du K, et al. The sterlet sturgeon genome sequence and the mechanisms of segmental rediploidization. Nat. Ecol. Evol. 2020;4:841–852. doi: 10.1038/s41559-020-1166-x. [DOI] [PMC free article] [PubMed] [Google Scholar]
- 47.Zhang L, et al. A genome-wide characterization of microRNA genes in maize. PLoS Genet. 2009;5:e1000716. doi: 10.1371/journal.pgen.1000716. [DOI] [PMC free article] [PubMed] [Google Scholar]
- 48.Abrouk M, et al. Grass microRNA gene paleohistory unveils new insights into gene dosage balance in subgenome partitioning after whole-genome duplication. Plant Cell. 2012;24:1776–1792. doi: 10.1105/tpc.112.095752. [DOI] [PMC free article] [PubMed] [Google Scholar]
- 49.Rogers K, Chen X. Biogenesis, turnover, and mode of action of plant microRNAs. Plant Cell. 2013;25:2383–2399. doi: 10.1105/tpc.113.113159. [DOI] [PMC free article] [PubMed] [Google Scholar]
- 50.Bologna NG, et al. Nucleo-cytosolic shuttling of ARGONAUTE1 prompts a revised model of the plant microRNA pathway. Mol. Cell. 2018;69:709–719.e5. doi: 10.1016/j.molcel.2018.01.007. [DOI] [PubMed] [Google Scholar]
- 51.Cambiagno DA, et al. HASTY modulates miRNA biogenesis by linking pri-miRNA transcription and processing. Mol. Plant. 2021;14:426–439. doi: 10.1016/j.molp.2020.12.019. [DOI] [PubMed] [Google Scholar]
- 52.Chen X. A microRNA as a translational repressor of APETALA2 in Arabidopsis flower development. Science. 2004;303:2022–2025. doi: 10.1126/science.1088060. [DOI] [PMC free article] [PubMed] [Google Scholar]
- 53.Kidner CA, Martienssen RA. Spatially restricted microRNA directs leaf polarity through ARGONAUTE1. Nature. 2004;428:81–84. doi: 10.1038/nature02366. [DOI] [PubMed] [Google Scholar]
- 54.Chuck G, Meeley R, Irish E, Sakai H, Hake S. The maize tasselseed4 microRNA controls sex determination and meristem cell fate by targeting Tasselseed6/indeterminate spikelet1. Nat. Genet. 2007;39:1517–1521. doi: 10.1038/ng.2007.20. [DOI] [PubMed] [Google Scholar]
- 55.Lu S, Sun Y-H, Chiang VL. Stress-responsive microRNAs in Populus. Plant J. 2008;55:131–151. doi: 10.1111/j.1365-313X.2008.03497.x. [DOI] [PubMed] [Google Scholar]
- 56.Ding Y, Tao Y, Zhu C. Emerging roles of microRNAs in the mediation of drought stress response in plants. J. Exp. Bot. 2013;64:3077–3086. doi: 10.1093/jxb/ert164. [DOI] [PubMed] [Google Scholar]
- 57.Lu J, et al. MicroRNA expression profiles classify human cancers. Nature. 2005;435:834–838. doi: 10.1038/nature03702. [DOI] [PubMed] [Google Scholar]
- 58.Lin S, Gregory RI. MicroRNA biogenesis pathways in cancer. Nat. Rev. Cancer. 2015;15:321–333. doi: 10.1038/nrc3932. [DOI] [PMC free article] [PubMed] [Google Scholar]
- 59.Zhao Y, et al. Dysregulation of cardiogenesis, cardiac conduction, and cell cycle in mice lacking miRNA-1-2. Cell. 2007;129:303–317. doi: 10.1016/j.cell.2007.03.030. [DOI] [PubMed] [Google Scholar]
- 60.Cui Y, et al. Global miRNA dosage control of embryonic germ layer specification. Nature. 2021;593:602–606. doi: 10.1038/s41586-021-03524-0. [DOI] [PMC free article] [PubMed] [Google Scholar]
- 61.Peterson, K. J. et al. MicroRNAs as indicators into the causes and consequences of whole genome duplication events. Mol. Biol. Evol. msab344 10.1093/molbev/msab344 (2021). [DOI] [PMC free article] [PubMed]
- 62.Valli AA, et al. Most microRNAs in the single-cell alga Chlamydomonas reinhardtii are produced by Dicer-like 3-mediated cleavage of introns and untranslated regions of coding RNAs. Genome Res. 2016;26:519–529. doi: 10.1101/gr.199703.115. [DOI] [PMC free article] [PubMed] [Google Scholar]
- 63.Cui J, You C, Chen X. The evolution of microRNAs in plants. Curr. Opin. Plant Biol. 2017;35:61–67. doi: 10.1016/j.pbi.2016.11.006. [DOI] [PMC free article] [PubMed] [Google Scholar]
- 64.Moran Y, Agron M, Praher D, Technau U. The evolutionary origin of plant and animal microRNAs. Nat. Ecol. Evol. 2017;1:27. doi: 10.1038/s41559-016-0027. [DOI] [PMC free article] [PubMed] [Google Scholar]
- 65.Roman H. Directed fertilization in maize. Proc. Natl Acad. Sci. USA. 1948;34:36–42. doi: 10.1073/pnas.34.2.36. [DOI] [PMC free article] [PubMed] [Google Scholar]
- 66.Beckett JB. B-A translocations in maize I. Use in locating genes by chromosome arms. J. Hered. 1978;69:27–36. doi: 10.1093/oxfordjournals.jhered.a108878. [DOI] [Google Scholar]
- 67.Carlson, W. R. B chromosomes as a model system for nondisjunction. Aneuploidy: Induction and Test Systems(Part B) (eds Vig, B. K. & Sandberg, A. A.) 199–207 (Alan R. Liss Inc., NY, 1988).
- 68.Beckett, J. B. Cytogenetic, genetic and plant breeding applications of B–A translocations in maize. in Developments in Plant Genetics and Breeding vol. 2 493–529 (Elsevier, 1991).
- 69.Zheng Y-Z, Carlson WR. Further construction of proximal duplication stocks. Maize Genet. C Newsl. 1997;71:37–38. [Google Scholar]
- 70.Axtell MJ. ShortStack: comprehensive annotation and quantification of small RNA genes. RNA. 2013;19:740–751. doi: 10.1261/rna.035279.112. [DOI] [PMC free article] [PubMed] [Google Scholar]
- 71.Shahid S, Axtell MJ. Identification and annotation of small RNA genes using ShortStack. Methods. 2014;67:20–27. doi: 10.1016/j.ymeth.2013.10.004. [DOI] [PMC free article] [PubMed] [Google Scholar]
- 72.Axtell MJ, Meyers BC. Revisiting criteria for plant microRNA annotation in the era of big data. Plant Cell. 2018;30:272–284. doi: 10.1105/tpc.17.00851. [DOI] [PMC free article] [PubMed] [Google Scholar]
- 73.Springer NM, et al. The maize W22 genome provides a foundation for functional genomics and transposon biology. Nat. Genet. 2018;50:1282–1288. doi: 10.1038/s41588-018-0158-0. [DOI] [PubMed] [Google Scholar]
- 74.Robinson MD, McCarthy DJ, Smyth GK. edgeR: a Bioconductor package for differential expression analysis of digital gene expression data. Bioinformatics. 2010;26:139–140. doi: 10.1093/bioinformatics/btp616. [DOI] [PMC free article] [PubMed] [Google Scholar]
- 75.McCarthy DJ, Chen Y, Smyth GK. Differential expression analysis of multifactor RNA-Seq experiments with respect to biological variation. Nucleic Acids Res. 2012;40:4288–4297. doi: 10.1093/nar/gks042. [DOI] [PMC free article] [PubMed] [Google Scholar]
- 76.Shi, X. et al. The gene balance hypothesis: epigenetics and dosage effects in plants. In Plant Epigenetics and Epigenomics (eds. Spillane, C. & McKeown, P.) vol. 2093 161–171 (Springer US, 2020). [DOI] [PubMed]
- 77.Miller M, Zhang C, Chen ZJ. Ploidy and hybridity effects on growth vigor and gene expression in Arabidopsis thaliana hybrids and their parents. G3. 2012;2:505–513. doi: 10.1534/g3.112.002162. [DOI] [PMC free article] [PubMed] [Google Scholar]
- 78.Tsukaya H. Does ploidy level directly control cell size? Counterevidence from Arabidopsis genetics. PLoS ONE. 2013;8:e83729. doi: 10.1371/journal.pone.0083729. [DOI] [PMC free article] [PubMed] [Google Scholar]
- 79.Robinson DO, et al. Ploidy and size at multiple scales in the Arabidopsis sepal. Plant Cell. 2018;30:2308–2329. doi: 10.1105/tpc.18.00344. [DOI] [PMC free article] [PubMed] [Google Scholar]
- 80.Axtell MJ, Bartel DP. Antiquity of microRNAs and their targets in land plants. Plant Cell. 2005;17:1658–1673. doi: 10.1105/tpc.105.032185. [DOI] [PMC free article] [PubMed] [Google Scholar]
- 81.Jha A, Shankar R. Employing machine learning for reliable miRNA target identification in plants. BMC Genom. 2011;12:636. doi: 10.1186/1471-2164-12-636. [DOI] [PMC free article] [PubMed] [Google Scholar]
- 82.Pandey, P., Srivastava, P. K. & Pandey, S. P. Prediction of plant miRNA targets. In Plant MicroRNAs (ed de Folter, S.) vol. 1932 99–107 (Springer New York, 2019). [DOI] [PubMed]
- 83.Chen S-Y, et al. Identification of miRNA-eQTLs in maize mature leaf by GWAS. BMC Genom. 2020;21:689. doi: 10.1186/s12864-020-07073-0. [DOI] [PMC free article] [PubMed] [Google Scholar]
- 84.Wang L, Mai Y-X, Zhang Y-C, Luo Q, Yang H-Q. MicroRNA171c-targeted SCL6-II, SCL6-III, and SCL6-IV genes regulate shoot branching in Arabidopsis. Mol. Plant. 2010;3:794–806. doi: 10.1093/mp/ssq042. [DOI] [PubMed] [Google Scholar]
- 85.Li W-F, et al. The post-transcriptional regulation of LaSCL6 by miR171 during maintenance of embryogenic potential in Larix kaempferi (Lamb.) Carr. Tree Genet. Genomes. 2014;10:223–229. doi: 10.1007/s11295-013-0668-y. [DOI] [Google Scholar]
- 86.Ma Z, et al. Arabidopsis miR171-targeted scarecrow-like proteins bind to GT cis-elements and mediate gibberellin-regulated chlorophyll biosynthesis under light conditions. PLoS Genet. 2014;10:e1004519. doi: 10.1371/journal.pgen.1004519. [DOI] [PMC free article] [PubMed] [Google Scholar]
- 87.Ge F, et al. Genome-wide analysis of transcription factors involved in maize embryonic callus formation. Physiol. Plant. 2016;158:452–462. doi: 10.1111/ppl.12470. [DOI] [PubMed] [Google Scholar]
- 88.Huang W, et al. Overexpression of a tomato miR171 target gene SlGRAS24 impacts multiple agronomical traits via regulating gibberellin and auxin homeostasis. Plant Biotechnol. J. 2017;15:472–488. doi: 10.1111/pbi.12646. [DOI] [PMC free article] [PubMed] [Google Scholar]
- 89.Wang J-W, Czech B, Weigel D. miR156-regulated SPL transcription factors define an endogenous flowering pathway in Arabidopsis thaliana. Cell. 2009;138:738–749. doi: 10.1016/j.cell.2009.06.014. [DOI] [PubMed] [Google Scholar]
- 90.Yu N, et al. Temporal control of trichome distribution by microRNA156-targeted SPL genes in Arabidopsis thaliana. Plant Cell. 2010;22:2322–2335. doi: 10.1105/tpc.109.072579. [DOI] [PMC free article] [PubMed] [Google Scholar]
- 91.Gou J-Y, Felippes FF, Liu C-J, Weigel D, Wang J-W. Negative regulation of anthocyanin biosynthesis in Arabidopsis by a miR156-targeted SPL transcription factor. Plant Cell. 2011;23:1512–1522. doi: 10.1105/tpc.111.084525. [DOI] [PMC free article] [PubMed] [Google Scholar]
- 92.Cheng H, et al. Genomic identification, characterization and differential expression analysis of SBP-box gene family in Brassica napus. BMC Plant Biol. 2016;16:196. doi: 10.1186/s12870-016-0852-y. [DOI] [PMC free article] [PubMed] [Google Scholar]
- 93.Xing S, Salinas M, Höhmann S, Berndtgen R, Huijser P. miR156-targeted and nontargeted SBP-box transcription factors act in concert to secure male fertility in Arabidopsis. Plant Cell. 2011;22:3935–3950. doi: 10.1105/tpc.110.079343. [DOI] [PMC free article] [PubMed] [Google Scholar]
- 94.Liu J, Cheng X, Liu P, Sun J. miR156-targeted SBP-Box transcription factors interact with DWARF53 to regulate TEOSINTE BRANCHED1 and BARREN STALK1 expression in bread wheat. Plant Physiol. 2017;174:1931–1948. doi: 10.1104/pp.17.00445. [DOI] [PMC free article] [PubMed] [Google Scholar]
- 95.Warnefors M, et al. Sex-biased microRNA expression in mammals and birds reveals underlying regulatory mechanisms and a role in dosage compensation. Genome Res. 2017;27:1961–1973. doi: 10.1101/gr.225391.117. [DOI] [PMC free article] [PubMed] [Google Scholar]
- 96.Lee EA, Coe EH, Darrah LL. Genetic variation in dosage effects in maize aneuploids. Genome. 1996;39:711–721. doi: 10.1139/g96-090. [DOI] [PubMed] [Google Scholar]
- 97.Lee EA, Darrah LL, Coe EH. Dosage effects on morphological and quantitative traits in maize aneuploids. Genome. 1996;39:898–908. doi: 10.1139/g96-113. [DOI] [PubMed] [Google Scholar]
- 98.Shi X, et al. Effect of aneuploidy of a non-essential chromosome on gene expression in maize. Plant J. 2022;110:193–211. doi: 10.1111/tpj.15665. [DOI] [PMC free article] [PubMed] [Google Scholar]
- 99.Martin M. Cutadapt removes adapter sequences from high-throughput sequencing reads. EMBnet J. 2011;17:10–12. doi: 10.14806/ej.17.1.200. [DOI] [Google Scholar]
- 100.Daub J, Eberhardt RY, Tate JG, Burge SW. Rfam: annotating families of non-coding RNA sequences. Methods Mol. Biol. 2015;1269:349–363. doi: 10.1007/978-1-4939-2291-8_22. [DOI] [PubMed] [Google Scholar]
- 101.Langmead B, Salzberg SL. Fast gapped-read alignment with Bowtie 2. Nat. Methods. 2012;9:357–359. doi: 10.1038/nmeth.1923. [DOI] [PMC free article] [PubMed] [Google Scholar]
- 102.Clifton SW, et al. Sequence and comparative analysis of the maize NB mitochondrial genome. Plant Physiol. 2004;136:3486–3503. doi: 10.1104/pp.104.044602. [DOI] [PMC free article] [PubMed] [Google Scholar]
- 103.Bosacchi M, Gurdon C, Maliga P. Plastid genotyping reveals the uniformity of cytoplasmic male sterile-T maize cytoplasms. Plant Physiol. 2015;169:2129–2137. doi: 10.1104/pp.15.01147. [DOI] [PMC free article] [PubMed] [Google Scholar]
- 104.Kozomara, A., Birgaoanu, M. & Griffiths-Jones, S. miRBase: from microRNA sequences to function. Nucleic Acids Res. 10.1093/nar/gky1141 (2018). [DOI] [PMC free article] [PubMed]
- 105.O’Leary NA, et al. Reference sequence (RefSeq) database at NCBI: current status, taxonomic expansion, and functional annotation. Nucleic Acids Res. 2016;44:D733–D745. doi: 10.1093/nar/gkv1189. [DOI] [PMC free article] [PubMed] [Google Scholar]
- 106.Trapnell C, et al. Differential gene and transcript expression analysis of RNA-seq experiments with TopHat and Cufflinks. Nat. Protoc. 2012;7:562–578. doi: 10.1038/nprot.2012.016. [DOI] [PMC free article] [PubMed] [Google Scholar]
- 107.Dai X, Zhuang Z, Zhao P. X. psRNATarget: a plant small RNA target analysis server (2017 release) Nucleic Acids Res. 2018;46:W49–W54. doi: 10.1093/nar/gky316. [DOI] [PMC free article] [PubMed] [Google Scholar]
- 108.Liu H, et al. Identification of miRNAs and their target genes in developing maize ears by combined small RNA and degradome sequencing. BMC Genom. 2014;15:25. doi: 10.1186/1471-2164-15-25. [DOI] [PMC free article] [PubMed] [Google Scholar]
- 109.Li H, et al. Development of incompletely fused carpels in maize ovary revealed by miRNA, target gene and phytohormone analysis. Front. Plant Sci. 2017;8:463. doi: 10.3389/fpls.2017.00463. [DOI] [PMC free article] [PubMed] [Google Scholar]
- 110.Zhao Z, et al. Genome-Wide identification of miRNAs and their targets involved in the developing internodes under maize ears by responding to hormone signaling. PLoS ONE. 2016;11:e0164026. doi: 10.1371/journal.pone.0164026. [DOI] [PMC free article] [PubMed] [Google Scholar]
- 111.Wu F-Y, et al. Comparison of miRNAs and their targets in seed development between two maize inbred lines by high-throughput sequencing and degradome analysis. PLoS ONE. 2016;11:e0159810. doi: 10.1371/journal.pone.0159810. [DOI] [PMC free article] [PubMed] [Google Scholar]
- 112.Fu R, et al. Identification of salt tolerance-related microRNAs and their targets in maize (Zea mays L.) using high-throughput sequencing and degradome analysis. Front. Plant Sci. 2017;8:864. doi: 10.3389/fpls.2017.00864. [DOI] [PMC free article] [PubMed] [Google Scholar]
- 113.Zhou Y, et al. Dual transcriptome analysis reveals insights into the response to Rice black-streaked dwarf virus in maize. J. Exp. Bot. 2016;67:4593–4609. doi: 10.1093/jxb/erw244. [DOI] [PMC free article] [PubMed] [Google Scholar]
- 114.Zhao Y, et al. Combined small RNA and degradome sequencing reveals novel miRNAs and their targets in response to low nitrate availability in maize. Ann. Bot. 2013;112:633–642. doi: 10.1093/aob/mct133. [DOI] [PMC free article] [PubMed] [Google Scholar]
- 115.Zhang X, et al. Integrated transcriptome, small RNA, and degradome analysis reveals the complex network regulating starch biosynthesis in maize. BMC Genom. 2019;20:574. doi: 10.1186/s12864-019-5945-1. [DOI] [PMC free article] [PubMed] [Google Scholar]
- 116.Gong S, Ding Y, Huang S, Zhu C. Identification of miRNAs and their target genes associated with sweet corn seed vigor by combined small RNA and degradome sequencing. J. Agric. Food Chem. 2015;63:5485–5491. doi: 10.1021/acs.jafc.5b00522. [DOI] [PubMed] [Google Scholar]
- 117.Andorf CM, et al. MaizeGDB update: new tools, data and interface for the maize model organism database. Nucleic Acids Res. 2016;44:D1195–D1201. doi: 10.1093/nar/gkv1007. [DOI] [PMC free article] [PubMed] [Google Scholar]
- 118.Mi H, Muruganujan A, Thomas PD. PANTHER in 2013: modeling the evolution of gene function, and other gene attributes, in the context of phylogenetic trees. Nucleic Acids Res. 2013;41:D377–D386. doi: 10.1093/nar/gks1118. [DOI] [PMC free article] [PubMed] [Google Scholar]
Associated Data
This section collects any data citations, data availability statements, or supplementary materials included in this article.
Supplementary Materials
Description of Additional Supplementary Files
Data Availability Statement
The sRNA-sequencing data generated in this study have been deposited in the Gene Expression Omnibus (GEO) repository under the accession code GSE189317. The processed data generated in this study are provided in the Supplementary Information file. The RefSeq database is available in NCBI [https://www.ncbi.nlm.nih.gov/refseq/] and the known miRNA sequences are available in the miRBase database [https://www.mirbase.org/]. The mRNA-sequencing data that support the findings of this study are available in the GEO repository under the accession code GSE149186. Source data are provided with this paper.