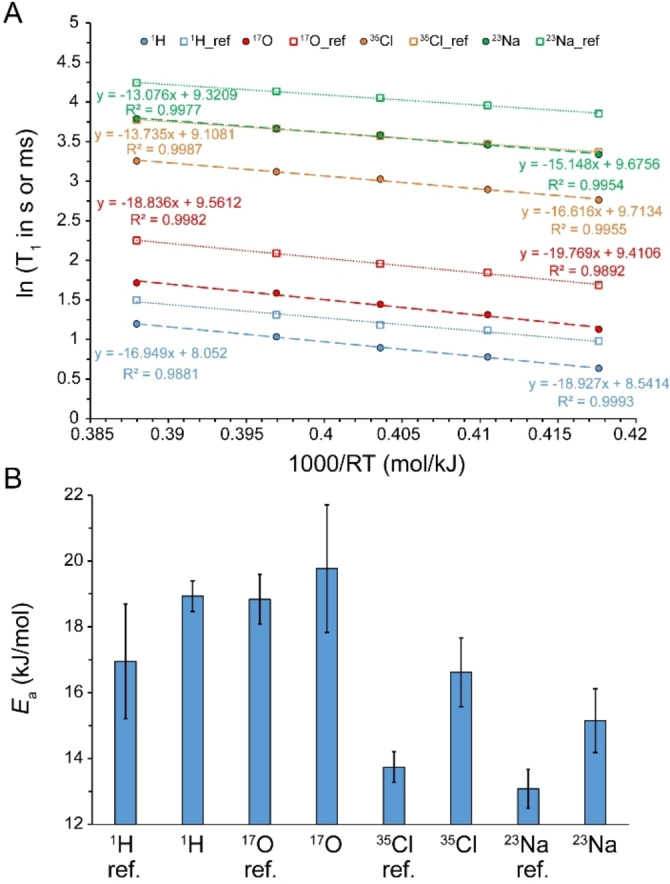
Figure 10.

(A) Arrhenius analysis of temperature dependence of T 1 relaxation time for water molecules (1H and 17O) and chloride (35Cl) and sodium (23Na) ions in reference (dilute) and saturated NaCl solutions. (B) Comparison of T 1‐based activation energies (E a; average±SD) obtained for reorientational dynamics of water molecules (1H and 17O) and chloride (35Cl) and sodium (23Na) ions. Except for 1H, all other T 1 values in (A) are given in ms.
