

Abstract
Multicellular life forms have evolved many times on our planet, suggesting that this is a common evolutionary innovation. Multiple advantages have been proposed for the emergence of multicellularity (MC). In this paper, we address the problem of how the first precondition for MC, namely ‘stay together’, might have occurred under spatially limited resources exploited by a population of unicellular agents. Using a minimal model of evolved cell–cell adhesion among growing and dividing cells that exploit a localized resource with a given size, we show that a transition occurs at a critical resource size separating a phase of evolved multicellular aggregates from a phase where unicellularity (UC) is favoured. The two phases are separated by an intermediate domain where both UC and MC can be selected by evolution. This model provides a minimal approach to the early stages that were required to transition from individuality to cohesive groups of cells associated with a physical cooperative effect: when resources are present only in a localized portion of the habitat, MC is a desirable property as it helps cells to keep close to the available local nutrients.
Keywords: evolutionary transitions, multicellularity, cell adhesion, evolutionary preconditions, statistical physics
1. Introduction
The fact that multicellularity (MC) has evolved in our biosphere many times out of unicellular (UC) life forms suggests that the UC → MC transition is a favourable event under a wide range of circumstances [1–3]. MC might have arisen in the first place for a number of different reasons. The common thread is usually the presence of some kind of cooperative effect. As pointed out in [4], the fact that MC has evolved so many times strongly suggests that ‘there has been a significant selection for it in the ancient cellular world’. Indeed, we can identify a diverse range of selective drivers that might have operated in the first steps towards MC, but also shown to be in action in artificially evolved systems [5,6]. They include mechanisms of predator avoidance (associated with larger assemblies), faster sedimentation, stress resistance or division of labour, among others [7]. The selective pressure is here associated with a specific, efficient functional trait. A major breakthrough in this field was the experimental evolution of multicellular snowflake aggregates obtained from yeast experiencing selection in a simple environment where resources are well mixed [5]. These synthetic MC systems can have a complex embodiment [8] and further support the concept that the rise of MC can be explored under controlled conditions.
In this paper, we adopt a different approximation by asking about the preconditions that immediately precede the landscape of simple MC. In our model approach, a single cell can generate a whole progeny that can display adhesion-based forces. This feature thus fits Knoll’s definition of MC organisms as the group including ‘filaments, clusters, balls or sheets of cells that arise via mitotic division from a single progenitor’ [2]. In this context, a MC system is not only a coherent association of cells: it is generated through a process of development and a life cycle where groups, instead of individuals, are the new self-replicating entities. However, a developmental programme or a life cycle are higher-level complexity processes that we do not consider here. Instead, we seek to explore first steps towards MC that require the formation of a cohesive group [5,9,10]. A requirement for MC is the presence of cell–cell interactions that guarantee the formation of cohesive groups of cells [11–13]. Such cohesive assemblies can be either the result of aggregation from free-living cells or due to clonal development. In this paper, we explore the preconditions for the latter when resource limitations can act as a strong driver for MC (for a detailed analysis of aggregative MC and its limitations, see [12]).
A proper approximation requires one to consider an explicit physical model. MC is grounded in a physical interaction among discrete cells that occurs in a given spatial embedding mediated by cell adhesion molecules (see figure 1a–c). Cell adhesion is actually a crucial part of the generic physical mechanisms that pervade multicellular programmes [19–21]. Here cell adhesion is a physical interaction that can be described, as a first approximation, by means of Newtonian forces and their associated energy potentials [17]. Such models can be hard to explore numerically due to the complexity of multi-body interactions under molecular fields. In this paper, we use a standard approximation to strongly interacting systems [22] that replaces this complex description by a discrete one, where cells interact by means of a simple bond while the characteristic distance between cells in equilibrium (r0 in figure 1c) is replaced by a discrete spatial scale defined by a fixed spacing between nearest sites on a lattice.
Figure 1.

Cell adhesion and its lattice modelling counterpart. (a) Interactions among cells carrying adhesion molecules (such as cadherins) can involve homologous (HOM) or heterologous (HET), depending on when the molecules are the same or different, respectively [14,15]. The microscopic details (b) of the physical exchanges between cell adhesion molecules (CAM) can be captured by simple physical models where the energy E associated with cell–cell interactions is displayed in (c) against cell–cell distance D. A minimum energy E0 is associated with a given characteristic scale rb that would define the equilibrium distance between cells [16,17]. Such energy function (and the underlying forces associated with it) are replaced in this paper by a simple toy model where pairwise interactions are defined by means of a simple coupling coefficient Jkr (d) that weights the strength of the interaction between cells k and f. In this simple way we take into account the heterogeneous nature of evolved CAM and the impact of heterogeneous adhesion [18]. The spatial dynamics of the in silico cells on the lattice occurs in parallel with the production, decay and continuous diffusion of resources. Different resource abundances (R1 and R2) favour the evolution of two main types of behaviour (e), namely unicellular (UC) and multicellular (MC). Interactions occur among nearest neighbours (c) on the 3 × 3 (Moore) neighbourhood (f).
Finally, MC systems emerge in an ecological context where resources are relevant and their scarcity or spatial limitation automatically impose selection pressures to the embodied UC agents [23]. What is the impact of resource limitations as a trigger to evolve MC clusters of cells? What kind of primitive cooperation might emerge due to a purely physical association among single cells? Early experiments concerning adaptive radiations in competing microbial populations revealed that ecological opportunities offered by a heterogeneous environment can drive genetic diversification [24,25]. These radiations (which occur within the span of a few days) involve the generation of novel morphological diversity out of a single initial genotype. Both experimental and theoretical studies suggest that recently evolved MC organisms would face a high cost (compared to the unicellular strains from which they were evolved) associated with competition for local resources in spatially structured environments as a consequence of their larger size and increased cell densities [26,27]. In these experiments, using snowflake yeast as starting system, the fall of MC was the outcome of limited access to resources. While snowflakes did not revert to UC when selection for sedimentation was removed, locally distributed resources ended up in UC: the dispersal advantage of single cells was shown to overcome any of the initial advantages of the snowflakes.
The rise and fall of MC structures found in the previous studies call for a modelling approach that allows an exploration of embodied, spatially explicit evolution scenarios where different selection pressures can be introduced in relation with resource availability. In this paper, we further explore these problems by combining altogether population growth, cell adhesion and diffusion-limited resources in a toy model of evolved MC. The formal approach is thus a hybrid model that includes both discrete components (cells on a lattice) along with continuous variables associated with diffusion of resources. These hybrid models have been extensively used, for example, in the study of cancer growth [28] or in the aggregation dynamics of Dictyostelium discoideum [29,30] as well as in models of evolved MC [31,32]. In our model, a given nutrient field, localized in space, is exploited by a population of cells that consume it to grow and reproduce while evolving adhesion. Since moving away from local resources can be detrimental to single cells, evolution towards adhesive interactions is favoured when resources are available only in a reduced portion of the habitat, thus showing that in the presence of localized resources a simple embodied description of a cell population can develop a cooperative effect that allows MC to appear.
2. Methods
The original inspiration of our ‘physical’ description of cells and their interactions comes from our understanding of molecular adhesion forces [17,33,34]. Our in silico model considers a population of interacting cells (figure 1d) living on a two-dimensional L × L square lattice (figure 1e) with periodic boundary conditions, following the rules of a cellular Potts model as described by Steinberg [35] and extended by Graner & Glazier [36]; see also [37]:
| 2.1 |
In this simplified model, each cell occupies a single pixel i, j and is able to move across the lattice. The location and potential displacements of a given cell will depend on both physical (adhesion) and resource constraints. Each position has an associated state where the set includes empty (Sr = 0) and occupied (Sr = 1) sites.
A simple metabolism is implemented in the model, whereby cells proliferate and die depending on the absorption of a nutrient metabolite which forms a resource field R. Additionally, each cell carries a given adhesion parameter Jr, which determines its affinity with the other nearest cells in the local neighbourhood (figure 1f). The adhesion parameter J can be negative or positive, respectively favouring adhesion or active repulsion with other cells.
The interaction of cells with medium is neutral (i.e. equal to zero). Finally, each cell has an associated biomass (or internal energy) Br.
Adhesion dynamics occurs by means of an energy minimization process [35,38–40]. Cells can move around and are able to swap their positions with neighbouring cells. The swap is more probable to occur if it minimizes the energy of the system. The energy contribution of a given state Sr to the system is here defined as the sum of the pairwise interactions of the state Sr with each one of its eight neighbours in the set :
| 2.2 |
where the effective interaction between Sr and each neighbour is provided by the average , and the product takes into account the fact that the interaction of cells with empty sites is equal to zero. Owing to our definition of J, the smaller the values of the adhesion parameters, the lower the energy of the system will be.
The overall result of the energy minimization process is that the stronger the adhesion, the more cells will stay together and local movement will be limited. Each step in the dynamics involves choosing a random site (i.e. a site occupied by a cell). We then choose a neighbour site (which can be occupied or empty). We first calculate the initial energy of the system without swapping, and then the energy that would result from swapping the states Sr and . The energy calculation is limited to the neighbourhoods of these two sites, and thus the initial energy of the system (before swapping) will be given by the sum of the pairwise interactions of Sr and with their respective neighbours:
| 2.3 |
A similar expression is then obtained for the energy () of the system after swapping the two states:
| 2.4 |
The two states in Sr and will switch their positions with a higher probability if the configuration with swapped positions is energetically more favourable than the original configuration, i.e. if the energy difference is negative:
The probability of swapping follows the Metropolis transition form [41]:
| 2.5 |
such that the probability of swapping is higher for and becomes smaller as increases. The parameter T represents the temperature of the system (noise term), such that for T large enough we have (i.e. the swapping will occur randomly). For a single cell in empty space, we also have , since .
The second part of the model deals with the resource field Rr (figure 1a). An external nutrient is introduced at a continuous rate ρR within a circular area of diameter ϕ. Decay, consumption by cells and diffusion occur, following
| 2.6 |
Here we indicate as the discretization of the diffusion field, as we perform a numerical integration of a partial differential equation (e.g. [42]). The four terms on the right-hand side include: (a) a production of resource term ( is 1 if and zero otherwise), (b) a decay term associated with resource degradation (ηR Rr), (c) an active degradation rate associated with the intake from the cell located at r (ξR Sr Rr) and (d) the diffusion term.
The discretized version of the time derivative reads
for each site r = (x, y), and the discrete diffusion term reads
| 2.7 |
where {(x′, y′)} stands for the q nearest neighbours of r = (x, y).
Cells vary their biomass (internal energy) according to the following equation:
| 2.8 |
and will grow as a result of nutrient absorption. In fact, their biomass will increase as Br → Br + ξR Rr. However, there is a cost to maintain the living state, with a metabolic cost introduced as a decay Br → Br(1 − ηB). The model presents two threshold conditions associated with the minimal (Bmin) and maximum (Bmax) allowed cell biomass, which determine death and division. If Br ≤ Bmin, the cell dies and is therefore removed from the lattice (Br, Sr, Jr → 0). A cell can also die by a random probability χ. If, on the other hand, Br ≥ Bmax, the cell achieves its maximum allowed size and growth stops.
If the cell has achieved its maximum size and there is a neighbouring empty site , the cell will divide into two identical cells, generating two new states, one in the position Sr previously occupied by the mother cell, and one in the hitherto empty site , with and . The adhesion parameter J can be inherited by the offspring unvaried or mutated, where the probability that a mutation occurs is given by . If the mutation actually occurs, a change is introduced in the adhesion of the daughter cell in , namely , where ΔJ is a positive or negative number randomly drawn from a normal distribution with standard deviation . By including this rule, we allow the evolution of adhesion or active repulsion, starting from an initial population where J is set to zero for all cells. This is not a minor detail, since considering repulsion allows us to widen our set of possible evolutionary outcomes and to introduce a surrogate of negative chemotaxis [43]. Moreover, the rise and fall of MC organization can be explicitly framed under a single-parameter picture, dominated by the adhesion forces that can be described by means of scalar quantities.
By evolving individual adhesion values as described above, we test the idea that selection for adhesion is effective when resources are localized in space. Nutrient is constantly introduced in the area, in such a quantity that in the inner areas of the disc cells can reproduce effortlessly and death by lack of energy is extremely unlikely. Therefore, the death of cells on top of the nutrient disc can occur only with a random probability χ. On the contrary, cells that move away from the nutrient disc are not able to reproduce and rapidly die due to lack of energy. In particular, a simple calculation from equation (2.6) shows that under full occupation (i.e. when the normalized population P = 1), the value of nutrient at equilibrium will be
| 2.9 |
and since the level of biomass at which reproduction occurs is , reproduction of cells inside the nutrient disc will be effortless. A simplified pseudocode of the model can be found in the electronic supplementary material.
3. Results
We have studied the evolutionary dynamics of adhesion starting from an initially neutral (J = 0) population of cells. Specifically, at time zero cells are inoculated on 25% of the sites of the circular resource area , located at the centre of an L × L lattice (L = 200). The initial biomass for each cell is randomly set between 10−2 and 0.1 a.u. (arbitrary units of energy). The set of fixed parameters of our model is indicated in table 1. In our simulations, populations evolve over a maximum of T = 2 × 10⁵ Monte Carlo steps. Each step involves L × L asynchronous updates in which a random site is chosen and the previous rules are applied.
Table 1.
Model parameters.
| name | description | value |
|---|---|---|
| T | temperature (noise) parameter | 1 |
| ρR | resource input rate per site | 0.085 |
| ηR | resource natural degradation | 0.005 |
| ξR | resource absorption by cells | 0.001 |
| DR | resource diffusion factor | 0.05 |
| q | number of neighbours | 8 |
| ηB | cell’s internal biomass degradation | 0.1 |
| Bmin | minimum allowed biomass | 0.01 |
| Bmax | maximum allowed biomass | 0.05 |
| χ | random death probability | 0.1 |
| probability of mutation | 0.005 | |
| standard deviation of the mutation distribution | 0.005 | |
| ΔJ | maximum change in adhesion J | 0.1 |
3.1. Evolving adhesion under resource constraints
To introduce resource size as a parameter, we consider the diameter ϕ of the domain. Four examples are shown at the top of figure 2. The average adhesion rate 〈J〉 is computed at each Monte Carlo step, namely:
| 3.1 |
for t = 0, …, T. In figure 2, we show the evolution of the average adhesion for different resource sizes. We can see that, for small sizes, 〈J〉 evolves towards negative values (self-adhesion), favouring aggregation between cells. If we increase the size of the resource, we reach a critical value ϕc of the diameter after which adhesion will evolve towards positive values (self-repulsion).
Figure 2.
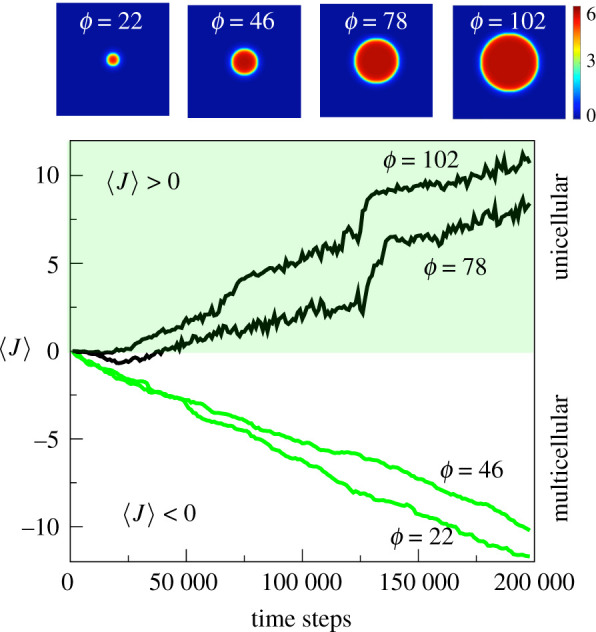
Evolution of adhesion (population-level average) for different sizes of the central nutrient disc (colour bar scale is in ×10−2 a.u.). For small resource sizes (ϕ < ϕc), the adhesion parameter J evolves towards multicellularity (i.e. adhesion, J < 0), whereas for larger resources unicellularity (repulsion) is selected (J > 0). On top we show the corresponding resource spatial snapshots associated with each of the four evolution experiments.
Close to ϕc ≈ 60, a marked transition occurs. This is summarized in figure 3a, where the previous runs have been averaged over 10 independent evolutionary experiments. Above a given minimum resource size, under which populations decline to extinction, two main phases can be distinguished, associated with multicellular (for ϕ < ϕc) or unicellular behaviour (for ϕ > ϕc). For small resource sizes, cells evolve self-adhesion, i.e. they implement an efficient mechanism to integrate consensus nutrient sensing and ensure that they remain close to the available source of energy. A steep increase in the values of average adhesion for ϕ ∼ ϕc indicates that the aggregative behaviour loses its efficiency over the free cell state (unicellular behaviour) for big resource sizes.
Figure 3.
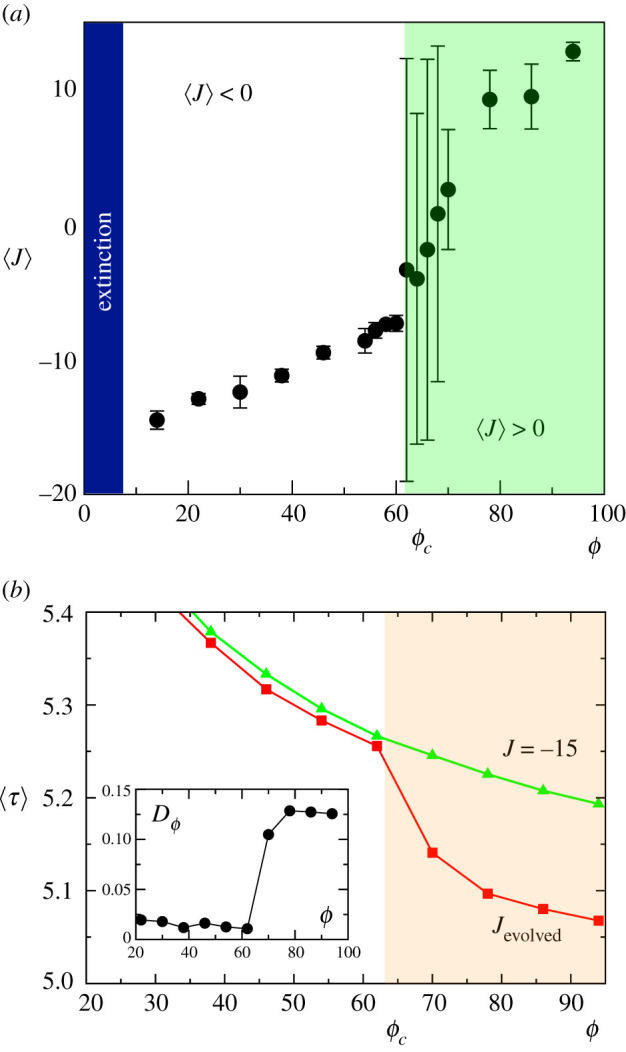
(a) Transitions from multi- to unicellularity, as displayed by the values of average adhesion 〈J〉 against ϕ, by averaging over 10 replicas of each evolutionary experiment. Error bars indicate the standard deviation. See electronic supplementary material, figure S2, for a comparison of this result with the same transition in a more relaxed model without active repulsion. (b) The average cell reproduction time 〈τ〉 against resource size. Here the evolved values of 〈J〉 are compared with the expected results for a fixed J = −15 value associated with multicellular aggregates. A marked divergence occurs close to ϕc as unicellularity is chosen, allowing for faster replication. The difference between both curves is shown in the inset.
In each of the two phases, cells carry out a different response to the surrounding density of cells. To see this, let us start with the original definition of the transition probability (2.5). We can see that, assuming that two neighbouring cells have been chosen, i.e. Sr Sk = 1, we just have . If we consider that in each population (or sub-population, as we will see) of cells 〈J〉 displays a small variance and thus Jr ∼ Jk = 〈J〉, we can write, setting T = 1:
| 3.2 |
| 3.3 |
where we define the average densities of occupied sites by ρ = q〈S〉 for q nearest neighbours (q = 8 in our case). For systems where densities are similar (i.e. if cells are equally scattered over ) we have ρ′ − ρ ≪ 1 and a Taylor expansion gives
| 3.4 |
This result indicates that, under the previous approximations, the probability of moving of a given cell located at is proportional to the density difference between the current and the alternative state. For positive 〈J〉, this means that movement occurs towards less dense locations. This situation reverses for negative couplings, with a probability that favours moving towards more crowded areas (i.e. adhesion).
What is being selected when resource sizes increase beyond the critical domain? Below this boundary the risk of moving away from forces evolution to choose adhesion, as MC represents the right strategy to stay on top of and maximize nutrient absorption. As we have shown in equation (2.9), resources are always abundant on top of , even in the case of full disc occupation, and cells can reproduce easily (because of the low reproduction threshold Bmax defined in our model). Nevertheless, the size of the nutrient disc does in fact affect the behaviour of cells. For ϕ < ϕc, we could expect that the evolution of adhesion (i.e. of MC behaviour) is the best strategy that cells have at their disposal to ensure that they and their offspring remain on top of the nutrient disc . Moreover, the evolution of adhesion allows cells to effectively integrate a nutrient-sensing mechanism: two cells displaying adhesion will remain attached, reducing their mobility and thus increasing the probability that their offspring is generated on top of the nutrient disc, creating a positive feedback loop. On the other hand, as becomes larger, one could expect that the probability of staying on top of the nutrient increases also for cells that are not displaying adhesion, and that therefore the need to evolve adhesion becomes less relevant. One could, therefore, explain the evolutionary emergence of UC over MC for ϕ > ϕc by speculating that UC provides some other kind of advantage over MC, which for ϕ > ϕc becomes dominant over the advantage of increased nutrient occupation that led to the selection of MC for ϕ < ϕc.
In figure 3b, we show that, as ϕ grows, the evolutionary dynamics of adhesion result in an average reproduction time 〈τ〉(ϕ) that displays a marked, discontinuous decay at ϕ ∼ ϕc. This is highlighted by a simple comparison with the expected average time shown by a non-evolutionary scenario in which cells always display adhesion (upper curve, using a representative fixed value J = −15). How should we explain the selection of UC over MC for ϕ > ϕc? We have already seen that MC and UC provide different advantages to cells (increased occupation of the nutrient disc and reduced reproduction time, respectively), and that the advantages of MC over UC, which are relevant for a small nutrient disc, become less important as ϕ > ϕc. One possible additional explanation for the selection of UC when ϕ > ϕc could be given by the fact that, since larger nutrient discs display a larger (the circumference of diameter ϕ, i.e. the ring at the border of the nutrient patch), there is a larger boundary at the interface between nutrient and empty space where division can occur more efficiently compared with the inner areas of the disc (where there are fewer empty spaces available for cells to reproduce), and UC selection might help cells to better exploit this opportunity. In fact, the more pronounced slope associated with the evolved system for ϕ ∼ ϕc suggests that above ϕc much more opportunities for replication are allowed, perhaps due to the much larger surface of . This difference is highlighted in the inset of figure 3b using a relative measure DT(ϕ) = (τ(J−15) − τ(Jevol))/(τ(J−15) + τ(Jevol)) where a marked transition is observed.
To find out what features of the system change in the selection of MC or UC, we have further analysed the statistical behaviour of 〈τ〉, as well as the fraction 〈Nψ〉 of the population that occupies . In figure 4, we run a series of non-evolutionary simulations to plot how 〈Nψ〉 and 〈τ〉 vary as a function of J, for different values of ϕ. We show that the selection of MC (J < 0) effectively increases the average occupation 〈Nψ〉 of the nutrient disc by cells (figure 4a). On the contrary, the selection of UC (J > 0) reduces reproduction time (figure 4b). Therefore evolving MC effectively provides cells with an advantage over nutrient occupation, while the selection of UC gives cells an advantage in terms of decreased replication time. Figure 4 also shows that the range between 〈Nψ〉min and 〈Nψ〉max (figure 4a) and between 〈τ〉min and 〈τ〉max (figure 4b) decreases as ϕ increases, indicating that the impact of choosing MC over UC behaviour becomes less relevant as the size of nutrient disc increases.
Figure 4.

In (a) we plot, for different diameters, the average fraction 〈Nψ〉 of the population occupying the resource disc against the adhesion parameter J. We normalize to one the maximum value of 〈Nψ〉 for each diameter, using 〈Nψ〉 + (1 − 〈Nψ〉max). MC behaviour (J < 0) allows a better occupation of the disc. In the UC range (J > 0) 〈Nψ〉 decreases, with a steep transition for J ∼ 0. Note that the distance between 〈Nψ〉max and 〈Nψ〉min decreases as the diameter ϕ of the resource disc increases, indicating that the impact of evolving MC instead of UC behaviour becomes less relevant as ϕ increases. In the inset, we show the same effect, using as a measure the standard deviation of all the data points of each plot with fixed diameter ϕ. One last note on the normalization procedure: the non-normalized value of 〈Nψ〉max varies for each ϕ; in particular, the larger ϕ, the larger 〈Nψ〉max (see electronic supplementary material, figure S1). In (b) we show, for different diameters, the average reproduction time of cells against the adhesion parameter J. UC provides an advantage (faster reproduction) over MC. Note that for larger values of ϕ the reproduction time decreases for J < 0 (MC behaviour), indicating also here that the impact of evolving MC instead of UC behaviour becomes less relevant as the size of nutrient disc increases. In the inset, we show that the standard deviation σ among all data points of each plot with fixed ϕ becomes smaller as the size of the nutrient disc increases. The results shown in both (a) and (b) represent an average over four replicas for each value of ϕ. Even if the error bars are too small to be shown on the plot, they are substantially smaller than the differences between the values for J < 0 and J > 0 for both (a) and (b), indicating that these differences are statistically relevant.
This transition supports a scenario of evolved (simple) MC where resource scarcity might have favoured cells to stick together in order to efficiently exploit spatially localized nutrients. Within our special choice of landscape, made by a single circular patch of resources, the possibility that moving around randomly drives a cell to a low-nutrient area acts as a powerful selection for adhesion. In the next section, we will see how this works in a spatially explicit context.
3.2. Evolutionary branching
The transition from multicellular to unicellular is defined by a narrow domain where very broad fluctuations are observed. This is dramatically shown by the high standard deviations associated with 〈J〉 (figure 3a) What is happening at these domains? The observed transition pattern does not trivially map with standard phase transitions, where the presence of a divergent increase in the variance of the patterns is a common trait [44]. In standard transitions, the variance diverges due to temporal fluctuations: the average value of the quantity of relevance (the so-called order parameter) changes in time, moving between a broad range of possible values. That would mean, in our case, that the average adhesion would move repeatedly from positive to negative values and back. For the so-called critical transitions, the given average quantity (the order parameter) just widely fluctuates [45]. This is not the case here.
Interestingly, and by contrast with standard phase transition phenomena, the origin of this variance has to be found somewhere else. Here, it is explained as an evolutionary branching process (EBP) where different values of J evolve from the original zero-J state. In an EBP, frequency-dependent selection splits into two (or more) distinct phenotypic clusters [46,47]. In figure 5, we display a set of branching patterns obtained by plotting the J value of each cell present over the evolutionary experiment. For values below ϕc only one branch is obtained (figure 5a), as the entire population of cells evolve individual adhesion towards negative values (MC-only phase) with a low standard deviation associated with 〈J〉.
Figure 5.

Evolutionary branching under resource constraints. Three different examples of the evolutionary patterns displayed by the evolved adhesion model for three different resource sizes. For sub-critical ϕ only one branch is found, associated with the emergence of multicellular ensembles (i.e. evolving towards negative values of J), as exemplified in (a). For super-critical ϕ multiple branches are always found, with cells on the periphery evolving adhesion, while those within ϕ display repulsion, as exemplified in (b). Here an arms race between the two kinds of phenotype can be seen. In the critical domain (ϕ ∼ ϕc), the system can evolve indifferently towards the MC-only phase that is typical of sub-critical ϕ (a) or towards the UC–MC phase that is typical of super-critical ϕ (b). In (c) we show that, as the diameter ϕ of the nutrient disc increases, branching becomes more frequent. In particular, the first MC population rapidly becomes extinct and new branchings occur, with one population evolving towards MC behaviour (and eventually dying out) and the other population evolving towards UC.
For values around and above ϕc, on the other hand, sub-populations emerge: the majority of cells evolve their adhesion toward positive values (UC), but a minor portion of cells bifurcates from the main branch, evolving a MC sub-population (UC–MC phase). This sub-population emerges close to the external border of the nutrient disc, at the interface between nutrient and empty medium, and is eventually superseded by the prevailing UC sub-population. For ϕ ∼ ϕc, two phases (single- and two-branched patterns) will coexist, although a two-branch pattern is the typical outcome UC–MC (figure 5b). The coexistence of the two phases explains the high standard deviation associated with 〈J〉 in the ϕ ∼ ϕc area.
Once we move beyond ϕc, only multi-branched patterns are found, but in the long term, no coexistence is found between the UC and the MC branches. Instead, extinction events cyclically occur as low-adhesion sub-populations emerge and eventually decline. What is the origin of the pattern? In our case study, where asexual populations are considered, the origin of this EBP must be found in an intrinsic heterogeneity associated with the resource spatial arrangement. Here our domain defines a closed surface delimited by its boundary (the circumference of diameter ϕ). Because of the sharpness of the boundary condition, cells living within or close to the border of will experience markedly different constraints. While the former will mainly compete with neighbouring ones for available resources, those close to the boundary face a strong selection: if their J values are high, they will more easily get expelled outside the safe zone. What is then the spatial patterning associated with our evolutionary model? Seminal work on evolution of asexual populations experiencing environmental gradients [46] revealed that speciation is likely to occur. Our system is an extreme case of such a spatially heterogeneous scenario.
In order to visualize what occurs at the microscopic level, we can follow the time evolution of the spatial arrangement of cells in terms of their adhesion values. These snapshots are shown in figure 5a–c along with their time location. For the small resource case (figure 5a), all cells have very similar, negative J values and the spatial patterns are homogeneous. For the two-branch case (figure 5b), three plots of the spatial state are displayed, revealing the origin of the two different sets of phenotypes.
As we pointed out before, a distinct population of cells displaying adhesion emerges at the boundaries of the resource, achieving a stable population size. This stable branching changes when larger resource sizes are considered, as shown in the snapshots of figure 5c. Here the same previous pattern is observed at the beginning of the in silico evolution experiment (t < 6500). At this point, the cell population on decreases and becomes extinct. A new homogeneous state emerges that then evolves again into a heterogeneous population where low-adhesion rates evolve (evolving towards lower values of J, i.e. towards adhesion, although not reaching negative values) until a new extinction (and in turn a new branching) occurs. In other words, a combination between evolutionary branching and Red Queen dynamics unfolds.
The previous examples involve a very simple, geometric description of the resource landscape. What is the impact of considering a rich, heterogeneous distribution of resources? An example of this scenario is displayed in figure 6. Here a landscape of resource patches has been generated that follows a left–right gradient of decreasing size, with a (infinite radius) continuous band on the left wall to small circles on the right (figure 6a). The evolutionary experiment is run again under the same conditions as above and in this case large and small patches can interact through spatial interconnection (either directly or through cell migration; figure 6b). The result of this in silico evolutionary experiment is a multi-branching pattern (figure 6c) where new branches and extinctions occur with a long-term coexistence of multiple phenotypes (as defined by our single parameter space).
Figure 6.

Evolutionary branching in a heterogeneous resource landscape. Using a complex spatial distribution of patches (a) including both continuous (left wall), large and small patches, following a decreasing pattern, evolved populations display a whole range of adhesion values (b). The arrows indicate stable resource patches that display adhesion and persist in a stable manner despite their connection with larger patches dominated by repulsion. The evolution of diversity can be visualized as a multi-branched tree (c).
A relevant result here concerns the impact of spatial embodiment as a firewall against invasion. As shown in figure 6b, large and small patches can exchange cells, and thus invasion by cells from one large domain could in principle overcome the population evolved in the smaller one, but this is often not the case. Figure 6b provides a clear example: here two smaller domains in contact with larger ones dominated by repulsion keep their adhesive nature over evolutionary time in a stable manner. Because of the selective pressure exerted by the boundary, both types of J values coexist in time.
All the results shown in this section have been obtained in an evolutionary model where the adhesion parameter J can vary freely towards both adhesion J < 0 and repulsion J > 0, with cells actively avoiding each other in the repulsion zone. We also tested all the obtained results in a more relaxed model, where only evolution in the range (J ≤ 0) is allowed, i.e. where active repulsion cannot be selected: at J = 0 cells simply move randomly. All the results shown above were also obtained in the relaxed model, indicating that our results are robust. As an example, in the electronic supplementary material, figure S2, we show that even in a model in which active repulsion is not allowed, a marked transition between MC and UC behaviour can be observed at ϕc.
4. Discussion
In this paper, we have presented a minimal model of embodied evolution of MC resulting from a selection pressure tied to resource abundance. The model is limited to the possible paths leading to clumps of cells that get together without defining a true multicellular organism. Clumping has been previously explored using mathematical models that consider multicellular clumps as ‘public goods’ [11] that could facilitate the emergence of MC traits. Here the clumps are explicitly defined as embodied systems and we refer to them as simple MC, for which efficient exploitation of patchy resources is a main driver [7]. Specifically, we have used a simple resource description as a circular area whose linear size (the diameter ϕ) is used as a key parameter. By increasing resource size, its relative impact on cell–cell interactions is measured by means of a single, evolvable parameter, namely the adhesion coupling J, which starts from zero and can evolve to either positive or negative values. These correspond to either repulsion (cells tend to avoid each other) or adhesion (cell–cell attachment), respectively.
The model is a physics-based approach, where an energy function can be easily defined that allows definition of probabilistic rules of cell–cell exchanges. Following the standard view of statistical physics of strongly interacting systems, changes occur in the direction of minimizing energy. This kind of model provides the simplest framework to simulate their spatial dynamics [48] incorporating collective cell behaviour [36]. Additional rules include also the intake and metabolic burden of cells, along with reproduction and death that take place once given biomass thresholds are reached. It can be argued that our model is too simple to provide robust insight into the problem of evolved MC. However, it must be pointed out that simple physical models of complex systems can provide a highly accurate picture of the real problems, due to universality: the properties at one scale are not dependent on the details of the lower-scale components [49]. One consequence is that the presence of generic processes shared by both living and non-living systems might strongly limit the repertoire of possible outcomes of evolved MC complexity [19,20]. Along with agent-like features of living cells, these generic properties associated with mesoscale physics (i.e. involving a spatial range of scales ∼10−3–10−1 m) might be fundamental to understand the common evolutionary paths found in some types of MC [50].
The evolution of adhesion occurs due to the strong selection imposed by limited available local resources. When the size of the resource is small, the risk of reaching the boundary and getting out of the nutrient source makes adhesion to other cells within a desirable trait. Cohesive groups can thus allow their members to remain alive, although their potential for replication is reduced due to the limited space available. Instead, if resource limitations are reduced due to the large size of , a cell within the patch might easily replicate and find resources in the neighbourhood also in absence of strong adhesive traits. The exception is of course given by those locations close to the boundaries: in that area, movement can drive cells outside of the safety of and there is thus an increased pressure for avoiding movement. As occurs with previous models of speciation of asexual populations in heterogeneous landscapes, heterogeneity is a driver of diversity, which allows the coexistence of both MC and UC for large (i.e. when ϕ > ϕc). Our model provides a new illustration of this phenomenon under an embodied, physical picture.
Our results have been obtained by means of the simplest formal approximation. We have not taken into account relevant features of cells, such as shape, that can be captured by extended models of spin interactions where each cell is defined not by a single unit but by multiple, interconnected sites [36,51,52]. Similarly, our MC aggregates are formless, by contrast with known evolved systems such as snowflake yeast, where complex branching can occur [8]. Extended models with more sophisticated cell–cell interactions (including for example polarity) could be defined using extended hybrid models [32].
We have also limited the internal description of cells to a basic set of variables that encapsulate metabolism and cell cycle, ignoring in particular the potential role played by diffusion across cell–cell channels as a trigger for MC cooperation [2]. Importantly, we have considered a constrained set of conditions regarding the nature of the resources. In our model, these are rather static entities, when a more realistic framework could consider them changing in time. One obvious scenario would be resources that appear and become exhausted in a time-dependent fashion. Such time-dependent changes would incorporate extra sources of uncertainty that might well trigger the selection of other MC strategies while exploring the impact of disturbance regimes on phenotypic diversity [53]. Additionally, our mesoscale physics framework can help expand in silico models of adaptive radiation in digital communities [54] by incorporating MC interactions.
Future work should consider all these possible refinements and extensions of our model, as well as the introduction of additional features, such as the presence of genetic control mechanisms that could allow the evolution of additional relevant properties, including life cycles, responses to stress or interactions with a diverse range of (negative and positive) external clues and cell differentiation [55,56]. Similarly, our description lacks any gene network organization where different functionalities beyond adhesion could be included and would allow modelling the problem from the unicellular perspective [57,58]. Finally, the simple approach taken here can inspire further work involving synthetic biology, where engineering multicellular traits has been a major research target [6,59,60] and can provide valuable insights into its early evolutionary origins [61].
Acknowledgements
The authors thank the Complex Systems Lab members for fruitful discussions.
Contributor Information
Adriano Bonforti, Email: adriano.bonforti@upf.edu.
Ricard Solé, Email: ricard.sole@upf.edu.
Data accessibility
This article has no additional data.
Authors' contributions
R.S.: conceptualization, formal analysis, investigation, methodology, supervision, writing—original draft, writing—review and editing; A.B.: conceptualization, investigation, methodology, writing—review and editing.
All authors gave final approval for publication and agreed to be held accountable for the work performed therein.
Conflict of interest declaration
We declare we have no competing interests.
Funding
This work has been supported by the Spanish Ministry of Economy and Competitiveness, grant no. PID2019-111680GB-I00, an AGAUR FI 2018 grant and the Santa Fe Institute.
References
- 1.Grosberg RK, Strathmann RR. 2007. The evolution of multicellularity: a minor major transition? Annu. Rev. Ecol. Evol. Syst. 38, 621-654. ( 10.1146/annurev.ecolsys.36.102403.114735) [DOI] [Google Scholar]
- 2.Knoll AH. 2011. The multiple origins of complex multicellularity. Annu. Rev. Earth Planet. Sci. 39, 217-239. ( 10.1146/annurev.earth.031208.100209) [DOI] [Google Scholar]
- 3.Ruiz-Trillo I, Nedelcu AM (eds). 2015. Evolutionary transitions to multicellular life: principles and mechanisms, vol. 2. Berlin, Germany: Springer. [Google Scholar]
- 4.Bonner JT. 2001. First signals: the evolution of multicellular development. Princeton, NJ: Princeton University Press. [Google Scholar]
- 5.Ratcliff WC, Denison RF, Borrello M, Travisano M. 2012. Experimental evolution of multicellularity. Proc. Natl Acad. Sci. USA 109, 1595-1600. ( 10.1073/pnas.1115323109) [DOI] [PMC free article] [PubMed] [Google Scholar]
- 6.Solé R, Ollé-Vila A, Vidiella B, Duran-Nebreda S, Conde-Pueyo N. 2018. The road to synthetic multicellularity. Curr. Opt. Syst. Biol. 7, 60-67. ( 10.1016/j.coisb.2017.11.007) [DOI] [Google Scholar]
- 7.Tong K, Bozdag GO, Ratcliff WC. 2022. Selective drivers of simple multicellularity. Curr. Opin. Microb. 67, 102141. ( 10.1016/j.mib.2022.102141) [DOI] [PubMed] [Google Scholar]
- 8.Libby E, Ratcliff WC, Travisano M, Kerr B. 2014. Geometry shapes evolution of early multicellularity. PLoS Comput. Biol. 10, e1003803. ( 10.1371/journal.pcbi.1003803) [DOI] [PMC free article] [PubMed] [Google Scholar]
- 9.Libby E, Ratcliff WC. 2014. Ratcheting the evolution of multicellularity. Science 346, 426-427. ( 10.1126/science.1262053) [DOI] [PubMed] [Google Scholar]
- 10.Queller DC. 2000. Relatedness and the fraternal major transitions. Phil. Trans. R. Soc. Lond. B 355, 1647-1655. ( 10.1098/rstb.2000.0727) [DOI] [PMC free article] [PubMed] [Google Scholar]
- 11.Biernaskie JM, West SA. 2015. Cooperation, clumping and the evolution of multicellularity. Proc. R. Soc. B 282, 20151075. ( 10.1098/rspb.2015.1075) [DOI] [PMC free article] [PubMed] [Google Scholar]
- 12.Pentz JT, Marquez-Zacarias P, Bozdag GO, Burnetti A, Yunker PJ, Libby E, Ratcliff WC, 2020. Ecological advantages and evolutionary limitations of aggregative multicellular development. Curr. Biol. 30, 4155-4164. ( 10.1016/j.cub.2020.08.006) [DOI] [PubMed] [Google Scholar]
- 13.Tarnita CE, Taubes CH, Nowak MA. 2013. Evolutionary construction by staying together and coming together. J. Theor. Biol. 320, 10-22. ( 10.1016/j.jtbi.2012.11.022) [DOI] [PubMed] [Google Scholar]
- 14.Shapiro L, Weis WI. 2009. Structure and biochemistry of cadherins and catenins. Cold Spring Harb. Perspect. Biol. 1, a003053. ( 10.1101/cshperspect.a003053) [DOI] [PMC free article] [PubMed] [Google Scholar]
- 15.Takeichi M. 1988. The cadherins: cell-cell adhesion molecules controlling animal morphogenesis. Development 102, 639-655. ( 10.1242/dev.102.4.639) [DOI] [PubMed] [Google Scholar]
- 16.Bongrand P. 2018. Physical basis of cell-cell adhesion. Boca Raton, FL: CRC Press. [Google Scholar]
- 17.Forgacs G, Newman SA. 2005. Biological physics of the developing embryo. Cambridge, UK: Cambridge University Press. [Google Scholar]
- 18.Duguay D, Foty RA, Steinberg MS. 2003. Cadherin-mediated cell adhesion and tissue segregation: qualitative and quantitative determinants. Dev. Biol. 253, 309-323. ( 10.1016/S0012-1606(02)00016-7) [DOI] [PubMed] [Google Scholar]
- 19.Newman S, Comper WD. 1990. ‘Generic’ physical mechanisms of morphogenesis and pattern formation. Development 110, 1-18. ( 10.1242/dev.110.1.1) [DOI] [PubMed] [Google Scholar]
- 20.Newman SA, Bhat R. 2008. Dynamical patterning modules: physico-genetic determinants of morphological development and evolution. Phys. Biol. 5, 015008. ( 10.1088/1478-3975/5/1/015008) [DOI] [PubMed] [Google Scholar]
- 21.Newman SA, Forgacs G, Müller GB. 2006. Before programs: the physical origination of multicellular forms. Int. J. Dev. Biol. 50, 289-299. ( 10.1387/ijdb.052049sn) [DOI] [PubMed] [Google Scholar]
- 22.Kadanoff LP. 2000. Statistical physics: statics, dynamics and renormalization. Singapore: World Scientific. [Google Scholar]
- 23.Duran-Nebreda S, Bonforti A, Montanez R, Valverde S, Solé R. 2016. Emergence of proto-organisms from bistable stochastic differentiation and adhesion. J. R. Soc. Interface 13, 20160108. ( 10.1098/rsif.2016.0108) [DOI] [PMC free article] [PubMed] [Google Scholar]
- 24.Rainey PB, Travisano M. 1998. Adaptive radiation in a heterogeneous environment. Nature 394, 69-72. ( 10.1038/27900) [DOI] [PubMed] [Google Scholar]
- 25.Travisano M, Rainey PB. 2000. Studies of adaptive radiation using model microbial systems. Am. Nat. 156, S35-S44. ( 10.1086/303414) [DOI] [PubMed] [Google Scholar]
- 26.Rebolleda-Gómez M, Travisano M. 2018. The cost of being big: local competition, importance of dispersal, and experimental evolution of reversal to unicellularity. Am. Nat. 192, 731-744. ( 10.1086/700095) [DOI] [PubMed] [Google Scholar]
- 27.Rebolleda-Gómez M, Travisano M. 2019. Adaptation, chance, and history in experimental evolution reversals to unicellularity. Evolution 73, 73-83. ( 10.1111/evo.13654) [DOI] [PMC free article] [PubMed] [Google Scholar]
- 28.Rejniak KA, Anderson AR. 2011. Hybrid models of tumor growth. Wiley Interdiscip. Rev. Syst. Biol. Med. 3, 115-125. ( 10.1002/wsbm.102) [DOI] [PMC free article] [PubMed] [Google Scholar]
- 29.Kessler DA, Levine H. 1993. Pattern formation in Dictyostelium via the dynamics of cooperative biological entities. Phys. Rev. E 48, 4801-4804. ( 10.1103/PhysRevE.48.4801) [DOI] [PubMed] [Google Scholar]
- 30.Marée AF, Hogeweg P. 2001. How amoeboids self-organize into a fruiting body: multicellular coordination in Dictyostelium discoideum. Proc. Natl Acad. Sci. USA 98, 3879-3883. ( 10.1073/pnas.061535198) [DOI] [PMC free article] [PubMed] [Google Scholar]
- 31.Bonforti A, Duran-Nebreda S, Montanez R, Solé R. 2016. Spatial self-organization in hybrid models of multicellular adhesion. Chaos 26, 103113. ( 10.1063/1.4965992) [DOI] [PubMed] [Google Scholar]
- 32.Duran-Nebreda S, Solé R. 2015. Emergence of multicellularity in a model of cell growth, death and aggregation under size-dependent selection. J. R. Soc. Interface 12, 20140982. ( 10.1098/rsif.2014.0982) [DOI] [PMC free article] [PubMed] [Google Scholar]
- 33.Byrne H, Drasdo D. 2009. Individual-based and continuum models of growing cell populations: a comparison. J. Math. Biol. 58, 657-687. ( 10.1007/s00285-008-0212-0) [DOI] [PubMed] [Google Scholar]
- 34.Steinberg MS. 2007. Differential adhesion in morphogenesis: a modern view. Curr. Opin. Genet. Dev. 17, 281-286. ( 10.1016/j.gde.2007.05.002) [DOI] [PubMed] [Google Scholar]
- 35.Steinberg MS. 1975. Adhesion-guided multicellular assembly: a commentary upon the postulates, real and imagined, of the differential adhesion hypothesis, with special attention to computer simulations of cell sorting. J. Theor. Biol. 55, 431-432. ( 10.1016/S0022-5193(75)80091-9) [DOI] [PubMed] [Google Scholar]
- 36.Graner F, Glazier JA. 1992. Simulation of biological cell sorting using a two-dimensional extended Potts model. Phys. Rev. Lett. 69, 2013-2016. ( 10.1103/PhysRevLett.69.2013) [DOI] [PubMed] [Google Scholar]
- 37.Mora Van Cauwelaert E, Arias Del Angel JA, Benitez M, Azpeitia EM. 2015. Development of cell differentiation in the transition to multicellularity: a dynamical modeling approach. Front. Microbiol. 6, 603. ( 10.3389/fmicb.2015.00603) [DOI] [PMC free article] [PubMed] [Google Scholar]
- 38.Deutsch A, Dormann S. 2005. Mathematical modeling of biological pattern formation. Boston, MA: Birkhäuser. [Google Scholar]
- 39.Foty RA, Steinberg MS. 2005. The differential adhesion hypothesis: a direct evaluation. Dev. Biol. 278, 255-263. ( 10.1016/j.ydbio.2004.11.012) [DOI] [PubMed] [Google Scholar]
- 40.Landau D, Binder K. 2021. A guide to Monte Carlo simulations in statistical physics. Cambridge, UK: Cambridge University Press. [Google Scholar]
- 41.Metropolis N, Rosenbluth AW, Rosenbluth MN, Teller AH, Teller E. 1953. Equation of state calculations by fast computing machines. J. Chem. Phys. 21, 1087-1092. ( 10.1063/1.1699114) [DOI] [Google Scholar]
- 42.Dieckmann U, Law R, Metz H (eds). 2000. The geometry of ecological interactions: simplifying spatial complexity. Cambridge, UK: Cambridge University Press. [Google Scholar]
- 43.Keating MT, Bonner JT. 1977. Negative chemotaxis in cellular slime molds. J. Bacteriol. 130, 144-147. ( 10.1128/jb.130.1.144-147.1977) [DOI] [PMC free article] [PubMed] [Google Scholar]
- 44.Solé R. 2011. Phase transitions. Princeton, NJ: Princeton University Press. [Google Scholar]
- 45.Sethna JP. 2006. Crackling noise and avalanches: scaling, critical phenomena, and the renormalization group. (https://arxiv.org/abs/cond-mat/0612418)
- 46.Doebeli M, Dieckmann U. 2000. Evolutionary branching and sympatric speciation caused by different types of ecological interactions. Am. Nat. 156, S77-S101. ( 10.1086/303417) [DOI] [PubMed] [Google Scholar]
- 47.Geritz SA, Metz JA, Kisdi E, Meszena G. 1997. Dynamics of adaptation and evolutionary branching. Phys. Rev. Lett. 78, 2024-2027. ( 10.1103/PhysRevLett.78.2024) [DOI] [Google Scholar]
- 48.Goldenfeld N. 2018. Lectures on phase transitions and the renormalization group. Boca Raton, FL: CRC Press. [Google Scholar]
- 49.Solé RV, Goodwin BC. 2000. Signs of life: how complexity pervades biology. New York, NY: Basic Books. [Google Scholar]
- 50.Arias Del Angel JA, Nanjundiah V, Benitez M, Newman SA. 2020. Interplay of mesoscale physics and agent-like behaviors in the parallel evolution of aggregative multicellularity. EvoDevo 11, 1-18. ( 10.1186/s13227-020-00165-8) [DOI] [PMC free article] [PubMed] [Google Scholar]
- 51.Glazier JA, Graner F. 1993. Simulation of the differential adhesion driven rearrangement of biological cells. Phys. Rev. E 47, 2128-2154. ( 10.1103/PhysRevE.47.2128) [DOI] [PubMed] [Google Scholar]
- 52.Savill NJ, Hogeweg P. 1997. Modelling morphogenesis: from single cells to crawling slugs. J. Theor. Biol. 184, 229-235. ( 10.1006/jtbi.1996.0237) [DOI] [PubMed] [Google Scholar]
- 53.Buckling A, Kassen R, Bell G, Rainey PB. 2000. Disturbance and diversity in experimental microcosms. Nature 408, 961-964. ( 10.1038/35050080) [DOI] [PubMed] [Google Scholar]
- 54.Chow SS, Wilke CO, Ofria C, Lenski RE, Adami C. 2004. Adaptive radiation from resource competition in digital organisms. Science 305, 84-86. ( 10.1126/science.1096307) [DOI] [PubMed] [Google Scholar]
- 55.Hogeweg P. 2000. Evolving mechanisms of morphogenesis: on the interplay between differential adhesion and cell differentiation. J. Theor. Biol. 203, 317-333. ( 10.1006/jtbi.2000.1087) [DOI] [PubMed] [Google Scholar]
- 56.Márquez-Zacarías P, Pineau RM, Gomez M, Veliz-Cuba A, Murrugarra D, Ratcliff WC, Niklas KJ. 2021. Evolution of cellular differentiation: from hypotheses to models. Trends Ecol. Evol. 36, 49-60. ( 10.1016/j.tree.2020.07.013) [DOI] [PubMed] [Google Scholar]
- 57.Sebé-Pedros A, Degnan BM, Ruiz-Trillo I. 2017. The origin of Metazoa: a unicellular perspective. Nat. Rev. Genet. 18, 498-512. ( 10.1038/nrg.2017.21) [DOI] [PubMed] [Google Scholar]
- 58.Sebé-Pedros A, et al. 2018. Early metazoan cell type diversity and the evolution of multicellular gene regulation. Nat. Ecol. Evol. 2, 1176-1188. ( 10.1038/s41559-018-0575-6) [DOI] [PMC free article] [PubMed] [Google Scholar]
- 59.Chuang JS. 2012. Engineering multicellular traits in synthetic microbial populations. Curr. Opin. Chem. Biol. 16, 370-378. ( 10.1016/j.cbpa.2012.04.002) [DOI] [PubMed] [Google Scholar]
- 60.Escalante AE, Rebolleda-Gomez M, Benitez M, Travisano M. 2015. Ecological perspectives on synthetic biology: insights from microbial population biology. Front. Microbiol. 6, 143. ( 10.3389/fmicb.2015.00143) [DOI] [PMC free article] [PubMed] [Google Scholar]
- 61.Solé R. 2016. Synthetic transitions: towards a new synthesis. Phil. Trans. R. Soc. B 371, 20150438. ( 10.1098/rstb.2015.0438) [DOI] [PMC free article] [PubMed] [Google Scholar]
Associated Data
This section collects any data citations, data availability statements, or supplementary materials included in this article.
Data Availability Statement
This article has no additional data.