

Abstract
Introduction
The Alzheimer's Disease Neuroimaging Initiative (ADNI) has accumulated 15 years of clinical, neuroimaging, cognitive, biofluid biomarker and genetic data, and biofluid samples available to researchers, resulting in more than 3500 publications. This review covers studies from 2018 to 2020.
Methods
We identified 1442 publications using ADNI data by conventional search methods and selected impactful studies for inclusion.
Results
Disease progression studies supported pivotal roles for regional amyloid beta (Aβ) and tau deposition, and identified underlying genetic contributions to Alzheimer's disease (AD). Vascular disease, immune response, inflammation, resilience, and sex modulated disease course. Biologically coherent subgroups were identified at all clinical stages. Practical algorithms and methodological changes improved determination of Aβ status. Plasma Aβ, phosphorylated tau181, and neurofilament light were promising noninvasive biomarkers. Prognostic and diagnostic models were externally validated in ADNI but studies are limited by lack of ethnocultural cohort diversity.
Discussion
ADNI has had a profound impact in improving clinical trials for AD.
Keywords: Alzheimer's disease, amyloid, AV1541 tau positron emission tomography, disease progression, mild cognitive impairment, plasma biomarker, tau
1. INTRODUCTION
Currently in its 17th year and fourth phase, Alzheimer's Disease Neuroimaging Initiative (ADNI) 1 , 2 continues in its quest to increase understanding of Alzheimer's disease (AD) pathology and improve clinical trials for AD‐modifying or ‐preventive treatments by leveraging its now expansive set of data and samples, which are made available to researchers worldwide. This review updates previous works 3 , 4 , 5 , 6 detailing all the publications arising from ADNI data and samples until the end of 2017. Here, we provide a full listing of all publications and discuss key studies published from 2018 to 2020 with the goal of exploring how ADNI has contributed to our understanding of disease progression in AD and how this knowledge can be translated into successful clinical trials, leading to approved treatments which slow the progression of, and ultimately prevent the development of, AD.
The well‐documented struggles of clinical trials to demonstrate significant cognitive benefits of disease‐modifying therapies targeting amyloid beta (Aβ) 7 , 8 despite the substantial body of evidence supporting its toxic role emphasize several major problems. Which species of Aβ (e.g., fibrils, oligomers) is the appropriate target? Is tau responsible for symptom progression? Which species of tau is the appropriate target for treatment? What other pathologies contribute to symptom progression? Which population (dementia, mild cognitive impairment [MCI], cognitively unimpaired [CU]) is most likely benefit to from treatment? Which biomarkers best detect AD pathology and monitor progression? 9 ADNI is uniquely positioned as a resource to examine these issues given the depth and breadth of its data and the availability of its samples.
Since its inception in 2004, ADNI participants have been followed for up to 15 years, providing crucial longitudinal data to aid in understanding progression for a disease in which pathology is now thought to arise decades before the onset of clinical symptoms. 10 The most recent 5‐year phase of ADNI, ADNI3, 2 is nearing its completion. In addition to the continuity of established biomarkers, ADNI has collected longitudinal positron emission tomography (PET) using the AV1451 (Flortaucipir) tau radiotracer (tau PET) that has allowed examination of disease progression from different perspectives. A lipidomics 11 data set and a bile acid targeted data set 12 have been generated from ADNI samples in collaboration with the Alzheimer's Disease Metabolomics Consortium, led by collaborator Rima Kaddurah‐Daouk of Duke University, in an effort to monitor molecular alterations that occur throughout disease progression and to better understand the complex and multifactorial etiology of AD.
ADNI is unique in several respects. First, ADNI participants are followed longitudinally with blood sampling and plasma banking, clinical evaluation, neuropsychological evaluation, genetics, lumbar puncture for cerebrospinal fluid (CSF; Aβ and tau), magnetic resonance imaging (MRI), fluorodeoxyglucose (FDG) PET, Aβ PET, tau PET, and at‐home digital cognitive testing, and participants are followed for autopsy (further details at: http://adni.loni.usc.edu/study‐design/). Second, all ADNI data are available on http://adni.loni.usc.edu/data‐samples/access‐data/ without embargo. Third, ADNI biospecimens including samples of CSF, blood, urine, and brain tissue are available to researchers.
The impact of ADNI's data‐ and sample‐sharing policies cannot be overstated. Unrestricted sharing of research data has been unequivocally demonstrated to drive science progress, 13 and as an early adopter of this strategy, ADNI has had a particularly outsize influence. There have been more than 140 million downloads of ADNI data by researchers worldwide, and > 30,000 samples have been shared. These have resulted in more than 3500 publications in which ADNI is used as a primary data set, as a cohort in the external validation of developed models, as a control cohort, or in genetic studies requiring large sample sizes. The cumulative impact of this body of work is reflected in a calculated h‐index of 123 with ADNI publications garnering an average of almost 30 citations for a total of more than 75,000. In comparison to National Institutes of Health (NIH)‐funded studies in the same field, ADNI publications from the breadth of PubMed have a mean relative citation ratio (RCR) 14 of 2.22, a median RCR of 1.20, and a weighted RCR of 6065 (calculated May 16, 2021). The RCR metric is indexed against the expected influence of an NIH‐funded study (RCR of 1) and has been demonstrated to identify works of differential influence and to correlate with opinions of subject experts. 14 These numbers therefore suggest a scientific impact of ≈twice that of the average NIH‐funded study and are comparable to those of other large, longitudinal studies on aging such as the Health and Retirement Study. 15 The median RCR score of ADNI publications is also comparable to that of the ≈3500 publications arising from the long‐running Framingham Heart Study (FHS), 16 started in 1948 (1.36 vs. 1.20 for ADNI). The highest impact ADNI publication 17 has an RCR of 91.13, and 39 ADNI publications are in the 99th or above percentile of influence with RCRs of > 13.4. It should be noted that ADNI has also provided convenient data sets to test primarily image processing methodologies in computer science and engineering studies that are not captured by the PubMed system. In this way, ADNI has become an integral part of AD research across the globe.
RESEARCH IN CONTEXT
Systematic Review: The authors identified 1442 journal publications using Alzheimer's Disease Neuroimaging Initiative (ADNI) data from 2018 to July 2020 using standard search methods (PubMed, Google Scholar, Web of Science).
Interpretation: ADNI studies have contributed to a greater understanding of the factors influencing Alzheimer's disease (AD) progression, including the role of amyloid and tau (from tau positron emission tomography [PET]), and the contributions of resilience, cerebrovascular disease, sex, and immune response. ADNI studies have applied this knowledge to improving diagnosis and prognosis, developing blood biomarkers, and making other improvements to clinical trials for AD. However, results may not be generalizable due to limited cohort diversity.
Future Directions: The next 5‐year phase of ADNI (ADNI4) will enroll more minorities and less‐educated individuals to ensure generalizability of prognostic and diagnostic methods and disease progression studies. High sensitivity assays of plasma phosphorylated tau (ptau)217 and ptau181 will allow further investigation of AD blood biomarkers. ADNI will continue to impact improvements to AD clinical trials.
This review initially examines how recent ADNI publications have contributed to our understanding of disease progression. We consider the extent to which Aβ, tau, and neurodegeneration can predict disease course, and conversely, we also consider the limitations of these canonical AD neuropathologic features before examining the influence of factors beyond established AD pathology. Subsequent sections describe approaches to determining Aβ status; the exciting and rapidly developing field of blood biomarkers for AD; and finally, improvements to clinical trials. We have taken an integrated approach to topics, including evidence from a variety of fields that reflects their growing interdependence. A reader's guide to the review structure summarizing its main points is presented in Table 1. This review focuses exclusively on ADNI publications and does not attempt a comprehensive review of the field. A full list of the 1442 ADNI publications from 2018 to 2020 can be found in the supporting information. All ADNI publications are searchable at http://adni.loni.usc.edu.
TABLE 1.
Reader's guide
| 1. INTRODUCTION | From 2018 to 2020, ADNI data were used in 1442 publications. We have selected key studies to examine their contribution to our understanding of disease progression and how these aid in fulfilling the overarching goal of ADNI, the validation of biomarkers for AD clinical trials. | |
| 2. STUDIES OF DISEASE PROGRESSION | 2.1. Data‐driven models of disease progression | Models constructed using multimodal data largely recapitulate the theorized ordering of biomarkers but also highlight temporal and spatial heterogeneity in disease course. |
| 2.2. Aβ in disease progression | Subthreshold Aβ accumulation is linked to subtle cognitive deficits in memory. Staging of CU individuals by sequential regional Aβ accumulation predicted memory decline and is associated with CSF biomarkers and the APOE ε4 allele. Recent ADNI studies have identified some of the genetic architecture underlying Aβ accumulation. | |
| 2.3. Tau deposition in disease progression | Tau PET studies suggest that regional tau accumulation is dependent on antecedent Aβ deposition and leads to regional atrophy. Genetic factors beyond those associated with Aβ underlie tau deposition and subsequent neurodegeneration. | |
| 2.4. AT(N) biological classification of AD | Different sequences of AT(N) biomarker abnormality have been identified such as tau preceding Aβ. The use of binary cut‐points for AT(N) biomarkers may be insufficient to capture progression. Biomarkers of neurodegeneration are poorly correlated. Additional biomarkers including plasma markers may improve patient staging. | |
| 3. BEYOND AT(N): OTHER INFLUENCES ON DISEASE PROGRESSION | 3.1. Heterogeneity | Multiple different approaches have identified subtypes of AD. Common subgroups are “normal” or “healthy,” “typical AD” and a faster declining group with executive function deficits and posterior cortical atrophy. Increasing evidence supports their biological and clinical relevance. |
| 3.2. Cerebrovascular disease | Vascular risk factors have a detrimental effect on neurodegeneration and cognitive decline. Recent ADNI studies support multiple mechanisms of action: directly, via Aβ or tau or both, mediated by APOE ε4, or by a combination of these. | |
| 3.3. Immune response | Involvement of microglial associated innate immune response in modulating AD risk has been implicated by genetics, fluid biomarker, and other approaches using ADNI data. Levels of soluble TREM2, a microglial transmembrane receptor (gene product of AD risk allele TREM2), may attenuate the detrimental effect of the APOE ε4 allele, and act only after Aβ and tau pathology appear. | |
| 3.4. The role of resilience | AD pathology‐dependent cognitive resilience acts to preserve cognitive abilities. Rapid decline may occur once pathology “outpaces” resilience. Resilience may be biologically based on components of the vascular, lipid–metabolic, and immune system. Mechanisms may be sex dependent. | |
| 3.5. Sex effects in AD | Biological sex influences AD progression and may be attributed to differences in genetics, hormones, environment, or resilience. Greater susceptibility to AD in women may be due to the greater vulnerability to tau deposition in temporal regions resulting in differences in tau network structure. Female specific reserve may counteract the increased vulnerability. | |
| 4. TESTS FOR AD | 4.1. Improvements to the measurement of Aβ | The Centiloid method may overcome inconsistencies between CSF Aβ42 and Aβ PET measures. Optimization of the Roche ElecSys platform improved reliability of CSF measures. Other low cost and/or noninvasive methods for determining Aβ status masks circumvent the need for CSF or PET and lower clinical trial costs. |
| 4.2. Low cost and/or noninvasive approaches for the determination of Aβ status | ADNI studies have validated low cost and/or noninvasive Aβ screening approaches which include practical algorithms based on clinical information or using MRI scans collected in routine screening. These may lower screening and clinical trial enrollment costs. | |
| 4.3. Blood tests for AD | ADNI has contributed to the acceleration of research into plasma assays for AD. While plasma Aβ shows promise for replacing costlier/more invasive PET or CSF tests, plasma ptau predicts Aβ deposition, tau accumulation, atrophy, and diagnostic progression. Blood tests for other markers of neurodegeneration such as NfL show promise as markers of neuronal injury. Other blood factors have been investigated for their predictive ability. | |
| 5. IMPROVING CLINICAL TRIALS AND CLINICAL PRACTICE | 5.1. Clinical trials of prodromal AD | Improvements to clinical trials of prodromal AD participants include broadening selection criteria in accordance with AT(N) staging, better predicting the time frame of progression to AD, and accounting for treatment effects. |
| 5.2. Clinical trials of preclinical AD | A stochastic model of a clinical trial of CU participants provided guidance for clinical trial design. Subject selection based on subthreshold regional cortical Aβ accumulation may improve trial power. Alternatively, subtle subjective and objective cognitive changes may be used for subject selection. Tau PET may be an effective surrogate outcome measure with appropriate subject selection using Aβ Centiloid measures. | |
| 5.3. Assessing an individual's risk of progression | The ability to predict an individual's risk of decline in the clinic is fundamental to implementing personalized medicine. Models using multimodal data have been operationalized into practical tools to aid the clinician. | |
| 5.4. Automated diagnosis and prognosis | Machine learning approaches to diagnosis and prognosis have continued to develop rapidly. Some algorithms have undergone extensive validation in ADNI and other cohorts to ensure generalizability. These may aid clinicians in diagnosis, and can rely on readily available, non‐imaging data, or MRI data if available. Several multimodal classifiers predict progression with high accuracy. | |
| 6. ADDRESSING ETHNOCULTURAL DIFFERENCES IN AD | Results of ADNI studies may not be generalizable due to the lack of ethnocultural diversity in its cohort. Several ADNI studies have highlighted differences in APOE regulation and effects based on ancestral background. ADNI plans to enroll a more diverse cohort in the future. | |
| 7. CONCLUSIONS | Recent ADNI studies have supported the central role of Aβ and tau in disease progression and highlighted a number of contributing factors that affect disease trajectory. Methodological improvements such as blood tests may revolutionize screening. Improved participant selection may increase clinical trial power. However, as the ADNI cohort lacks ethnocultural and other diversity, results are not necessarily generalizable to other populations. Future enrollment aims to address this shortcoming. | |
Abbreviations: AD, Alzheimer's Disease; ADNI, Alzheimer's Disease Neuroimaging Initiative; APOE, apolipoprotein E; CSF, cerebrospinal fluid; CU, cognitively unimpaired; MRI, magnetic resonance imaging; NfL, neurofilament light; PET, positron emission tomography;.
2. STUDIES OF DISEASE PROGRESSION
2.1. Data‐driven models of disease progression
Understanding the sequence of biomarker changes in the continuum of AD progression is of increasing importance. Since 2017, ADNI data have been used to validate previously published models in different cohorts, and to develop new models based on the expanded set of biomarkers, or which consider continuous instead of dichotomous biomarkers. These widely support the Jack et al. model for the ordering of biomarkers 18 but also highlight heterogeneity in disease course, which at times challenges assumptions underlying the Aβ cascade hypothesis. 19 , 20 A model that jointly considered longitudinal changes in Aβ PET and tau PET in Aβ+ ADNI individuals estimated the temporal and spatial ordering of Aβ and tau lesions. The earliest sites of Aβ deposition were identified as the posterior cingulate cortex and precuneus in which Aβ PET uptake increased first, becoming abnormal between 10 and 5 years before symptom onset. These regions of Aβ PET uptake were followed by frontal lobe and several parietal lobe regions of interest (ROIs; Figure S1 in supporting information). Examination of CU participants who had not yet passed the threshold for Aβ positivity identified the banks of the superior temporal sulcus as an even earlier site of Aβ accumulation, occurring prior to accumulation in the posterior cingulate cortex and precuneus. 21 Regional tau deposition was observed initially in the amygdala, inferior temporal lobe, and banks of the superior temporal sulcus, with deposition in the entorhinal cortex accelerating to become prominent 5 years before dementia diagnosis (Figure S1). A probabilistic Markov model 10 estimated the expected time to reach different diagnostic states using 27 cognitive tests, and fluid (CSF and plasma) and imaging (FDG, PET, and MRI) biomarkers in individuals across the depth and breadth of ADNI. Although individual measures were highly variable and insufficient for clinical diagnosis, average trajectories suggested that early changes in memory and levels of CSF Aβ42 could occur > 25 years before dementia onset. This and other recent models of disease progression based on ADNI data (Table S1 in supporting information) widely support the ordering of biomarkers proposed by Jack et al. 18 , 22
The use of a wider range of longitudinal multimodal data incorporated as continuous rather than dichotomous variables based on binary definition of abnormality identified heterogeneous paths of disease progression. 23 The study, which used hidden Markov models to align participants’ trajectories and estimate disease progression, identified 12 disease stages in which CU individuals were largely positioned in stages 1 to 4, AD individuals in stages 10 to 12, and individuals with MCI spread between. Individuals frequently skipped stages in their progression to AD. Two prominent and distinct paths with little interchange were identified in MCI and AD: path A, going through stages 8 →10 → 12 and characterized by greater neurodegeneration with lower levels of AD pathology, or path B, going through stages 9→11→12 and characterized by relatively greater Aβ burden for the degree of cognitive impairment (Figure S2 in supporting information). Compared to individuals on path A, individuals on path B were younger, had a higher frequency of the apolipoprotein E (APOE) ε4 allele, and had a faster transition to AD. A novel approach to uncovering underlying molecular mechanisms of neuropathology used unsupervised machine learning to infer longitudinal gene expression trajectories from cross‐sectional gene expression data sets. 24 The molecular disease score generated from the Religious Orders Study‐Rush Memory and Aging Project (ROS‐MAP) autopsy cohort and from ADNI blood samples was therefore independent of phenotypic variables yet still predicted pathological evolution and was associated with diagnosis, clinical progression, executive function, and memory performance. Molecular pathways important for pathological progression largely overlapped between blood and brain, and included common pathways associated with neurodegeneration such as axon guidance and apoptosis. Additionally, this analysis highlighted the key contributions of immune system response and vascular structure and functioning. The use of gene expression data in this manner may aid in understanding molecular mechanisms underlying neurodegenerative heterogeneity.
The accumulation of neurofibrillary tangles in the sequential spatiotemporal pattern described by the Braak stages has led to the development of hypotheses positing the prion‐like misfolding, aggregation, and propagation of pathological tau species cell to cell through anatomical connections. 25 , 26 ADNI longitudinal tau PET data were instrumental in two studies investigating these hypotheses. The first 27 tested the hypothesis that the pathological tau propagated preferentially along functionally strong and spatially short connections using resting state functional MRI (rs‐fMRI) to assess interregional connectivity. Aβ+ CU individuals had increased baseline and longitudinal tau PET uptake in temporoparietal and frontal regions, corresponding to regions with higher functional connectivity, compared to CU Aβ– participants. Seed ROIs with higher tau accumulation rates were associated with tau PET changes in regions with higher functional connectivity (Figure 1a). A model based on baseline tau, functional connectivity, and the spatial remoteness of connections predicted longitudinal tau spread at both group and individual levels better than models based on baseline tau and functional connectivity or distance alone (Figure 1b‐j). This demonstration that such stronger and closer functional connections predicted greater change in tau binding is consistent with transneuronal tau propagation. A second study 28 investigated propagation of pathological tau from different seed regions based on an epidemic spreading model. 29 The seeding of this model in the entorhinal cortex explained the greatest proportion of tau spread (70% of group and 51% of average individual tau spread) and was consistent with autopsy findings. The use of a structural connectome assessed by diffusion tensor imaging (DTI) tractography predicted the observed pattern of tau spreading better than a functional network assessed by rs‐fMRI (Figure S3 in supporting information), even in normal aging (CU Aβ– individuals with low overall tau burden). Regions with greater than predicted tau accumulation had greater Aβ burden, but antecedent Aβ deposition could not fully explain the observed pattern of tau PET, suggesting that although regional Aβ may accelerate the spread of tau tangles, tau spread may be influenced by other factors or be self‐perpetuating. 25 , 26
FIGURE 1.
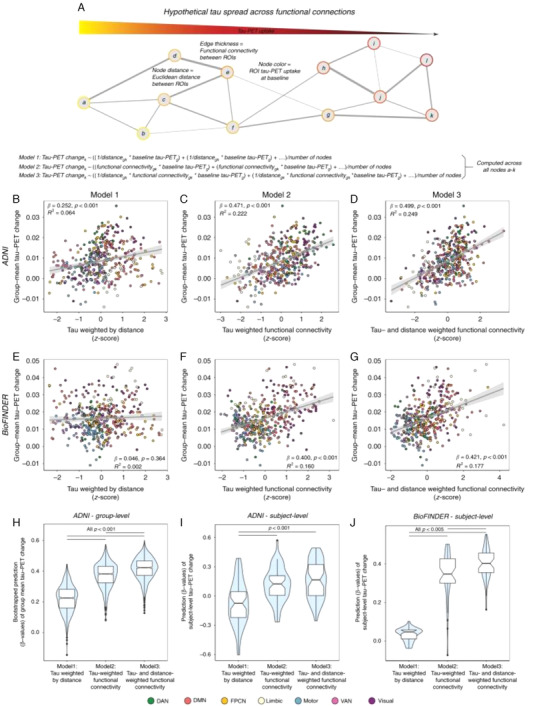
Prediction of longitudinal tau‐PET change. A, Hypothetical network spreading model of tau pathology. Each node within the network represents a brain region, where color indicates local tau pathology, distance between regions indicates connection length (i.e., Euclidean distance), and edge thickness indicates functional connectivity strength. Example formulae for models 1 to 3 illustrate how tau‐weighted distance (Model 1), tau‐weighted functional connectivity (Model 2). or tau‐ & distance‐weighted functional connectivity (Model 3) that were used to model group‐mean annual tau‐PET change in the 53 Aβ+ ADNI (B–D) and 41 Aβ + BioFINDER subjects (E–G) were computed. For ADNI, the computed association is illustrated in (B–D) for 1000 bootstrapped samples. H‐J, Resulting β‐value distributions (y‐axis) were compared between Models 1–3 using an ANOVA with post‐hoc Tukey‐test (x‐axis). F, Prediction Models 1–3 were assessed on the subject‐level for 53 ADNI Aβ+ and 41 BioFINDER Aβ+ subjects using subject‐level annual tau‐PET change and subject‐level connectivity (ADNI) or HCP‐derived group‐level functional connectivity (BioFINDER). Subject‐derived β‐value distributions were compared across Models 1–3 using an ANOVA. Linear model fits are indicated together with 95% confidence intervals. Aβ, amyloid beta; ADNI, Alzheimer's Disease Neuroimaging Initiative; ANOVA, analysis of variance; DAN, dorsal attention network; DMN, default mode network; FPCN, frontoparietal control network; HCP, host cell protein; PET, positron emission tomography; ROIs, regions of interest; VAN, ventral attention network. Reproduced with permission from Franzmeier et al. 27
A disease progression score based on the differences in trajectories of cortical Aβ burden and hippocampal volume of an individual, compared to population curves derived from data‐driven models, tracked longitudinal disease progression and predicted worsening clinical diagnosis. 30 The disease progression score was used as a quantitative phenotype in a genome‐wide association study (GWAS) and identified a novel locus in LCORL that was expressed in the hippocampus and associated with better prognosis. Disease progression models may therefore be of use in discovering regional and temporal genetic variation in AD.
These data‐driven models illustrate the power of considering different modalities in elucidating the intricacies of disease progression. These extend beyond the biomarkers considered by Jack et al. to include tau PET, measures of early cognitive changes such as Rey Auditory Verbal Learning Test, plasma biomarkers, gene expression, and structural and functional brain networks. While the timing and ordering of biomarkers included in the Jack et al. model was recapitulated in recent data‐driven models, 21 , 31 newer modalities suggested that the first cognitive dysfunction 31 and in vivo tau deposition 21 may occur around the same time as the first Aβ abnormalities arise. These discrepancies may be due to not only the use of different modalities or cognitive tests, but also to the existence of heterogeneous pathways of progression. 23
2.2. Aβ in disease progression
The extracellular deposition of Aβ into plaques is part of the definition of AD pathology and represents an early step in all models of disease progression discussed above. Increased cortical Aβ accumulation below the threshold for Aβ positivity in CU elders was associated with worse memory decline, but not with decline in executive function. 32 The fastest‐changing tertile of subthreshold CSF Aβ42 was associated with greater CSF biomarker abnormality, greater cortical Aβ burden, glucose hypometabolism, decline in the Mini‐Mental State Examination (MMSE), and an increased risk of clinical progression to MCI. 33 Faster‐changing subthreshold CSF Aβ42 was in turn predicted by higher baseline CSF levels of β‐secretase 1, Aβ40, and Aβ38, markers of amyloid precursor protein (APP) processing, suggesting that these proteins signal early pathophysiological events on the road to biomarker abnormality. The region of greatest early Aβ PET uptake, the banks of the superior temporal sulcus, was operationalized as a staging method to investigate this association further. 34 The rate of memory decline in CU elders in stage I (positive for Aβ accumulation in this region but negative for uptake in a composite cortical region) 35 had a rate of memory decline 2.5 times faster than CU elders in stage 0 (no evidence of Aβ accumulation). Those individuals in stage 2 (positive for Aβ binding in both the superior temporal sulcus and in the composite cortical region) had memory decline 4.8 times faster than those in stage I, faster rates of decline in executive function, and worse CSF biomarkers. A similar five‐stage multitracer model of cortical Aβ 36 added successive areas of Aβ abnormality detected in Aβ PET scans in a CU cohort, beginning with no tracer uptake in stage 0, followed by initial uptake in cingulate regions in stage 1, and eventually spreading to widespread temporal and occipital regions in stage 4. When this staging was applied to six additional cohorts of CU, MCI, AD, and non‐AD dementia individuals scanned using four different radiotracers, baseline stage predicted MMSE decline, and was associated with the number of APOE ε4 alleles, CSF Aβ42, and CSF phosphorylated tau (p‐tau181 ). The staging system outperformed global standardized uptake volume ratio (SUVR) in identifying progressors and detected early Aβ deposition in all diagnostic categories (Figure 2) indicating its validity and generalizability. Differing gene expression profiles were associated with different regions reported in a similar four‐stage system, 37 including those associated with voltage gated ion channel activity, lipid transport, axon guidance, and blood circulation.
FIGURE 2.
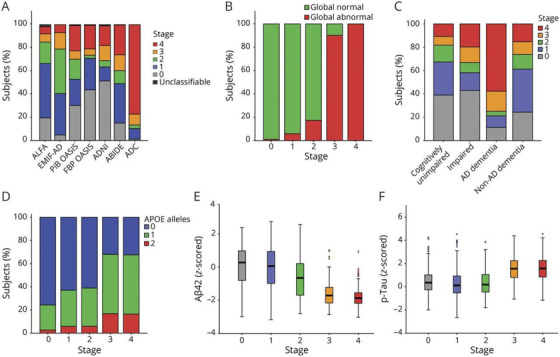
(A) Baseline distribution of staging clasification per cohort. Stages refer to a model developed in CU individuals based on the sequential addition of four clusters of regional Aβ: Stage 0: no tracer uptake; Stage 1: cingulate regions; Stage 2: precuneus, paracentral gyrus, lateral orbital cortex, and insula; Stage 3: basal temporal, frontal, and additional associative cortices; Stage 4: other temporal and occipital regions. Classification based on Aβ staging model vs (B) global Aβ PET classification. (C) syndromic diagnosis, (D) genetic risj, (E) z‐scored CSF Aβ42 levels, and (F) log‐transformed z‐scored phosphorylated tau (p‐tau) values. Aβ, amyloid beta; ABIDE, Alzheimer's Biomarkers in Daily Practice; ADC, Amsterdam Dementia Cohort; ALFA, Alzheimer's and Family cohort; EMIF‐AD, European Medical Information Framework for AD; FBP, florbetapir; PIB, Pittsburgh compound B. Reproduced with permission from Collij et al. 36
These subtle changes in memory performance in CU individuals linked to subthreshold cortical Aβ are consistent with some of the first pathological changes predicted by data‐driven models discussed in Section 2.1 (e.g., Hadjichrysanthou et al. 10 ). Aβ‐associated domain‐specific cognitive changes may be mediated by functional brain changes within the subsystems of the default mode network (DMN) and visual network, with the strongest effect in the precuneus and lateral inferior parietal lobe. 38 An Aβ‐ and FDG‐PET study 39 sheds further light on the involvement of the DMN. In CU and MCI individuals, regional patterns of hypometabolism were associated with Aβ deposition in distant regions connected by the DMN. Furthermore, clinical progression was associated with an interaction between this regional hypometabolism and overlapping local Aβ. The authors suggest a model in which distant Aβ induces, via the DMN, regional metabolic vulnerability, and in which this vulnerability synergistically interacts with local Aβ to drive progression to dementia. It should be noted that the association of Aβ with cognitive changes does not necessarily mean that Aβ accumulation directly impairs cognition. Considerable data from ADNI 2 , 3 and other publications show that accumulation of tau is much more closely linked with cognitive impairment than is Aβ.
The genetic architecture underlying brain amyloidosis appears to be complex, involving multiple loci, and differing across disease stages. Studies of summary scores of polygenic risk (polygenic risk scores and/or polygenic hazard scores) indicated that their association with CSF Aβ42 or cortical Aβ was driven primarily by the APOE ε4 allele. 40 , 41 , 42 Of the top 20 AD risk variants beyond APOE ε4, ABCA7 was the most strongly associated with amyloidosis in both asymptomatic and early symptomatic disease 43 (Figure S4 in supporting information). Loss of function of the ABCA7 protein, involved in membrane transport particularly in microglia, increased β‐secretase cleavage of APP leading to higher levels of cortical Aβ. Risk variants in this gene may therefore play a greater role earlier in disease progression during rapid accumulation of Aβ before its levels plateau. In contrast, the association of FERMT2 with amyloidosis was stage‐dependent, peaking in MCI (Figure S4). Weaker associations with Aβ deposition were also identified for CLU, DSG2, EPHA1, SORL1, PICALM, and ZCWPW1, of which CLU, EPHA1, and SORL1 are associated with innate immune signaling. A novel locus associated with brain amyloidosis in CU individuals, RBFOX1, was identified from a multicenter GWAS that included ADNI participants and validated using pathologic samples from ROS‐MAP. 44 This locus encodes a neuronal RNA binding protein that was found to be localized in Aβ plaques. Reduced expression of RBFOX1 was associated with poor global cognition and with higher Aβ burden, although its mechanism of action is not yet understood. FAM222A, recently identified as a putative brain atrophy susceptibility gene, encodes the protein aggregatin which accumulates in Aβ deposits and facilitates Aβ aggregation by physically interacting with Aβ. 45 Beyond specific loci, epistatic interactions may influence amyloidosis through gene regulation. Single nucleotide polymorphism (SNP)–SNP candidate interactions identified in a genome‐wide epistasis analysis of Aβ in post mortem brains in ROS‐MAP and subsequently validated in ADNI using CSF biomarkers, were primarily involved in the regulation of cell development, nervous system development, and cell fate commitment. 46
2.3. Tau deposition in disease progression
ADNI tau PET data have allowed researchers to move beyond neuropathological studies to investigate neurofibrillary tau pathology in vivo. A feature of normative aging is the accumulation of tau tangles within the medial temporal lobe (MTL), termed primary age‐related tauopathy (PART), which is associated with subtle cognitive effects. 47 In Aβ– participants, regional MTL tau PET SUVR was not associated with longitudinal cortical atrophy, 48 suggesting that PART does not drive neurodegeneration. However, in the same individuals, regional MTL tau PET SUVR was associated with MTL subregional atrophy that recapitulated Braak staging, suggesting that 18F‐flortaucipir detects tau pathology from PART in the MTL. 49 The sequence of events leading to tau‐dependent neurodegeneration beyond normative aging in individuals with suprathreshold Aβ deposition was investigated by several ADNI studies. First, temporal region tau PET accumulation was observed only in CU participants with high (>68 Centiloids [CL]) antecedent Aβ deposition in the Mayo Clinic Study of Aging, 50 suggesting that a critical level of Aβ deposition must be reached to trigger the subsequent chain of events. However, these findings were not totally supported by ADNI data. Second, tau PET binding in the trans‐entorhinal cortex, an early site of neurofibrillary tangle accumulation, was positively associated with longitudinal atrophy within the MTL in CU and impaired Aβ+ but not Aβ– individuals. 51 Broader MTL tau PET binding in Aβ+ individuals was positively associated with longitudinal atrophy in temporal and orbitofrontal regions 48 (Figure 3). Taken together, these results support an active process of neurodegeneration specific to tau pathology that is dependent on antecedent Aβ deposition and that spreads from the entorhinal cortex to laterotemporal and orbitofrontal regions. However, the Aβ plaque deposition measured by Aβ PET may not be the species of Aβ that drives tau deposition, neurodegeneration, and cognitive decline. Some have suggested that Aβ oligomers (not detected by Aβ PET), which are associated with Aβ plaques, may be toxic Aβ species.
FIGURE 3.
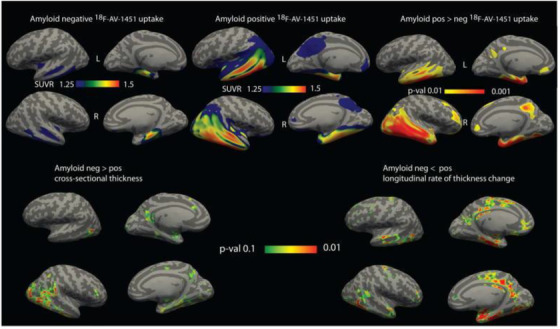
Association of tau positron emission tomography uptake with cortical thickness and atrophy. Top, Mean standardized uptake value ratio of 18F‐AV‐1451 uptake in amyloid beta (Aβ)– (left) and Aβ+ (middle) individuals. Right panel shows areas of significantly greater tracer uptake in amyloid‐positive group (P < .01 family‐wise error rate). Bottom, Areas of significantly greater thickness (left) and lower rate of thickness change (right) in Aβ– individuals. Maps are shown at an uncorrected threshold of P < .1 for visualizing trends in the data. Effects were not statistically significant after correction for multiple comparisons. Reproduced with permission from Das et al. 48
Tau accumulation may be influenced by genetic factors independently of APOE ε4‐influenced Aβ accumulation. Beyond APOE, polygenic risk scores and/or polygenic hazard scores were associated with CSF total tau (t‐tau) and p‐tau181, 40 , 41 clinical diagnosis, 40 and CSF proteomic markers of neurodegeneration such as neurofilament light (NfL), YLK‐40, and neurogranin. 41 The established risk locus, rs74473 in BIN1, was associated with higher global tau PET uptake independently of Aβ status, and with elevated tau in regions corresponding to Braak stages II–VI (Figure S5 in supporting information) in non‐demented elders. 41 These results are consistent with the hypothesis that the protein encoded by BIN1 risk variants aggravates tau but not Aβ pathology. A genome‐wide interaction analysis of epistatic interactions 46 identified SNP–SNP pairs related to tau pathology, predominantly involved in axon development, axonogenesis, and forebrain development. The pair with the most significantly altered expression was MAPK9, associated with t‐tau, p‐tau181, and neurofibrillary tangles, and CAMKK1, involved in tau phosphorylation.
Although it is well known that the APOE ε4 allele is associated with levels of Aβ, it may also independently modulate tau. In two independent cohorts of participants across the AD spectrum, APOE ε4 carriers had increased tau PET SUVR in the bilateral entorhinal cortex and hippocampus independently of Aβ PET global SUVR, implicating greater tau pathology as a cause of increased regional neurodegeneration observed in these individuals. 52 Therefore, it is likely that the deleterious consequences of APOE ε4 in AD extend beyond its link with Aβ.
It has been known for many years that the regional pattern of Aβ plaque spread in AD differs from that of closely associated patterns of tau spread and neurodegeneration (Figure S6 in supporting information). 53 The molecular underpinnings of this differential regional vulnerability to Aβ deposition and subsequent neurodegeneration were investigated by examining the brain transcriptional architecture underlying these patterns. 53 Regional expression of the genes coding for the APP (APP) and for tau (MAPT) was correlated with regional Aβ deposition and regional neurodegeneration, respectively, but not vice versa. Gene set enrichment analysis identified differential gene sets underlying regional vulnerability to Aβ deposition and neurodegeneration. Aβ‐vulnerable regions were characterized by low expression of genes implicated in protein folding and degradation, suggesting that these may contribute to Aβ aggregation, and also by the low expression of mitochondrial respiration genes. Regions vulnerable to neurodegeneration were characterized by the high expression of genes involved in neural plasticity, and by the tau kinases CDK5 and MAPK1/ERK2, along with components of the Ras‐ERK signaling pathway. This study provides intriguing insight into the differential molecular properties underlying vulnerability of the affected neural systems in Aβ accumulation compared to neurodegeneration.
2.4. AT(N) biological classification of AD
The National Institute on Aging‐Alzheimer's Association AT(N) research framework for the biological definition of AD 54 is based on biomarkers for Aβ deposition (A), pathologic tau (T), and neurodegeneration (N) that are defined as abnormal above predetermined thresholds. The ADNI data set has been a rich source of material for those investigating the value of the AT(N) approach. Despite data‐driven models of disease progression 10 , 21 , 23 , 55 , 56 , 57 , 58 , 59 largely recapitulating the classic temporal sequence of events (i.e., amyloidosis preceding pathologic tau aggregation leading to neurodegeneration), other sequences of biomarker abnormality are possible, such as that found in primary tauopathies in which tau aggregation precedes amyloidosis. A study of ADNI CU and MCI participants that followed trajectories of AT(N) biomarkers found that the biomarker for amyloidosis most commonly became pathological first, and subsequently diverged into a faster‐progressing A→T→N evolution and the much slower‐progressing A→N→T evolution (Figure S7 in supporting information). 60 In some elders, tau deposition preceded amyloidosis by an average of more than 40 months in a T→A→N sequence of biomarker abnormality, suggesting that tau and Aβ may independently arise from separate pathophysiological processes. Individuals with an N→A→T sequence had the fastest rate of pathological progression, suggesting that different etiologies, such as vascular brain injury or TDP43, underlie initial neurodegeneration in this instance (Figure S7).
A recent mediation study suggested that the degree to which the effect of baseline Aβ on cognition is explained by tau or neurodegeneration differs depending on disease stage and region. In CU elders, Aβ deposition affected change in memory via predominantly MTL atrophy in the absence of changes in tau, suggesting that Aβ may interact with tau already present in the MTL due to PART or other pathological processes early in disease progression. This effect continued into early and late MCI, but in early MCI, the effect of Aβ on memory was also mediated by tau and lateral temporal lobe atrophy. In late MCI wider tau‐dependent atrophy affected both memory and executive function.
The application of binary cut points to define “normality” versus “abnormality” is an issue with any biomarker for any disease process that occurs over decades. There may exist a biologically relevant “gray zone” around the biomarker threshold that reflects the difficulty in defining the exact point at which changes in biomarkers result in a significantly worse cognitive trajectory that may be indicative of other etiologies or mixed pathologies contributing to cognitive decline. The NIA‐AA framework document discussed this at length and pointed out that while binarizing the AT(N) groups into ± is one option, all AT(N) measures are continuous and other options for cut points might be more useful in certain situations. 54 The trajectory of impairment in the preclinical Alzheimer's cognitive composite (PACC) 61 in CU individuals was indistinguishable within 0.1 from the florbetapir PET SUVR threshold of 1.11, a spread which included ≈40% of individuals (Figure S8 in supporting information). 62 Subthreshold changes in Aβ and tau that are not detected in the dichotomous AT(N) classification may represent a state of worsening yet not abnormal biomarkers with implications for disease trajectory. In CU elders, subthreshold Aβ accumulation, but not baseline Aβ load, was associated with decline in a composite memory score, but not in a composite executive function score, 32 indicating that very early Aβ accumulation can be associated with subtle effects on cognition.
The ADNI data set has been especially useful in studying how the choice of biomarker within each AT(N) category may affect patient staging. CSF and PET measures of Aβ pathology provide different information as evidenced by the finding that decreases in CSF Aβ42 precede Aβ PET positivity. 63 The transition to CSF Aβ abnormality was predicted at a cutoff of 12 CL of Aβ PET, whereas the transition to Aβ PET positivity occurred at ≈30 CL. 64 In a similar manner, CSF p‐tau181 abnormality may precede tau PET positivity. 65 Regardless of tau PET status, individuals with suprathreshold CSF p‐tau181 were more likely to be Aβ+, have elevated tau PET binding in Braak stage ROIs, and have accelerated rates of antecedent p‐tau181 accrual than those with subthreshold CSF p‐tau181. 65 The CSF+/PET– discordance in tau may therefore represent an intermediate stage in AD pathogenesis that may or may not be recognized by AT(N) staging depending on the biomarker used. 66 A systematic study of AT(N) classification highlighted staging discrepancies resulting from the use of different biomarker classes at different disease stages. 66 Compared to staging using CSF core AD biomarkers, substitution of Aβ PET resulted in increasing misclassification from CU to MCI to AD (Figure 4A‐D). Different markers of neurodegeneration (hippocampal volume, cortical AD signature, FDG PET SUVR, and CSF t‐tau were poorly correlated at all disease stages, resulting in substantial misclassification (Figure 4A‐D) but performed best in individuals with AD, presumably due to more advanced neurodegeneration in this group. Tau PET was not included in this study but another study 65 suggested that this measure would likewise result in misclassification as CSF p‐tau181 abnormality appeared to precede tau PET positivity. As AT(N) groups are associated with different trajectories of decline, 60 misclassification may result in incorrectly ascribed progression risks with implications in clinical trials and clinical practice. 67
FIGURE 4.
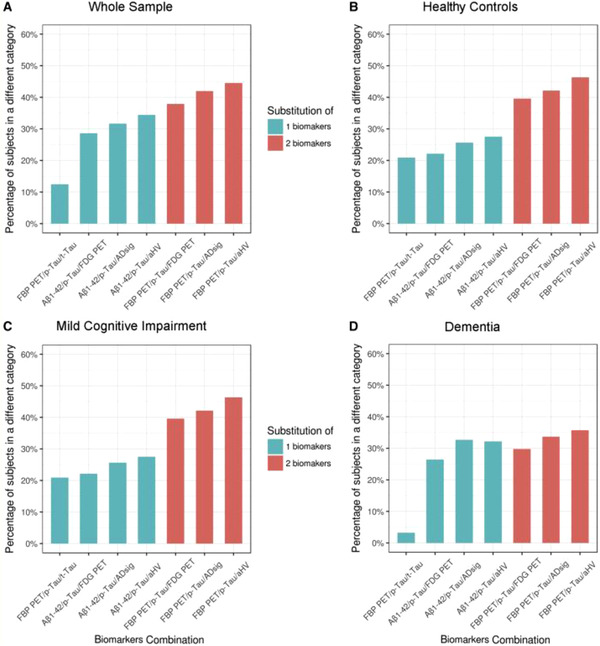
Discrepancies in AT(N) classification using different biomarker combinations. Percent of AT(N) misclassifications for the different biomarker combinations in (A) the whole sample, (B) cognitively unimpaired, (C) mild cognitive impairment, and (D) dementia subjects. The percent of participants classified in different categories are shown for each biomarker combination compared to classification with CSF Aβ42, p‐tau181, and t‐tau. Percent of misclassifications are shown in green when one biomarker was changed, and in orange when two biomarkers were changed. Aβ, amyloid beta; ADsig, Alzheimer's disease cortical signature; aHV, adjusted hippocampal volume; FBP PET, [18F] florbetapir positron emission tomography; FDG PET, [18F] fluorodeoxyglucose positron emission tomography; p‐tau181, phosphorylated tau; t‐tau, total tau. Reproduced with permission from Illán‐Gala et al. 202
The use of additional biomarkers of different aspects of neurodegeneration has been an active area of study and may increase staging precision and the prediction of decline. CSF neuronal pentraxin, a marker reflecting the loss of synaptic regulation, was decreased in AD compared to CU elders, strongly predicted both memory and global cognition, and in a ratio with tau accurately discriminated between AD and CU individuals independently of Aβ. 68 Additional synaptic markers, neurogranin, and synaptosomal nerve‐associated protein 25 (SNAP‐25), also predicted cognitive decline. 68 Levels of CSF neurogranin, SNAP‐25, and visinin‐like protein 1 were highly correlated and elevated at baseline as a function of Aβ positivity. 69 NfL, a marker of neuronal damage, can now be accurately measured in plasma in addition to CSF, 70 opening the possibility of the use of low cost and minimally invasive blood biomarkers (Section 4) in AT(N) staging. Longitudinal changes in plasma NfL were associated with both AD neuropathology and neurodegeneration across diagnostic groups. 70
3. BEYOND AT(N): OTHER INFLUENCES ON DISEASE PROGRESSION
The multifactorial nature of AD is well recognized and there has been increasing acknowledgment that the cascade of Aβ deposition leading to tau deposition and neurodegeneration is insufficient to fully explain the diversity of disease trajectories. What other factors, then, influence disease progression and how do they affect the selection of participants for clinical trials and subsequent interpretation of findings? Several studies described in Section 2 identified heterogeneous pathways of disease progression 23 , 57 , 60 or implicated other factors that may affect progression such as immune function 24 , 43 or vascular structure and function. 24 In addition, neuropathological examination frequently identifies co‐pathologies such as cerebral amyloid angiopathy, limbic‐predominant age‐related TDP‐43 encephalopathy neuropathological change, and Lewy bodies. 71 Although we do not comprehensively review these pathologies, several studies highlight their contribution to AD. CSF α‐synuclein, the major component of Lewy bodies, predicted cognitive measures and progression to AD dementia, 72 a frontotemporal neurodegenerative pattern observed in Aβ– MCI and AD dementia participants may have been underlaid by limbic predominant age‐related TDP43 encephalopathy, 73 which in turn modulated Aβ PET signal. 74
Although the AT(N) research framework is currently most commonly implemented using the biomarkers in Section 2.4, it was constructed to be flexible in the incorporation of new biomarkers and to the addition of new biomarker categories reflecting the multifactorial etiology of AD such as genetic risk, cerebrovascular disease, cognitive reserve, and inflammation. 54 , 62 The use of these additional categories of biomarkers may help to better define cognitive trajectories in elders with “gray zone” A or T biomarkers. 62
This section will discuss evidence for subtypes of AD that have different disease trajectories, the effect of cerebrovascular disease on both Aβ and tau pathways, the growing recognition of the importance of the immune system in AD, mechanisms of cognitive resilience, and how sex influences disease progression. It is important to note that these are not discrete categories of factors; there is ample evidence for their interplay. Recent ADNI genetic studies that have identified novel loci or investigated established AD risk alleles have predominantly identified the factors described above. While a discussion of these findings is beyond the scope of this review, these studies are summarized in Tables S2 and S3 in supporting information, respectively.
3.1. Heterogeneity
AD is an inherently heterogeneous disorder with wide variance in biomarkers or cognitive tests that confound understanding disease progression and treatment. ADNI has continued to be instrumental in identifying sources of heterogeneity and characterizing subtypes of AD. A data‐driven approach using a wide range of neuropsychological tests identified six clusters across the spectrum of ADNI participants and identified their characteristic biomarkers. 75 In addition to a “healthy” subgroup with normal cognition and biomarkers, a second “worried well” subgroup with no diagnosis of cognitive impairment was characterized by higher subjective cognitive decline and may represent preclinical AD. Two MCI groups were identified, a lesser‐impaired, younger, and more highly educated “affective MCI” subgroup comprised mostly of early MCI participants and a more highly impaired “uncompensated MCI” group split between ADNI early and late MCI groups that had an increasing severity of other biomarkers (MRI, FDG PET, CSF). Two distinguishable subtypes of AD were identified. “Anosognosia dementia” was characterized by maximum severity of cognitive impairment with low self‐awareness of impairment and widespread atrophy and comprised almost entirely ADNI AD participants. In addition, “insightful dementia” had better cognitive scores and self‐awareness, regional rather than whole brain atrophy, and included some late MCI and early MCI participants. It is unclear whether these clusters represent different stages or different trajectories of progression, but the novel identification of distinct AD subgroups, distinguished in part by levels of self‐awareness, has implications for diagnosis and treatment assignments.
Neuropsychologically derived MCI subtypes may represent different trajectories of progression underlaid by differences in biomarkers. A “neuropsychological early MCI” subtype was characterized by impairment in memory and naming domains, a “neuropsychological late MCI” subtype by widespread cognitive deficits, and a third “false positive” subtype lay within normal limits. 76 These groups had non‐overlapping survival curves (Figure S9 in supporting information), and were differentiated by CSF biomarker levels with the “false positive” group indistinguishable from CU. In contrast, ADNI early and late MCI groups were less well defined in their survival curves (Figure S9) and levels of CSF biomarkers, and there was little difference between the ADNI early MCI and clustered‐derived “false positive” groups. Widespread cortical thinning was only observed in the clustered‐derived late MCI group. The use of multiple neuropsychological measures may therefore stage MCI into biologically relevant subgroups with distinct trajectories, both a faster progressing group and potentially misclassified CU elders. Similarly, amnestic, dysnomic/mixed, and mixed MCI subtypes were characterized by MTL, lateral temporal, and widespread longitudinal cortical atrophy, respectively, supporting the validity of the subtypes as separate entities rather than different points in disease progression. 77 Further studies of neuropsychologically derived MCI subtypes are described in Table S1. Similar cognitive subtypes were identified in AD, 78 implying that differing trajectories of disease progression extend across diagnostic stages. One subtype had predominantly memory impairments characterized by an older age of onset, lower frequency of APOE ε4, less MTL atrophy, and slower progression, and a second had mostly non‐memory impairment characterized by younger age of onset, higher frequency of APOE ε4, more posterior cortical atrophy, and faster progression. Future studies are required to fully validate these cluster‐ derived subgroups and to determine their clinical utility.
Consideration of temporal in addition to phenotypic heterogeneity 79 identified subgroups that evolved different atrophy patterns in multiple distinct stages that were reproducible across cohorts (Figure 5). The Typical subgroup, Cortical, and Subcortical subtypes were characterized by atrophy beginning in the hippocampus and amygdala; insula and cingulate; and pallidum, putamen, and caudate, respectively. A parietal subtype was also identified in one data set that was characterized by posterior cortical atrophy, younger age, and worse performance on special subtests. Although mixtures of the subtypes were expressed within individuals, more AD than MCI individuals were strongly assigned to a subtype, raising the possibility that these phenotypes may be more strongly expressed later in disease progression. A similar approach that jointly considered both cognitive deficits and atrophy patterns identified three latent factors in MCI and AD participants that were stable across time. 80 The first was associated with MTL atrophy, episodic memory deficits, and tau binding in MTL regions, and appears consistent with the “Typical” pattern described above. 79 The second latent factor was characterized by lateral temporal atrophy and language deficits and had no associations with tau deposition. The third latent factor was characterized by posterior cortical atrophy, deficits in visuospatial abilities and executive function deficits, tau binding in lateral temporal and posterior cortical regions, and younger age. Individuals differed in their expression of each of the latent factors, reflecting the possibility of multiple coexisting pathologies. 80
FIGURE 5.
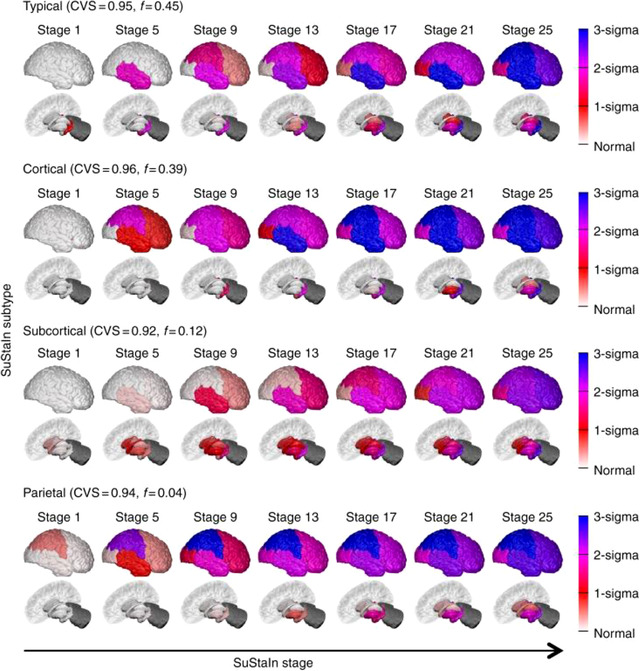
Progression of regional atrophy of subgroups of temporal and phenotypic heterogeneity. Rows show the progression pattern of three major subtypes: a typical, a cortical and a subcortical subtype, as well as an additional very small outlier parietal group (only 4%) that may represent outliers with a posterior cortical atrophy phenotype. CVS, cross‐validations. Reproduced with permission from Young et al. 79
Genetic differences may underlie identified subgroups. 81 Reproducible genetic differences were found in subgroups of AD individuals defined by impairments in memory, executive function, language, visuospatial, or multiple domains. 81 Relative memory impairment was associated with higher levels of APOE ε4 than other subgroups, and 33 novel suggestive loci outside APOEapproached genome‐wide significance for at least one subgroup, suggesting that these subgroups are biologically coherent (Figure S10 in supporting information). In a novel approach, subgroups of participants across the AD spectrum were identified from differences in blood proteins and metabolites, primarily levels of β2‐microglobulin, cystatin‐C, thrombospondin, and seven other plasma proteins (Figure S11 in supporting information). 82 Subgroups were characterized by distinct patterns of cortical and subcortical atrophy, suggesting that biochemical differences may underlie the subtypes identified using atrophy patterns.
Biological subtypes of AD were identified based on differences in CSF proteomes between AD and CU participants across two cohorts. 83 Three distinct subtypes were identified, characterized by hyperplasticity, activation of the innate immune system, and blood brain barrier dysfunction, respectively, and each subtype was associated with distinct cognitive, cortical thickness, and CSF biomarker profiles. All subtypes had an excess of genetic risk for AD and did not differ in disease severity or presence of co‐pathologies.
Converging evidence from multiple angles—neuropsychological, imaging, blood biomarkers, genetics, and proteomics—points to substantial heterogeneity underlying disease progression. A “classic” AD subgroup was identified by multiple approaches, 76 , 79 , 80 , 81 , 82 , 84 typified by initial atrophy in hippocampus and amygdala followed by MTL atrophy, and primarily memory deficits, and underlain by APOE ε4. Other subgroups feature primarily non‐memory cognitive deficits, commensurate atrophy patterns, and associations with distinct genetic loci. Of note, a subgroup was characterized by younger age of onset, faster progression, posterior cortical atrophy, cognitive deficits in visuospatial tasks, and a higher frequency of APOE ε4 carriers by multiple studies 78 , 79 , 80 and bears a striking similarity to the “pathway B” of disease progression 23 described in Section 2.1. A very recent study described and replicated four similar subgroups with distinct trajectories from tau PET scans. 85 These characteristics may aid in the identification of patients likely to progress faster in a clinical setting. Further investigation of disease subgroups is required to establish biological coherence and the relationship between subgroups defined by cognitive measures, atrophy, and plasma biomarkers. These studies will play an important role in both identifying participants for clinical trials and guiding clinical care with the development of personalized medicine approaches.
3.2. Cerebrovascular disease
Cerebrovascular disease, consisting of microvascular changes that cause impaired cerebral perfusion such as white matter (WM) lesions, microinfarcts, and hemorrhages is increasingly recognized as a major contributor to AD, vascular dementia, Lewy body disease, and other conditions. It is observed in 60% to 90% of AD patients and may act to exacerbate clinical dementia risk although the underlying mechanisms are complex. 86 Cerebrovascular disease may act directly, as an additive contribution to cognitive decline, independently of Aβ and tau pathology, or may interact with Aβ deposition or tau burden. Recent ADNI studies have made important contributions of cerebrovascular disease to an emerging framework of these mechanisms.
Cerebrovascular events can be directly caused by a lack of blood flow to the brain due cardiovascular disease. 86 Smoking, 87 hypertension, 88 body mass index (BMI), 89 and overall cardiovascular risk 90 were associated with impaired glucose metabolism, neurodegeneration or cognitive decline (Table S1). Cognitive decline in ADNI participants with Type 2 diabetes mellitus was mediated by baseline cortical thickness. 91 These participants also had decreased regional cerebral cortical Aβ compared to participants without Type 2 diabetes mellitus, 92 although they were reported to have higher levels of CSF Aβ42 that may be attributable to diabetes‐related pathological changes such as hyperglycemia. These studies are consistent with a mechanism by which Type 2 diabetes mellitus exerts its effect on cognition via “classic” AD pathology and neurodegeneration.
A major manifestation of cerebrovascular disease is WM hyperintensities (WMHs) on T2‐weighted MRI. These have been associated with decline of global cognition rather than the specific cognitive domains typical of AT(N) pathology. 86 Greater WMH volume was associated with worse baseline and longitudinal performances over a range of cognitive and functional tests across ADNI participants (Figure S12 in supporting information), and with an elevated risk of MCI to AD progression. 93 Increased WMHs were also associated with higher levels of plasma NfL, a marker of axonal degeneration, in MCI and AD participants. 94 The relationship was significantly attenuated by age, suggesting that WMHs are linked to neuronal damage in an age‐dependent manner. It is important to note that these associations have been identified in the relative absence of cerebrovascular disease due to ADNI's cerebrovascular exclusion criteria (https://adni.loni.usc.edu/wp‐content/uploads/2008/07/adni2‐procedures‐manual.pdf), suggesting that they may be stronger in the wider population.
How does cerebrovascular disease worsen cognition? Its effect may be direct, or mediated by “classic” AD pathologies, or both. Individuals with neurodegeneration in the absence of Aβ deposition (i.e., having suspected non‐AD pathology) had high WMH burden, suggesting that cerebrovascular disease may directly drive hippocampal atrophy and cognitive decline. 95 Increased WMH burden was to a lesser degree associated with lower CSF Aβ42 across diagnostic groups, independently of CSF p‐tau181 and CSF t‐tau, and APOEstatus, 96 supporting a less prominent link with Aβ pathology. In Aβ– CU elders, regional increases in WMHs spanning superior regions of the frontal and parietal lobes were associated with faster rates of regional subthreshold Aβ accumulation in cortical regions characterized by early Aβ accumulation. 97 This study is consistent with models in which cerebrovascular alterations are one of the earliest AD pathological changes. 98 Across CU, MCI, and AD participants, increased cortical Aβ load and WMH volume were associated with lower cortical thickness. 99 However, the association between WMH volume and cortical thickness in AD‐associated regions held even in the absence of Aβ, suggesting an additive effect of Aβ and cerebrovascular disease on neurodegeneration. 99 Together, these results support independent and additive mechanisms for the effect of cerebrovascular disease on cognitive decline: one age‐related and independent of “classic” AD pathology, and a second, related to AD pathology, that may occur very early in disease progression.
An additional Aβ‐independent pathway for the effect of cerebrovascular disease on cognitive decline in AD may involve tau pathology. 100 Increased WMH volume was associated with higher plasma t‐tau concentration independently of CSF Aβ42, with an increasing strength of the interaction across diagnostic stages (Figure S13 in supporting information). The interaction of WMH and plasma t‐tau, independently of CSF Aβ42, was associated with increased likelihood of MCI and AD, indicating their combined impact on cognitive decline. Although the plasma measurement of t‐tau reflects neurodegeneration rather than phosphorylated tau, neuropathological studies of ADNI participants in which arteriosclerosis was positively associated with Braak neurofibrillary tau staging support the association of cerebrovascular damage with neurofibrillary tangles. Future confirmatory studies using plasma measures of phosphorylated tau may clarify these associations.
The effect of cerebrovascular disease on cognition may be modulated by carriage of the APOE ε4 allele, which has far‐reaching effects via numerous Aβ‐dependent and independent pathways. Some studies reported APOE ε4‐independent associations between vascular disease and AD biomarkers 90 , 96 and/or cognitive decline. 90 , 101 However, in a study conducted in the Sunnybrook Dementia Cohort and replicated in ADNI, 102 greater WMH volume was associated with worse attention/executive functions and language in APOE ε4 carriers but not non‐carriers across the spectrum of AD and dementia with Lewy bodies. Neuropathological assessment revealed that 100% of APOE ε4 homozygotes but only 64% of heterozygotes had cerebral amyloid angiopathy, suggesting that accumulation of Aβ in the cerebral vasculature may be the etiology for WMH in APOE ε4 carriers. 102 The APOE ε4 allele may interact synergistically with vascular disease. In CU elders, hypertensive APOE ε4 carriers had a steeper decrease in glucose metabolism than hypertensive non‐carriers, carriers with normal blood pressure, or non‐carriers with normal blood pressure suggesting that the APOE ε4 allele acts to exacerbate the effect of hypertension on glucose metabolism. 88
Overall, these studies provide further evidence for the detrimental effect of vascular risk factors on neurodegeneration and decline. Cerebrovascular disease may exert its effect directly, via Aβ or tau deposition, or by a combination of pathways, and its effect may be exacerbated by the APOE ε4 allele (Figure 6).
FIGURE 6.
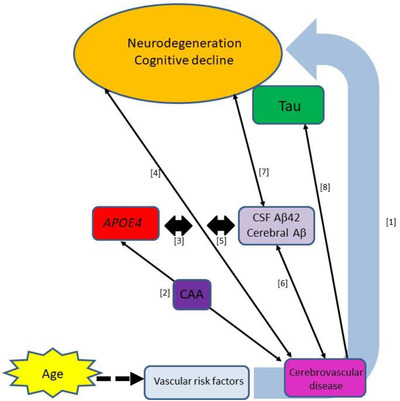
Cerebrovascular impacts in AD supported by recent ADNI studies. (1) Cardiovascular risk factors are associated with markers of neurodegeneration and cognitive decline. 87 , 88 , 90 , 203 (2) The apolipoprotein E (APOE) ε4 allele may increase WMHs via induction of CAA. 102 (3) APOE ε4 exacerbates effect of vascular risk factors on cognition. 88 (4) CVD has an age‐related effect on general cognition which increases MCI to AD transition. 93 , 94 (5) Aβ‐mediated and direct effects of CVD are additive. 204 Other studies have found both direct and additive interactions. 86 (6) Aβ is associated with WMHs independently of tau. 96 , 97 (7) Aβ mediates association between WMH and cognition. 204 This could occur directly or via tau. (8) Tau was associated with WMHs independent of Aβ. 100 CAA, cerebral amyloid angiopathy; CSF, cerebrospinal fluid; CVD, cerebrovascular disease; MCI, mild cognitive impairment; WMHs, white matter hyperintensities
3.3. Immune response
Multiple strands of evidence from recent studies using ADNI genetics data, blood and CSF samples, and other approaches, support a crucial role of microglial‐associated innate immune response in modulating AD risk. Microglia, the primary innate immune cells of the central nervous system, facilitate Aβ and tau clearance, and contribute to neuroinflammation that damages neurons. 103 Therefore, the immune response and inflammation can both slow and accelerate AD pathology. Many AD risk alleles (e.g., APOE, TREM2, CD33, CLU, ABCA7, BIN1, SORL1, IL‐34, MS4A gene cluster, TREML2, SHARPIN) affect innate immune signaling pathways. A study examining associations between a polygenic risk score and CSF proteomic profiles in ADNI participants identified three clusters of associations. 41 The first cluster, enriched for a “complement and coagulation cascades” pathway involved in immune response, was dominated by the association between the APOE ε4 allele and Aβ. A second cluster, enriched for cytokines and cell adhesion molecules involved in inflammatory responses, was largely independent of associations with APOE ε4. The third cluster was enriched in proteins that reflect neuronal injury, synaptic degeneration, and dyslipidemia (such as neurogranin, YLK‐40, and fatty acid binding protein), and was partially APOE ε4‐independent. The association of a similar polygenic risk score with AD risk was primarily driven by APOE ε4 in participants younger than 80 years, but by other variants outside “classic” AD pathology in older participants. 104 Moreover, a pathway‐specific polygenic risk score based on the activation of immune response was significantly associated with AD risk in older, but not younger, AD participants, suggesting that age may influence the degree to which immune response affects AD risk.
In two independent cohorts, nine inflammation‐associated blood proteins explained ≈10% of the variance in a δ‐homolog, dT2A, 105 , 106 constructed from several cognitive measures as a correlate of functional status. 106 Similarly, a panel of CSF AD‐associated proteins beyond “classic” CSF biomarkers explained 31% of the variance in Alzheimer's Disease Assessment Score (ADAS) 11 score compared to 26% explained by CSF Aβ42 and t‐tau, and was strongly associated with baseline cognition, diagnosis, and cognitive decline. 107 The two sets of biomarkers were largely independent, together explaining 41% of the ADAS11 variance (Figure S14 in supporting information). The most significant AD‐associated proteins were primarily involved in immune response, lipid metabolism, or both (fatty acid binding protein, clusterin, apoE, angiotensin‐converting enzyme, chromogranin A, CD40 antigen, vascular endothelial growth factor, human growth factor, transforming growth factor α, macrophage colony stimulating factor 1). As maintenance of central nervous system lipid metabolism is important for innate immune activation, the conjunction of CSF proteins involved in both processes is consistent with a model in which cognitive and functional deficits associated with the accrual of “classic” AD pathology are modulated by the innate immune system. Both studies suggest that a substantial portion of cognition is explained by factors beyond Aβ and tau.
The established AD risk allele, TREM2, plays an important role in the brain's major innate immune response to pathogens. It encodes triggering receptor expressed on myeloid cells 2 (TREM2), a transmembrane receptor expressed in microglia with multiple functions including phagocytosis of Aβ, cytokine release, and signaling. 108 Rare variants in TREM2 increase AD risk while others in the TREM2 gene cluster have protective effects. 108 The level of soluble TREM2 (sTREM2) in CSF increases across diagnostic groups and is considered a surrogate measure of TREM2‐mediated microglial function. 108 Higher baseline CSF sTREM2 was associated with slower Aβ accumulation, consistent with its role in the promotion of Aβ phagocytosis, and also with lower tau PET uptake in early Braak regions, which may result from its promotion of signaling pathways involved in tau hyperphosphorylation. 109 Across the AD spectrum, higher levels of sTREM2 attenuated the detrimental effects of APOE ε4 on future hippocampal atrophy and decline in memory and global cognition although there was no correlation between levels of sTREM2 and ApoE. 110 Taken together, these results suggest that the increased immune response associated with higher levels of sTREM2 attenuates the negative effect of the APOE ε4 allele and may affect both Aβ accumulation and tau phosphorylation.
Further insight into the association of sTREM2 levels with Aβ and tau came from the stratification of ADNI participants by AT(N) categories (operationalized as Aβ status and a combined tau and neurodegeneration status) within clinical stage (based on Clinical Dementia Rating Sum of Boxes [CDR‐SB] score) to mimic disease progression. 111 Preclinical Aβ deposition was associated with an initial decrease in sTREM2, but subsequent tau pathology or neurodegeneration was associated with increased sTREM2. The early decrease in levels was unexpected given previous findings of increasing levels across diagnostic stage. However, a similar AT(N) staging approach examining a wider range of CSF immune response markers found a similar biphasic pattern of an initial decrease with the appearance of early Aβ pathology and the subsequent increase after the appearance of tau abnormality (Figure S15 in supporting information). 112 This pattern was observed in both the ADNI and PREVENT‐AD (Pre‐symptomatic Evaluation of Experimental or Novel Treatments for Alzheimer's Disease) cohorts, even though CSF immune markers mostly differed between the two cohorts, and despite the overall direct correlation of some of the markers with CSF tau/Aβ42. The mechanisms underlying the initial decrease in immune response are yet to be determined, but these results are consistent with an effect of immune response only after the appearance of both Aβ and tau pathology.
Further support for this framework comes from a study of the protective effect of a rare coding variant (p.P522R) in the gene encoding phospholipase‐C‐γ2 (PLCG2), highly expressed in microglia. 113 Its protective effect on AD risk was mediated by CSF p‐tau181 and was strongest in MCI participants with low CSF Aβ42. Co‐expression analysis identified a network enriched in innate immune system proteins connecting PLCG2 to APOE and TREM2. 113 Taken together, these results support a role for p.P522R in reducing AD risk by mitigating tau pathology through reduction of Aβ‐induced inflammation.
Overall, these studies are coalescing around the model of a key role of innate immune response in AD in which this response exerts its effect after the establishment of both Aβ and tau pathology. The importance of this response is underscored by the strong deleterious or protective effects of AD risk alleles such as TREM2 and PLCG2, and supports the addition of a biologically relevant “immune dysfunction” category to AT(N) staging.
3.4. The role of resilience
ADNI data have been used to study the effects of both cognitive and brain resilience. An elder with high cognitive resilience has better cognitive abilities than would be expected for their levels of AD pathology, whereas an individual with high brain resilience has higher than expected brain structure/function for their levels of AD pathology. 114 Cognitive resilience has been measured in several ways, primarily using years of education as a lifestyle proxy. However, even though education was associated with increased cognition in MCI and AD participants, it did not moderate the effects of CSF Aβ42, CSF tau, or atrophy on cognitive function, suggesting that it may not function as a proxy for cognitive resilience. 115 Similarly, duration of education was not associated with Aβ deposition or brain metabolism in any clinical group and was associated with larger total brain volume only in MCI participants. 116 Different measures of cognitive resilience have better established its impact on AD disease progression. When cognitive resilience was represented by a residual term that captured the difference between observed cognitive performance and that predicted by demographics and brain integrity measures, it predicted decline in executive function only in participants positive for CSF t‐tau/Aβ42. 117 This supports an AD pathology‐dependent effect of cognitive resilience that is not operative in normal aging.
Greater brain resilience, calculated from the difference between the expected and actual amount of cerebral damage (whole brain, temporoparietal, or hippocampal volume, or global WMH volume) of an individual based on their cognition (ADAS‐Cog), was associated with lower risk of progression, and slower decline in both memory and executive function in MCI and CU participants, but with more rapid decline in AD participants (Figure S16 in supporting information). 118 This paradoxical finding may represent a masking effect of brain resilience in the face of the accrual of pathology during CU and MCI, followed by a subsequent rapid decline in AD after a point at which pathology “outpaces” resilience. Participants with high and low brain resilience may reach the endpoint in the same timeframe, explaining the accelerated rate of decline in AD patients with high brain resilience.
If the effect of resilience is specific to AD rather than normal aging, what is its biological basis? As discussed in Section 3.3, CSF proteins with vascular, lipid‐metabolic, and immune system functions explained substantial variance between observed cognitive scores and those predicted by the level of AD biomarker abnormality. 107 These may impact resilience through mechanisms such as the maintenance of brain regions important in cognition, resilience to pathological changes, and resistance to pathological changes (Figure 7). 119 A resilience signature comprising a pattern of higher glucose metabolism in the anterior cingulate cortices and anterior temporal poles was identified in Aβ+ participants aged 80 and older who were cognitively stable for 5 years or more. 119 This signature, but not glucose metabolism, Aβ PET, or cortical thickness in AD‐typical regions, predicted global cognition. Moreover, higher FDG PET uptake in this signature was associated with lower vascular risk, suggesting a role for vascular health in maintaining resilience residing in regions beyond those associated with AD.
FIGURE 7.
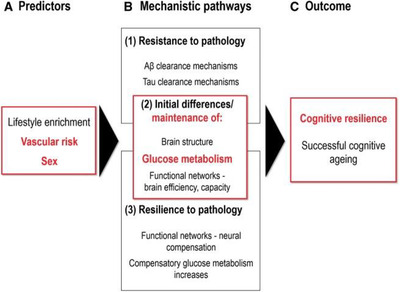
Paths to cognitive resilience or successful cognitive aging. Aβ, amyloid‐β. Reproduced with permission from Arenaza‐Urquijo et al. 119
Resilience may also lie in the maintenance of functional and structural connectivity. In CU participants, greater internetwork functional connectivity primarily between the default mode network and dorsal attention network attenuated the association between Aβ burden and memory decline. 120 The opposite relationship was observed in MCI participants, suggesting that reordering of internetwork connections may compensate for the effects of Aβ deposition early in disease progression but fail in the face of increasing pathology. 120 MCI non‐converters and those without AD pathology had hyperconnectivity between the entorhinal cortex and hippocampus, sites of early Aβ and tau accumulation, whereas MCI converters and those with AD pathology, and AD participants had hypoconnectivity between these regions, supporting a compensatory role for increased regional functional connectivity. 121 Greater global functional connectivity of the left frontal cortex, a major hub within the frontoparietal control network, was associated with better than expected memory in the face of neurodegeneration and so functions as a measure of reserve capacity. 122 Higher between‐ and within‐network connectivity in this region was unaffected by entorhinal tau or Aβ binding but interacted with entorhinal tau PET uptake to attenuate the negative effects of tau on memory performance. 122 Similarly, resilience was associated with preservation of small world network organization in the brain's structural connectome. 123 In Aβ+ CU participants, better‐than‐expected cognitive performance was associated with increased gray matter (GM) volume and WM connections of hub‐like regions. Both studies implicate preservation of structural and functional brain networks as likely mechanisms for resilience.
A large genetic analysis of multiple cohorts including ADNI identified genetic variants and biological pathways associated with a combined resilience metric consisting of educational attainment and residuals of cognitive measures independent of Aβ status. 124 The metric was genetically correlated with educational attainment, a range of neuropsychiatric phenotypes, hormonal traits, and smoking‐related factors, but not with AD or APOE. For example, genetic risk for obsessive‐compulsive disorder, old age at first birth, and at initiation of smoking were associated with high resilience whereas higher age of smoking cessation and cigarettes per day, and attention deficit hyperactivity disorder were associated with lower resilience. Top variants associated with the metric were upstream of ATP8B1 on chromosome 18. ATP8B1 encodes aminophospholipid transferase, an enzyme involved in the bile acid homeostasis in the liver, and additional analysis found that higher levels of two bile acids was associated with lower resilience. Finally, pathway analyses identified molecular pathways involving branched chain fatty acids and dehydrogenases, suggesting that deficits in their metabolism influence resilience. Together, these results suggest key contributors to resilience include educational attainment, vascular and metabolic risk, bile acid homeostasis, and mental health.
These results point to the contribution of vascular, metabolic, or immune‐related factors acting via multiple mechanisms in maintaining cognition in the face of AD pathology until the point of failure, beyond which there is a rapid decline to cognition commensurate with AD pathology.
3.5. Sex effects in AD
Biological sex is a critical variable for consideration in AD. More than 65% of Americans with AD are women 125 and being female is one of the strongest predictors of AD. This increased risk may be caused by genetic factors, exposure to ovarian hormones, environmental factors, differences in resilience, or some combination thereof that contributes to AD‐related pathological changes, 126 although the most significant factor in greater dementia prevalence in women versus men is likely greater life expectancy. ADNI has contributed to understanding of the nature of sex‐related differences in dementia risk, particularly through the availability of tau PET imaging data and serum samples for metabolomics analyses.
MCI participants stratified as being either high or low likelihood for MCI due to AD by CSF t‐tau/Aβ42 showed clear sex differences in cognitive decline over up to 10 years. 127 MCI females at low risk had the smallest rates of decline in cognition but those at high risk far exceeded all other groups in decline (Figure S17 in supporting information). This study also reported an additive effect of sex and the carriage of the APOE ε4 allele on cognition such that female carriers declined faster than male carriers, consistent with previous reports of a greater adverse effect of APOE ε4 in women than men. However, the sex‐specific associations of APOE ε4 with AD‐related markers may vary across diagnostic groups. In CU men but not women, APOE ε4 was associated with smaller hippocampal volume and hypometabolism. There were no sex differences in the associations of this allele at the MCI stage, suggesting that the effects of APOE ε4 manifest themselves at a later stage in women than men. In AD, APOE ε4 was associated with greater Aβ burden in men only. A second study reported that sex modulated the relationship between APOE ε4 and brain tau deposition primarily in the entorhinal cortex, amygdala, and parahippocampal gyrus in MCI participants such that female carriers had a greater susceptibility to the accumulation of neurofibrillary tangles than male carriers. 128 As APOE ε4 is commonly used for participant stratification in clinical trials, failure to account for sex differences in its effect across disease progression may complicate interpretation of results.
Vulnerability to tau deposition may underlie susceptibility to AD in women. The APOE ε4 allele was more highly associated with CSF tau levels in women than in men, suggesting that the sex‐specific effect of APOE on AD risk acts via tau. 129 The availability of tau PET data from ADNI has facilitated studies of the effect of sex on in vivo tau binding. In CU and MCI women but not men, significantly higher tau PET SUVR across multiple cortical regions was associated with faster cognitive decline. 130 Compared to CU men, CU women had higher Aβ‐dependent tau accumulation in primarily temporal regions 130 and increasing Aβ burden was associated with higher tau binding in the entorhinal cortex but not in extratemporal regions. 131 These results suggest that Aβ‐dependent entorhinal cortical tau accumulates in a female sex‐specific manner early in disease progression. It would be expected that this degree of pathology would impact early cognitive decline, but in fact a verbal memory advantage for CU women is well documented and may be related to sex‐specific reserve. Despite higher florbetapir SUVR uptake, CU women had higher verbal memory scores than men, and Aβ+ women had higher than expected verbal memory scores for their level of tau pathology. At autopsy, this sex advantage was observed at the earlier Braak stages I/II and III/IV, but no sex differences in verbal memory were observed at late stages V/VI. Interestingly, sex‐specific differences in tau propagation across the brain were observed using tau‐PET to construct tau connectivity networks. 132 The most striking difference was that widespread tau PET uptake increased from CU to MCI to a much greater extent in women than men. In MCI women, the tau network was dense with a high number of direct connections between individual brain regions and may have developed from differences in network nodes at the CU stage (Figure 8). The maintenance of female verbal advantage despite the more “advanced” tau network in CU and MCI women underscores the importance of reserve in maintaining cognition at the early stages. Eventually, greater numbers of interregional tau network connections may accelerate the spread of tau and explain the faster progression of women from MCI to AD. 132 The APOE ε4 allele may modulate tau accumulation in different regions, although studies have been inconsistent. 130 , 131 , 133 These results suggest that there is not only a female‐specific vulnerability to tau in temporal regions such as the entorhinal cortex, but a female‐specific reserve able to overcome early tau load to maintain verbal memory. Tau deposition and changes in network structure may eventually overcome mechanisms of reserve and lead to a rapid decline in memory, resulting in women “catching up” with men in tau distribution and memory impairment in AD. Hormonal differences may underlie the greater vulnerability to tau pathology in women. Lower testosterone levels were associated with higher CSF p‐tau181 levels, especially in APOE ε4 carriers, regardless of sex. 134 The lower testosterone levels typically found in women may therefore predispose them to pathological tau, and this vulnerability may be worse in female APOE ε4 carriers.
FIGURE 8.
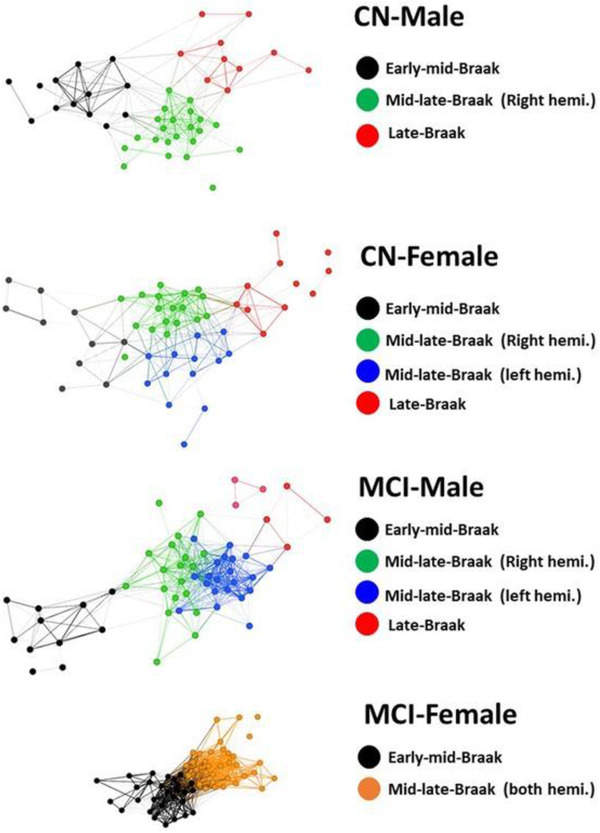
Sex differences in tau‐based brain networks in four subject groups. Each node represents a brain region. The position of each node within the network is determined based on the strength of its PET SUVR correlations with other nodes. Regions that have higher PET correlations with each other than with the rest of the brain congregate to each other as communities depicted with different colors. CN, cognitively unimpaired; hemi., hemisphere; MCI, mild cognitive impairment; PET, positron emission tomography; SUVR, standardized uptake value ratio. Reproduced with permission from Shohouki et al. 132
What are the mechanisms underlying the effect of sex, alone or in combination with the APOE ε4 allele, in disease progression? Framing AD as a metabolic disease, a recent study investigated how these factors affect associations between AT(N) biomarkers (CSF Aβ42, CSF p‐tau181, FDG PET) and metabolites. 135 From 139 blood metabolites tested, the study identified and replicated 8 homogeneous (the same between sexes), 15 heterogeneous (differed by sex), and 3 sex‐specific interactions with AT(N) biomarkers (Figure S18 in supporting information). Metabolites adversely affected in females were predominantly involved in energy metabolism (acylcarnitines, valine, glycine, proline) or energy homeostasis (asparagine, glycine, proline, histidine), suggesting that impaired mitochondrial energy production may play a role in the greater susceptibility of women to AD pathology. Further stratification of participants by APOE ε4 status identified associations of three phosphatidylcholines with pathological CSF Aβ42, acylcarnitine C10 with CSF p‐tau181, and proline with FDG PET in females only, suggesting a molecular basis for the adverse effects of APOE ε4 in females.
Overall, these studies suggest that differential Aβ‐dependent tau deposition, and mechanisms of reserve may contribute to sex differences in disease progression. Failure to account for the effect of these sex differences through disease progression could complicate interpretation of trial data. An additional topic for future research is the interaction between sex differences and aging and the ADNI database provides information that could be used to address this.
4. TESTS FOR AD
Effective testing for AD in an array of settings—clinical, research, or trial—is fundamental to progress in understanding disease progression and treatment. ADNI cohorts have been instrumental in the development, replication, and external validation of improved or new approaches. Many studies have focused on the measurement of brain Aβ, as the initial pathology in the biological definition of AD. This can be detected in vivo as CSF Aβ42, or by Aβ PET. CSF Aβ42 has excellent accuracy, but lumbar puncture is invasive, and MRI or PET scans are expensive and may have limited availability in remote communities. Recent publications have focused on improving traditional measures and developing low‐cost and/or noninvasive alternative measures of Aβ, or reported improved tests for tau or for combinations of pathology. Development of ultrasensitive blood tests for AD has been a particular highlight.
4.1. Improvements to measurement of CSF Aβ and Aβ PET
Although CSF Aβ42 and Aβ PET are highly correlated, 136 they cannot be considered equivalent. CSF Aβ42 measures a soluble form of Aβ, which may reach abnormality in individuals at a different point in disease progression than the cortical fibrillar forms of Aβ detected by Aβ PET. 137 Moreover, Aβ PET uses different radiotracers (11C‐PiB, 18F‐florbetaben, 18F‐florbetapir, or 18F‐flutemetamol) and scans are commonly interpreted using cohort‐specific cut points for Aβ status. Underscoring these differences, examination of simultaneous longitudinal trajectories of Aβ PET and CSF Aβ42 suggested that the CSF measure becomes abnormal prior to abnormality on Aβ PET, but that abnormality on Aβ PET better predicts cognitive decline. 138
The false equivalence of Aβ status determined by a variety of methods can hamper the development of prediction models, and therefore the development of a set of universal and generalizable thresholds for Aβ positivity in both methods of measurement is crucial. The CL method enables the direct comparison of Aβ radiotracers by representing tracer SUVR on a 0 to 100 scale. 139 Two inflection points in Aβ deposition were observed in a study deriving optimal CL thresholds in CU participants. 64 The first at 12 CL predicted CSF Aβ42 positivity and may represent the early transition to subtle Aβ pathology, and the second near the threshold established by visual raters at ≈30 CL predicted CSF tau/Aβ42 and is consistent with the transition to widespread Aβ pathology. Multi‐tracer staging models of Aβ binding may also circumvent the use of cohort‐specific global SUVR cutoffs and detect subthreshold Aβ abnormality. 34 , 36
The measurement of CSF Aβ42 is affected by pre‐analytical and analytical variables, an issue partially overcome by the ADNI Biomarker Core's use of the Roche ElecSys platform. CSF immunoassays of Aβ42, p‐tau181/Aβ42, and t‐tau/Aβ42 using this platform predicted decline in MMSE and progression to AD. 140 Global cutoffs were established for their concordance with Aβ PET SUVR‐based classification. 141 These were transferable across independent cohorts despite different PET tracers, patient populations, pre‐analytical protocols, and other variables; had a high concordance with Aβ PET classification; and predicted 2‐year clinical decline in MCI individuals. CSF biomarkers measured using the ElecSys platform and dichotomized with these cut points may therefore obviate the need for costlier and less accessible Aβ PET.
4.2. Low‐cost and/or non‐invasive approaches for the determination of Aβ status
In the United States, an estimated 14.9 million patients aged 55 and over with MCI due to AD may be eligible for an anti‐Aβ therapy, should one be approved, a number representing a huge screening challenge. 142 Low‐cost and/or non‐invasive tests for Aβ status may circumvent drawbacks of CSF and PET assessments.
Several externally validated algorithms using readily available clinical information were designed to function as a primary care prescreen funneling high‐risk patients toward CSF or PET confirmation of Aβ status. 143 , 144 , 145 A practical algorithm based on age, APOE ε4 status, and a cognitive test of immediate recall achieved moderate predictive ability (ares under the curve [AUC] of ≈0.7 across three cohorts) and was estimated to identify between 0.1 and 3.4 million Aβ+ patients in the potential eligible US population, while at the same time preventing from 1.0 to 2.8 million negative Aβ CSF or PET confirmatory tests. 143 A similar algorithm was estimated to reduce screening PET scans for clinical trial enrichment by ≈23%, a savings of > US$25 million based on the enrollment of a cohort of 1000 Aβ+ MCI individuals. 145 Beyond readily available clinical information, MRI scans collected in routine screening may offer an alternative noninvasive method for determining Aβ status. A classifier based on features selected from T1 MRI and DTI was estimated to eliminate 60% of unnecessary confirmatory PET or CSF tests in the enrollment of CU participants, reducing overall trial costs by 47%. 146 Other ADNI studies have developed models using demographics, APOE ε4 status, cognition, ‘omics data, MRI features, and other factors (Table S1). Plasma assays for Aβ are described in the following section.
4.3. Blood tests for AD
Perhaps the most exciting and impactful recent ADNI studies have concerned the development of blood tests for AD. Detection of AD pathology in blood is far more challenging due to the much higher concentration of non‐AD proteins, but improvements in ultrasensitive assay technology now allow us to find and measure the proverbial needle in a haystack. ADNI's large, well‐characterized cohort with available longitudinal plasma samples has played an outsize role in accelerating discovery and validation of plasma assays for AD. Vive la revolution!
A substantial body of work now supports the ability of ultrasensitive plasma Aβ immunoassays and mass spectroscopy assays to accurately and detect brain Aβ (reviewed in Ashford et al. 147 ). Blood samples from ADNI CU and MCI participants were used to validate a model developed in the Swedish BioFinder study that combined age, APOE groups, a cognitive test (10 word list delayed recall), and plasma Aβ42/40 to predict individual brain Aβ (AUC of 0.83). 148 Although plasma Aβ42/40 improved prediction only slightly, the model was calculated to reduce the number of unnecessary Aβ PET scans by ≈90% in a clinical trial requiring assessment of brain Aβ for enrollment. Plasma Aβ42/40 alone accurately predicted brain Aβ (AUC of 0.80 to 0.87) in a systematic assessment of blood biomarkers and clinical information, and the subsequent addition of APOE genotype or MRI features further improved prediction. A blood‐based signature of CSF Aβ42 developed in ADNI CU and MCI participants consisted of plasma Aβ42 and three additional plasma proteins, age, and APOE genotype (AUC of 0.80). 149 An ongoing study funded by the Biomarkers Consortium of the Foundation for the NIH will compare a number of different immunoassays and mass spectroscopy methods for measurement of plasma Aβ40 and Aβ42. 150
As the AT(N) biological construct for AD requires not only Aβ, but tau abnormality, a blood biomarker that correlates with both pathological proteins and thus predicts AD is somewhat of a Holy Grail of AD research. Several ADNI studies used an ultrasensitive single molecule array (Simoa‐Quanterix) assay to measure plasma p‐tau181 and to investigate its associations with Aβ and tau pathology, 151 , 152 and its ability to predict AD. 153 As a predictor of Aβ status, plasma p‐tau181 has variable results across studies and appeared more predictive in MCI and AD than CU participants. This biomarker alone was a moderate predictor of Aβ status (AUC of 0.67) in MCI but not CU in one study; an accurate predictor in combination with age and sex in MCI (AUC of 79.9) but not CU (AUC 70.4) in a second study (Figure S19 in supporting information); 153 and in a third study was associated with both Aβ and tau pathology measured by PET most strongly in MCI and AD, but also in CU participants. 151 Baseline levels of plasma p‐tau181 were strongly associated with widespread Aβ deposition in MCI and AD participants (Figure 9a). 151 Moreover, weaker associations were detected in CU participants with subthreshold Aβ deposition in sites of early Aβ accumulation (precuneus and temporal and superior frontal regions; Figure 9a). 151 Longitudinal and, to a lesser degree, baseline plasma p‐tau181, was also associated with an AD‐typical pattern of widespread cortical tau aggregation 6 years later (Figure 9b). 151 Like CSF p‐tau181, the plasma biomarker reached abnormality ≈6 years after measures of Aβ. 151 Plasma p‐tau181 increased with worsening diagnostic status, and predicted MCI to AD progression, cognitive decline, and hippocampal atrophy. 153 These results validate plasma p‐tau181 as a biologically relevant biomarker that accurately reflects both Aβ and tau pathology. It may therefore both fulfill a need for a rapid and cost‐effective “first pass” test of AD in primary care that could identify patients requiring further, more expensive diagnostic tests, and enable the identification of individuals at high risk of AD for clinical trials. In addition to p‐tau181, there is considerable excitement concerning other species of phosphorylated tau such as p‐tau217. 154 As assays for p‐tau181, p‐tau217, and possibly others become more widely available, head‐to‐head comparison studies will become possible.
FIGURE 9.
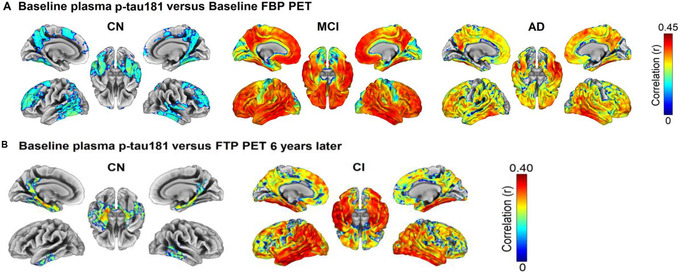
Regional associations of plasma p‐tau181 with Aβ and tau PET. A, Regional associations between baseline plasma p‐tau181 levels and baseline Aβ PET SUVR. B, Regional associations between baseline plasma p‐tau181 levels and tau PET 6 years later. Color panels on the right display Pearson correlation coefficients ® of the effects on global measures. AD, Alzheimer's disease; CN, cognitively unimpaired; CI, cognitively impaired; MCI, mild cognitive impairment; FBP, florbetapir (Aβ) PET; FTP, flortaucipir (tau) PET. Reproduced with permission from Moscoso et al. 97
Neurodegeneration is the final requirement in the biological staging of AD. NfL reflects axonal injury and can be measured in blood by immunoassays. Plasma NfL levels increased linearly across diagnostic groups 70 , 155 and were higher in Aβ+ than Aβ– participants. 70 Longitudinal NfL changes were associated with longitudinal changes in a wide range of AD measures (CSF, FDG PET, GM and WM volumes, ADAS‐Cog) increasing differentially across diagnostic groups in a manner consistent with disease progression. In CU participants, longitudinal NfL was more strongly associated with “early” pathological features such as low hippocampal volume and lower CSF Aβ42, whereas an association with ADAS‐Cog was predominant in AD participants. 70 Distinct NfL trajectories were observed in participants stratified by AT(N) status, CSF Aβ42 status, CSF p‐tau181 status, or the status of a temporal cortical atrophy composite (Figure S20 in supporting information). 70 Plasma NfL was associated with AD‐typical regions of Aβ PET uptake in CU but not in MCI participants, and of tau PET uptake in MCI but not CU participants. 155 In CU participants, plasma NfL was associated with hippocampal and frontal lobe atrophy in APOE ε4 carriers only, whereas in MCI participants, was associated with widespread GM atrophy regardless of APOE ε4 status. 155 These differential associations of plasma NfL with AD markers at distinct diagnostic stages suggest that it may be a marker of Aβ‐related neuronal injury prior to symptom onset, but of tau‐related neuronal injury when cognitive impairment becomes apparent. As such, plasma NfL may be a cost‐effective marker with which to monitor effects on neurodegeneration in disease‐modifying drug trials.
Could plasma markers of AT(N) replace the equivalent CSF markers or PET for the prediction of future decline? The ability of plasma Aβ42/40, p‐tau181, and NfL to predict progression of MCI participants to AD in 4 years or decline in MMSE in MCI participants over the same timeframe was systematically studied in the BioFINDER and ADNI cohorts. The best performing models included p‐tau181 and NfL, but not Aβ42/40, likely reflecting the tighter association of tau than Aβ with cognition. This combination of plasma biomarkers improved the 4‐year prediction of MCI to AD dementia progression over a base model of age, sex, education, and baseline MMSE and was comparable to a model including CSF Aβ42/40, p‐tau181, and NfL (AUCs of 0.88 to 0.89 in replication, and 0.73 to 0.79 in external validation). This model was operationalized as an online tool available at predictprogression.com that provides an individualized 4‐year prognosis for MCI to AD dementia progression or MMSE decline.
Other factors in blood associated with Aβ or tau pathways or with additional contributors to disease progression, were reported to have predictive value. Plasma‐based expression of genes predominantly related to vascular structure/functioning and immune system response predicted diagnosis, clinical progression, and decline in executive function and memory, and was associated with Aβ, tau, and infarcts. 24 Similarly, the expression of AD‐related genes enriched with inflammation, Wnt signaling, and mitochondrial pathways discriminated AD from CU patients (AUCs of up to 0.86). 156 A brain metabolite signature of AD had a similar accuracy for the same classification challenge, and a subset of four sphingomyelins were associated with increased risk of progression in CU individuals. 157 The selected lipids were involved in pathways that are directly related to AD pathology such as tau phosphorylation and Aβ metabolism, but also in apoptosis, acetylcholine biosynthesis, and calcium homeostasis. An expanded lipidomics platform allowed the characterization of a lipid signature of AD that improved both the diagnosis of AD dementia and prediction of future onset of AD dementia over a base model of age, sex, BMI, and APOE ε4 genotype. 158 The 10 most predictive lipids included ether lipids, and sphingolipids previously associated with AD as well as phosphatidylethanolamines and triglycerides associated with cardiometabolic disease. Long chain polyunsaturated fatty acid containing triglycerides were associated with MCI and AD, hippocampal volume, and entorhinal cortical thickness, and were more highly associated in APOE ε4 carriers. 159 Finally, a peripheral signature of AD risk containing plasma markers of cardiovascular health, immune and inflammatory systems, hormone levels, and lipid metabolism outperformed brain features when combined with CSF biomarkers to predict diagnostic progression. 160 These approaches offer complementary information to plasma AT(N) biomarkers and have the potential to fine‐tune the prediction of future decline. They may be particularly relevant if additional categories reflecting, for example, vascular or immune system dysfunction were added to AT(N) staging.
5. DEVELOPMENT OF TOOLS TO IMPROVE CLINICAL TRIALS AND CLINICAL PRACTICE
The structure of ADNI as a simulated clinical trial with clearly defined inclusion and exclusion criteria and a wealth of longitudinal data and samples has made it an ideal testing ground for novel approaches to improve clinical trials and to fulfill its primary objective. As an ancillary benefit, ADNI data have also been used in studies aimed at improving patient diagnosis and management in clinical practice. In many cases, these improvements are informed by knowledge gained from the disease progression studies described in previous sections.
5.1. Clinical trials of prodromal AD
A substantial proportion of clinical trials are targeted at nondemented but symptomatic MCI participants. The design of the ADNI study has enabled the simulation and quantification of various approaches for more targeted participant selection and outcome measure refinement and for overcoming other trial challenges.
Prodromal AD trials commonly incorporate a biomarker of Aβ as an inclusion criterion, in keeping with its position as the earliest AD biomarker, but the choice of CSF or PET biomarker may be crucial. Low CSF Aβ42 as an eligibility criterion enrolled 15% more MCI participants than Aβ PET, consistent with disease progression studies positioning this CSF biomarker abnormality earlier than the cut point for cortical Aβ burden. 63 However, few clinical trials of MCI have broadened selection criteria to include additional AT(N) biomarkers, which could target an expanded pool of participants likely to benefit from intervention. An alternative selection criteria of high CSF p‐tau181/Aβ42 or p‐tau181 was estimated to enroll an additional 15% of MCI participants over CSF Aβ42 alone. 161 Furthermore, machine learning–based selection of MCI participants using a combination of Aβ PET, CSF biomarkers, FDG PET, and MRI volumes in an externally validated model reduced sample sizes to detect a treatment effect by 50% to 75% over selection with Aβ PET alone, depending on trial power, duration, and cognitive outcome measure. 162 These studies therefore suggest that AT(N) biomarkers can select a broader pool of participants further along the AD continuum with a high likelihood of decline than Aβ alone.
Determining the timeframe of progression to AD is important for clinical trial design. Faster neurodegeneration might be expected to lead to earlier diagnostic progression, but a recent study suggests otherwise. 163 Using 10 years of follow‐up ADNI data, both baseline global and regional volumes, and annual change rates in the same regions significantly predicted time to AD progression but atrophy rate depended on baseline volume. For example, all MCI participants with low baseline hippocampal volumes converted to AD within 3 years, but in those with high baseline volumes, the rate of hippocampal atrophy determined time to progression (Figure S21 in supporting information). Consideration of baseline volume may therefore improve detection of a treatment effect in clinical trials that use reduction in atrophy rate as an outcome measure.
Other issues may affect the ability of a clinical trial to detect a treatment effect. The ADAS test is a common outcome measure used in clinical trials of MCI and AD, but it is susceptible to practice effects which manifest as a stable or improved score instead of a declining score over time. A meta‐analysis of 18 clinical trials and observational studies reported that more than half of MCI participants and more than a third of AD participants had practice effects in ADAS, resulting in an increase in the estimated sample size per arm to detect a treatment effect of up to 35%. 164 Failure to account for practice effects in clinical trial design may therefore result in underpowering. Another common issue is whether to include or exclude observations from the up to 10% of MCI placebo patients who initiate AD medications such as donepezil or memantine after the start of the trial. Modeling the use of medications in ADNI as a simulated trial revealed that MCI participants who began concurrent medication were at a more advanced stage and declined faster despite treatment than those who did not. Excluding these participants would result in a placebo arm that declined more slowly and was not representative of the trial population, decreasing the power to detect treatment effects.
5.2. Clinical trials of preclinical AD
AD clinical trials aimed at targeting Aβ pathology in the preclinical phase have posed numerous challenges regarding the selection of asymptomatic participants and the development of outcome measures able to detect a treatment effect. ADNI studies have capitalized on knowledge gleaned from disease progression studies to detect the earliest Aβ deposition and subtle changes in memory, and to characterize how these changes predict progression to symptom onset. A multi‐cohort study 165 of preclinical AD participants designed to update clinical trial assumptions estimated that the average time to progress to MCI was 6 years, and that to detect a 25% treatment effect with 80% power would require 2000 participants per arm. Likewise, a stochastic model developed using ADNI data that took into account the rates of CU to MCI and MCI to AD dementia progression, and the rates of withdrawal from clinical trials at each diagnostic state provided guidance for clinical trial design. 166 The model suggested that treatments of moderate efficacy would require trial durations of at least 5 years, and that trials in CU individuals would be more successful when treatments are effective immediately. However, this preliminary model did not examine participant selection strategies or surrogate outcome measures that can substantially increase the power trial to detect a treatment effect. Both studies suggest that clinical trials of preclinical participants would need to be lengthy and large to succeed.
Subthreshold regional cortical Aβ accumulation in the precuneus and posterior cingulate cortex was calculated to reduce sample sizes by ≈60% over global Aβ PET SUVR in CU Aβ– participants enrolled in a primary prevention trial. Estimated sample sizes for a secondary prevention trial enrolling CU Aβ+ participants were similar using both selection criteria, suggesting that the early Aβ composite may be valuable in trials of participants with minimal Aβ deposition and accumulation over the trial timeframe. A pattern of WMHs across the superior frontal and parietal regions was associated with future Aβ accumulation and may offer a practical alternative to identifying early Aβ accumulators without the need for an Aβ PET scan or lumbar puncture. Finally, an Aβ PET‐based regional staging method 167 better predicted progression from CU to MCI than binary cortical Aβ (hazard ratio of 4.8 for the highest stage compared to 3.1 for binary Aβ; Figure S22 in supporting information).
Predicting the time to onset of symptoms or diagnostic progression in CU individuals, rather than predicting progression within a certain timeframe, is also a challenge given the extended preclinical AD phase. Such a tool would allow the enrollment of participants who are most likely to convert to MCI within the duration of a clinical trial. Structural MRI measures in the posterior cingulate, lateral temporoparietal cortex, and prefrontal cortex combined with rs‐fMRI connectivity features within the default, salience, and limbic networks predicted > 20% of the variance in estimated time to symptom onset in participants with a parental history of AD in the PREVENT‐AD cohort and years to diagnostic progression in ADNI participants. 168
Early cognitive decline in PACC increased risk for progression to MCI and worsening function, 169 and was associated with faster Aβ accumulation and entorhinal cortical thickening 170 in preclinical AD individuals, demonstrating its “clinical meaningfulness.” Even more subtle cognitive decline linked to subthreshold Aβ accumulation may offer an alternative to CSF Aβ42 or Aβ PET in determining Aβ status. Poor baseline performance on either the PACC or ADNI‐Mem cognitive tests was associated with increased odds of progression to Aβ positivity in CU Aβ– participants. 171 A particularly sensitive measure of subtle cognitive decline may be “process” errors such as an increased susceptibility to interference, a greater frequency of intrusion errors in the delayed recall test, or a flattening of the learning slope. 172 Process errors, particularly word list intrusion, better predicted progression to MCI than existing criteria for subtle cognitive decline, 172 , 173 predicted worsening CDR scores, 173 and were associated with changes to CSF biomarkers. 172 Variability in an individual's performance across multiple measures or in a single testing session may be another indicator of early cognitive changes. Increased intra‐individual variability was associated with elevated odds of progression to MCI comparable to CSF biomarkers, 174 and with lower WM integrity in multiple brain regions, 175 increased hippocampal and entorhinal cortical atrophy, 176 and functional decline. 176 Intra‐individual variation may therefore be a sensitive measure of future decline that is not confined by cognitive measurements against population averages.
Early neuropsychological breakdown may also be indicated by self‐reported and study partner–reported subjective memory concerns (SMCs; measured by the Everyday Cognition test). In CU individuals, baseline study partner SMCs outperformed the self‐report measure in predicting baseline cognition and cognitive decline across multiple domains. 177 In Aβ+ CU individuals, baseline self‐report and study partner Everyday Cognition test scores both predicted decline in ADAS13, but study partner reporting became increasingly predictive over time, likely reflecting decreasing self‐awareness of the participant, and increasing awareness of functional difficulties by the study partner. 178 Similarly, baseline self‐report Everyday Cognition test outperformed study partner reporting in the prediction of diagnostic progression of preclinical participants to MCI. 177 In this group, self‐report SMCs were associated with tau binding in frontal regions involved in conscious thought, whereas study partner SMCs were associated with tau binding in parietal regions linked to memory concerns likely apparent to an observer. 179 Study partner and self‐report SMCs may therefore provide complementary information and be practical screening tools to identify CU participants, particularly those with Aβ pathology, at risk of future cognitive and clinical decline.
Tau PET is a potential surrogate outcome measure for preclinical trials in which cognitive endpoints are difficult to measure as Aβ‐dependent tau deposition is closely linked to cognitive decline. However, preclinical tau accumulation is typically a slow process occurring over many years and its measurement is difficult in a clinical trial timeframe, requiring a large sample size to achieve the necessary trial power. The enrollment of CU participants with global Aβ PET CL of > 68 CL, a level of Aβ deposition usually associated with MCI and AD participants, reduced sample sizes nearly 10‐fold over CU participants with Aβ PET CL of between 22 and 67 for a trial with an AD meta‐ROI in tau PET as an outcome measure.
5.3. Assessing an individual's risk of progression
The ability to predict an individual's risk of clinical progression in non‐demented patients is highly desirable. This differs from simply testing for AD in that it does not predict AD pathology, but rather the probability of progression within a given timeframe, a difficult challenge given the heterogeneity of disease courses and biomarker levels. Numerous studies have capitalized on ADNI's longitudinal data set, now spanning 15 years, to develop or validate a variety of prognostic approaches, some grounded in the AT(N) biological construct, and others exploring the predictive ability of additional contributing factors. ADNI has also been instrumental in the external validation of prediction models, a crucial step in the development of clinically applicable techniques that must be generalizable across diverse populations and cohort designs, and for different biomarker measurements and methods. 180
An 11‐year follow‐up study of ADNI MCI participants found that individual CSF biomarkers, imaging measures, and cognitive tests predicted clinical progression to AD. 181 As in participant selection for clinical trials, a broader range of biomarkers reflecting AT(N) outperformed Aβ positivity alone, which was not highly predictive with one third of Aβ+ MCI remaining stable throughout the study timeframe. 181 Participants with MTL atrophy, AVLT impairment, and an abnormal CSF t‐tau/Aβ42 ratio had the highest hazard ratio of 15.1 for progression, and progressed to AD within a median of 1.3 years compared to > 11.5 years for those in the normal range for these risk factors, suggesting that combinations of AT(N) biomarkers provide complementary information. 181 A similar prognostic model comprising age, sex, MMSE, CSF Aβ42, CSF p‐tau181, and hippocampal volume as continuous rather than dichotomized markers was externally validated across several cohorts including ADNI. 182
A previously developed AT(N) model that stratified MCI participants by percentile into those with good, very good, poor, or very poor prognoses was externally validated across several single‐center and multi‐center cohorts including ADNI and outperformed models based on demographics, hippocampal volume, or CSF biomarkers alone (Figure 10). 183 This model was operationalized into a spreadsheet calculator intended to facilitate personalized medicine that takes into account the platform used for CSF analysis and method used to calculate hippocampal volume and provides an estimate of the probability of progression to AD dementia based on individual risk factor availability (more information at: https://www.alzheimercentrum.nl/professionals/adappt‐contact).
FIGURE 10.
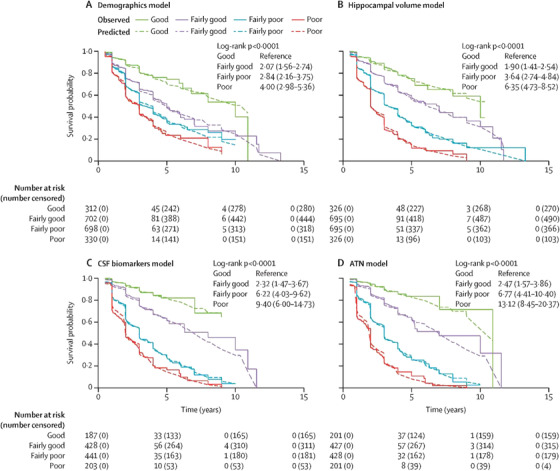
Survival curves for biomarker‐based models of decline. Observed progression is analyzed by Kaplan‐Meier whereas predicted progression is analyzed with Cox models. Findings are based on data from four cohorts. ATN, amyloid, tauopathy, and neurodegeneration; CSF, cerebrospinal fluid. Reproduced with permission from van Maurik et al. 183
Factors beyond AT(N) contribute to disease progression, and therefore their inclusion may improve prediction. Two studies focused on developing practical tools for clinical screening that included measurements reflecting vascular injury. The first tested the use of not only hippocampal atrophy, cortical atrophy, and ventricular enlargement but small vessel disease in MCI diagnostic progression. 184 Each imaging factor was quantified visually and combined in a comprehensive visual rating scale that outperformed individual subscales. This method has the advantage of requiring only brain MRI, which may be routinely acquired, and may funnel individuals toward more expensive or invasive confirmatory analyses. A second study calculated the 10‐year absolute risk of developing AD based on a simple model consisting of age, subjective memory decline, the need for assistance with finances or medication, and a history of symptomatic stroke. 185 This model was developed in the Rotterdam study and externally validated in two cohorts including ADNI, and assigned overall risk based on scores in each component factor, making it suitable as an initial screening test in primary care (Figure S23 in supporting information). An extended model that added APOE status, cognitive scores, and imaging data improved prediction and was intended for interpretation by neurologists in specialized clinical care. Given the highly educated, predominantly European composition of the ADNI cohort, it must be noted that these results may not be generalizable to the wider population.
5.4. Methodological improvements to automated diagnosis and prognosis
Automated diagnostic approaches that use machine learning algorithms, in particular deep learning strategies, 186 to extract and combine information from multiple modalities have the potential to aid clinicians in making an accurate and timely diagnosis of AD. However, barriers remain to their incorporation into clinical practice including a lack of objective comparison of methods and a lack of reporting of classifier generalizability in external cohorts. Although many studies have used the ADNI data set to test or validate their machine learning approaches (reviewed in Veitch et al. 6 ), it has been difficult to objectively compare results because of differences in patient subsets, imaging preprocessing pipelines, feature selection and machine learning methods, statistical methods for cross‐validation, and reported metrics. Two recent works have sought to overcome some of these barriers. Longitudinal atrophy rates measured using MRI are powerful predictors of future decline. A multi‐atlas automated segmentation method applied to baseline and follow‐up MR images was used to develop a morphometry database that removes some of the variability in image preprocessing. 187 This database is available to the research community to allow direct comparison of MRI‐based machine learning frameworks. Another issue with publicly available data sets is their continual incorporation of new participants whose images may be processed using updated methods. A framework that accounts for new participants, and additionally uses a modular set of preprocessing pipelines and feature extraction methods was developed to allow the reproducible evaluation of machine learning algorithms for AD prediction. 188 MRI and FDG PET data were automatically converted into a standard format using this framework, which enabled comparison of the influence of methodological differences and the two imaging modalities across multiple cohorts. Classifiers developed using this framework were generalizable to external cohorts and the framework is publicly available at: https://gitlab.icm‐institute.org/aramislab/AD‐ML.
A lack of transparency of automated methods that produce a prediction without providing information on underlying diagnostic decisions to the clinician can also hinder its clinical use. A deep‐learning strategy that predicted AD status from non‐imaging data such as demographics and MMSE score, or MRI data, or a combination of both, generated interpretable visualizations of the probability of AD in a cerebral morphology map 189 (Figure S24A in supporting information). Models were developed in ADNI and validated across three independent cohorts, consistently outperforming diagnoses by clinical neurologists (Figure S24B). The generalizability of the framework and its presentation for neurologists as an intuitive graphic interface address key issues with automated clinical diagnosis.
Several MRI‐based automated diagnostic approaches have been validated in ADNI. Morphological metrics such as gyrification index and cortical thickness selected from surface‐based morphometry distinguished MCI from CU participants with ≈80% accuracy, improving classification over volumetric measures alone. 190 The addition of DTI features from diffusion MRI representing the structural connectome selected using a novel feature ranking method improved the same classification challenge over T1‐weighted MRI (AUC of ≈0.67). 191 The selection of top diffusion MRI features varied considerably between cohorts, and models based on the overlap between cohorts were more generalizable, emphasizing the need for external validation of diagnosis models. Last, spatial patterns of functional connectivity selected using multivariate pattern analysis from rs‐fMRI data were used to construct an extreme learning machine classifier for the automated discrimination of AD and MCI versus CU across two cohorts. 121
Combining multiple modalities is a popular approach for predicting MCI to AD dementia progression because of the complementary information that each modality provides. However, it suffers from a lack of applicability to clinical settings in which the assembly of different fluid and imaging biomarkers is challenging. Therefore, constructing multimodal classifiers based on a minimum number of inputs that are generalizable across populations may help make automated classification a viable alternative to neurologist‐based diagnosis. The Characterizing Alzheimer's disease Risk Events (CARE) index is an individual score based on sMRI, rs‐fMRI, and cognitive tests that staged participants across disease progression without the need for CSF biomarkers. A classifier based on this index was developed in ADNI and validated in a clinical single‐center study, predicting MCI to AD progression in 3 years with high accuracy. 192 Finally, an MRI‐based deep learning time‐to‐event model that was developed and validated in ADNI and Australian Imaging, Biomarker & Lifestyle Flagship Study of Ageing, accurately predicted MCI progression to AD, and was improved with the addition of APOEstatus, and demographic and cognitive variables. 193 Recent internally validated diagnostic and prognostic models developed using ADNI data are briefly described in Table S2.
6. ADDRESSING ETHNOCULTURAL DIFFERENCES IN AD
Although AD disproportionately affects ethnoculturally diverse populations (e.g., Latina/o, Black/African American), these populations have been underrepresented in AD research. A meta‐analysis of nine data sets from major clinical cohort studies including ADNI 194 reported that their participants were 79.3% White, 11.5% Black, 5.6% Latina/o, 2.7% Asian, and 0.8% Native American. This poses a major challenge as results may not be generalizable to wider populations. This issue particularly applies to ADNI as its cohort (e.g., primarily non‐Latina/o White, highly educated, few comorbidities) is highly selected as the study is designed to resemble an AD clinical trial with strict inclusion and exclusion criteria. Therefore, ADNI results alone must be interpreted with the caveat that they may have limited external validity for more diverse populations.
Of the limited available research on ethnocultural differences in AD, ADNI participants have been included for non‐Latino/a White comparison groups. For instance, a study that compared a Caribbean Latina/o cohort to a cohort of non‐Latina/o, including ADNI participants, found that although the APOE ε2 allele was protective and the APOE ε4 allele increased AD risk in both cohorts these effects were substantially smaller in the Caribbean Latina/o compared to the non‐Latina/o White cohort. 195 Local European ancestry (vs. African ancestry) at APOE was associated with increased AD risk, after adjusting for the ε2, ε3, and ε4 alleles, supporting the contribution of additional genetic variation at this locus. 195 Similarly, haplotypes linked to the APOE ε4 allele differed between Asian, African, and European populations and conferred differing susceptibility to AD, 196 and combinations of race (Korean vs. European) and APOE status affected regional and whole brain atrophy. 197 Carriage of the APOE ε4 allele affected Aβ SUVR cut points for positivity in non‐Hispanics more than Hispanics. 198 Cardiovascular risk factors differentially affected cognition in Latina/o versus non‐Latina/o White adults, such that hypertension and obesity were not associated with poor memory in either cohort but were associated with poorer executive function only in the Latina/o group. 199 Further studies are required to uncover the biological and sociocultural mechanisms underlying these effects and to determine how ethnocultural factors may impact clinical trials.
With regard to international research, the Japanese ADNI study has enabled comparison of regional variation in Asian and North American populations and to examine the feasibility of international trials. 200 , 201 Despite the possible impact of cultural differences on functional end measurements 200 and differences in APOE ε4 allele frequency, MCI participants in both J‐ADNI and North American ADNI had similar levels of Aβ positivity, and decline in cognitive or functional measures. The finding that ADNI biomarkers are generalizable to this Asian population is an important step toward the international harmonization of clinical trials in AD.
7. CONCLUSIONS
Since its inception, the overall goal of ADNI has been to validate biomarkers for AD clinical trials. This goal has been met by validating MRI, FDG PET, Aβ PET, tau PET, and CSF measures of Aβ and tau. ADNI data have been widely used by academic groups and pharmaceutical companies to design and statistically power clinical AD trials. As this review shows, the publicly available ADNI data set has been used as a sample of convenience to investigate the use of biomarkers to predict and monitor cognitive decline across the AD continuum from CU to MCI to dementia. Data‐driven models of disease progression constructed from imaging, cognitive, and gene expression data largely recapitulated the ordering of biomarkers proposed by Jack et al., 18 highlighted the very early transition to abnormality of certain biomarkers, and elucidated underlying molecular pathways. Subthreshold, declining Aβ may be an early marker of future decline linked to subtle memory dysfunction. Tau PET data helped elucidate patterns of tau accumulation tied to antecedent Aβ deposition. Genetic analyses identified distinct gene sets underlying amyloidosis, and tau deposition and neurodegeneration. Stratification of ADNI participants using the AT(N) biological construct of AD identified multiple possible trajectories of biomarker abnormalities, but issues with the non‐equivalence of biomarkers within each category remain to be resolved. Subgroups of all diagnostic classes were identified based on cognition, MRI, and blood proteins and metabolites and differed in associations with cognitive domains, AD biomarkers, and underlying genetics and biochemistry, supporting their biological coherence. Additional factors modulating disease trajectory included cerebrovascular disease acting to exacerbate AD by multiple mechanisms, microglial associated innate immune response and inflammation, cognitive and brain reserve, and sex differences. Additional common co‐pathologies may modulate disease progression but further neuropathological studies are required to understand their influence.
Taking into account these often interacting factors in the selection of participants may improve clinical trials. The determination of Aβ status will certainly be improved by methodological changes to PET and CSF and plasma assays as well as the development of practical algorithms based on clinical information. Other improvements to clinical trials hinge on the more nuanced understanding of disease progression and included fine‐tuning of selection tools, determining the time frame of progression, and modifications to outcome measures. An explosion of interest in plasma biomarkers led to ADNI studies of plasma Aβ, p‐tau181, NfL, and others, suggesting that future studies will use the ADNI biofluid repository to investigate and compare additional biomarkers such as p‐tau217 and various analytical methods. ADNI data were widely used to validate various image processing and analysis methods.
A major limitation of ADNI is its strict inclusion and exclusion criteria that have resulted in a highly educated largely European cohort with few comorbidities. ADNI participants are not representative of the wider general population and therefore the studies using ADNI data described in this review may not necessarily ensure generalizability. A smattering of studies using ADNI as a control cohort highlighted ethnocultural differences that must be investigated further. One goal of a renewal application to the NIA, called ADNI4, to be submitted in October 2021, will be to increase generalizability by reducing the exclusion criteria (e.g., allowing more cerebrovascular disease), increasing the ethnocultural diversity of newly enrolled participants, and recruiting individuals with lower levels of education. Finally, ADNI samples including genetics, CSF, and plasma can be requested here: http://adni.loni.usc.edu/data‐samples/access‐data/.
CONFLICTS OF INTEREST
Dr. Veitch was supported for the present work by NIH grant U19‐AG024904 and has no other support or conflicts of interest to declare. Dr. Weiner is the principal investigator of NIH‐funded grants. Over the past 36 months he received funding administered through his institutions (NIH grants: 1RF1AG059009‐01 and 1R01AG058676‐01A1; CA Dept. of Health grant: 19‐10616; NIH Subaward from Dr. Richard Gershon: 1U2CA060426‐01), consulting fees (Cerecin/Accera, Inc., BioClinica, Nestle/Nestec, Roche, Genentech, NIH, The Buck Institute for Research on Aging, FUJIFILM‐Toyama Chemical [Japan], Garfield Weston, Baird Equity Capital, University of Southern California [USC], Cytox, and Japanese Organization for Medical Device Development, Inc. [JOMDD], and T3D Therapeutics), and payment for lecturing (The Buck Institute for Research on Aging). He holds stock options in Anven, Alzheon, and Aleca. He receives other grant support for his work (NIH: 5U19AG024904‐14; 1R01AG053798‐01A1; R01 MH098062; U24 AG057437‐01; 1U2CA060426‐01; 1R01AG058676‐01A1; and 1RF1AG059009‐01, DOD: W81XWH‐15‐2‐0070; 0W81XWH‐12‐2‐0012; W81XWH‐14‐1‐0462; W81XWH‐13‐1‐0259, PCORI: PPRN‐1501‐26817, California Dept. of Public Health: 16‐10054, U. Michigan: 18‐PAF01312, Siemens: 444951‐54249, Biogen: 174552, Hillblom Foundation: 2015‐A‐011‐NET, Alzheimer's Association: BHR‐16‐459161; The State of California: 18‐109929). He also receives support from Johnson & Johnson, Kevin and Connie Shanahan, GE, VUmc, Australian Catholic University (HBI‐BHR), The Stroke Foundation, and the Veterans Administration. He has served on advisory boards for Eli Lilly, Cerecin/Accera, Roche, Alzheon, Inc., Merck Sharp & Dohme Corp., Nestle/Nestec, PCORI/PPRN, Dolby Family Ventures, National Institute on Aging (NIA), Brain Health Registry, and ADNI. He has no other support or conflicts of interest to declare. Dr. Aisen has received support over the last 36 months from payments to his institution from NIA, Alzheimer's Association, Janssen, Lilly, and Eisai. He has served on the advisory boards of Biogen, Merck, Roche, Abbvie, Rainbow Medical, ImmunoBrain Checkpoint, Shionogi, and has no other support or conflicts of interest to declare. Dr. Beckett was supported in the current work by NIA/NIH U01AG024904 to her institution and received support over the last 36 months from payments to her institution from U01AG024904 (Dr. Weiner, UCSF/NCIRE), R01AG062517 (Dr. Dugger), B639943 (Dr. Coleman), and the National Institute of Justice 2014‐R2‐CX‐0012 (Dr. Wintemute). She has served on the external advisory board for Alzheimer's Disease Centers at UCSD, Washington University, University of Pittsburgh and Data and Safety Monitoring Boards for NIH‐funded clinical trial (UCSF), all paid directly to her. Her travel to the AAIC was supported by U01AG024904. She has no other support or conflicts of interest to declare. Dr. DeCarli was supported in the current work by NIH and has received support over the last 36 months from payments to his institution from the NIH. He served on an advisory board at Novartis on a safety study of heart failure treatment and has no other support or conflicts of interest to declare. Dr. Green was supported in the current work by NIH funding. Over the last 36 months, he has received support from multiple NIH grants to his institution, consulting fees (AIA, Genomic Life, Grail, Humanity, Kneed Media, Plumcare, UnitedHealth, Verily, VibrentHealth, and Genome Medical), and lectures in non‐Alzheimer's fields. He has no other support or conflicts of interest to declare. Dr. Harvey has no support or conflicts of interest to declare. Dr. Jack was supported in the current work by NIH funding. Over the last 36 months, he has received support from NIH grants to his institution and has served on the advisory boards of iDMC and Roche with no payments made. He has no other support or conflicts of interest to declare. Dr. Jagust has received support over the last 36 months from grants to his institution (NIH grants R01 AG034570 [Dr. Jagust], R01AG062542 [Dr. Jagust], U24 AG067418 [Dr. Jagust], P01AG019724 [Dr. Bruce Miller], R01 AG031164 [Dr. Matthew Walker], RF1 AG054019 [Dr. Matthew Walker], U01 AG024904 [Dr. Weiner], RF1 AG054106‐01A1 [Dr. Matthew Walker], R44AG046025‐03 [Dr. Daojing Wang], R01 AG061303 [Dr. Lexin Li], MH112775 [Dr. Ming Hsu], 1R01AG062689‐01 [Dr. Landau], AG062624 [Dr. José Luchsinger], and R01AG069090), direct consulting fees (Biogen, Bioclinica, Genentech/Roche, CuraSen, Grifols), and has served on the advisory board of the Alzheimer's Prevention Initiative. He has no other support or conflicts of interest to declare. Dr. Landau has received support over the last 36 months from grants through her institution (R01 AG062689 [Dr. Landau], U19 AG024904 [Dr. Weiner], R01 AG061303 [Dr. Li], R01AG062542 [Dr. Jagust], U24 AG067418 [Dr. Jagust]), an honorarium for speaking (4th annual Hillblom Symposium, University of CA, San Francisco), travel expenses and conference registration (AAIC 2017‐2019 as member of the Scientific Program Committee during this period), and has served on the advisory board of KeifeRx. She has no other support or conflicts of interest to declare. Dr. Morris over the past 36 months received honoraria (Grand Rounds lecture advisory board member) and support to attend national and international meetings, external advisory meetings, and board member meetings. He has no other support or conflicts of interest to declare. Dr. Okonkwo over the past 36 months received grants through his institution from the NIH and served in the International Neuropsychological Society. He has no other support or conflicts of interest to declare. Dr. Perrin over the past 36 months received grants through his institution (U19 AG024904, R01 NS092865, RF1 AG053550, R01 AG054513, R01 AG054567, R01 AG052550, P01 AG00399,1 U19 AG032438, P30 AG066444, U19 AG032438, R01 AG068319, R01AG053267, R01 AG070883, R01 NS103276). He has no other support or conflicts of interest to declare. Dr. Petersen over the past 36 months received grants through his institution (P30 AG062677, U01 AG006786); licenses or royalties from Oxford University Press and UpToDate; and consulting fees from Roche, Merck, Biogen, Genentech, and Eisai. He served on the advisory board of Genentech and has no other support or conflicts of interest to declare. Dr. Rivera‐Mindt over the past 36 months received grants through her institution (NIH/NIA R13 AG071313‐01 [Drs. M. Rivera Mindt, R. Turner‐II, M. Carrillo], Genentech Health Equity Innovations 2020 Fund G‐89294 [Drs. M. Rivera Mindt, R. Nosheny & C. Hill], NIH/NIA R01AG065110 ‐ 01A1 [Dr. Rivera Mindt], NIH/NIA 5U19AG024904‐14 [Dr. Weiner], R01AG066471‐01A1 [Drs. A. Federman & J.P. Wisnivesky], AARGD‐16‐446038 [Dr. Rivera Mindt; PI of subcontract to Mt. Sinai: J. Robinson‐Papp], and NIH/NIMH U24MH100931‐03 [Dr. S. Morgello]), speaking fees for talks at various universities across the country (e.g., Brown, Columbia, University of Arizona), and travel support from NIH grants. She has served on the Society for Black Neuropsychology; is a Present Member, Centers for Disease Control and Prevention (CDC) BOLD Public Health Center of Excellence on Dementia Risk Reduction Expert Panel; and Present Member, CDC/National Alzheimer's Project Act (NAPA) Physical Activity, Tobacco Use, and Alcohol Workgroup; and was paid directly for her role on the 2019 Data Safety & Monitoring Board (DSMB) Member Project Title: Reducing HIV Risk Behavior in Depressed and Non‐Depressed Older Adults with HIV; Grant #: R01AG05308101 (PI: T. Lovejoy). She is a Present Board Member, Alzheimer's Association NYC Chapter Board of Directors, President‐Elect and Past‐President (Elected Position), Hispanic Neuropsychological Society, on the Board of Directors, Harlem Community & Academic Partnership, all unpaid. She has no other support or conflicts of interest to declare. Dr. Saykin was supported in this work by grants from NIH and Department of Defense (NIH grants U01 AG024904, P30 AG010133, R01 AG019771, R01 LM013463, R01 LM011360 and DoD grants W81XWH‐13‐1‐0259 and W81XWH‐12‐2‐0012), and over the past 36 months received support from grants to his institution (as detailed above). He served on the Bayer Oncology Advisory Board and received PET tracer precursor from Avid Radiopharmaceuticals. He has no other support or conflicts of interest to declare. Dr. Shaw has received over the past 36 months grants through his institution (NIH grants U01 AG024904 [ADNI3], UPenn ADRC NIA grant for Biomarker Core; Michael J. Fox Foundation for Parkinson's Research for AD biomarker studies; Roche IIS for AD biomarker studies), fees for the Biogen Teaching program on AD Biomarkers, and travel funds from NIA ADNI3 Biomarker Core. He has served on the Roche Advisory Board, LEADS Advisory board, and Fujirebio Advisory Board. He received in‐kind support from Roche (immunoassay reagents and equipment) for ADNI3. He has no other support or conflicts of interest to declare. Dr. Toga was supported in this work by grants from NIH and has received over the past 36 months grants through his institution from NIH and speaking fees from Biogen. He has no other support or conflicts of interest to declare. Dr. Tosun has received over the past 36 months grants through her institution (NIH U01 AG024904). She has no other support or conflicts of interest to declare. Dr. Trojanowski has received over the past 36 months grants through his institution (AG10124). He has no other support or conflicts of interest to declare.
Supporting information
Supporting Information
Supporting Information
Supporting Information
ACKNOWLEDGMENTS
This work was supported by NIH grant U19‐AG024904 funded by the National Institute on Aging to Dr. Michael Weiner.
Veitch DP, Weiner MW, Aisen PS, et al. Using the Alzheimer's Disease Neuroimaging Initiative to improve early detection, diagnosis, and treatment of Alzheimer's disease. Alzheimer's Dement. 2022;18:824–857. 10.1002/alz.12422
REFERENCES
- 1. Weiner MW, Veitch DP, Aisen PS, et al. Impact of the Alzheimer's disease neuroimaging initiative, 2004 to 2014. Alzheimer's Dement. 2015;11:865‐884. [DOI] [PMC free article] [PubMed] [Google Scholar]
- 2. Weiner MW, Veitch DP, Aisen PS, et al. The Alzheimer's disease neuroimaging initiative 3: continued innovation for clinical trial improvement. Alzheimer's Dement. 2017;13:561‐571. [DOI] [PMC free article] [PubMed] [Google Scholar]
- 3. Apostolova LG, Hwang KS, Avila D, et al. Brain amyloidosis ascertainment from cognitive, imaging, and peripheral blood protein measures. Neurology. 2015;84:729‐737. [DOI] [PMC free article] [PubMed] [Google Scholar]
- 4. Petersen RC, Aisen P, Boeve BF, et al. Criteria for mild cognitive impairment due to Alzheimer's disease in the community. Ann Neurol. 2013;74(2):199‐208. [DOI] [PMC free article] [PubMed] [Google Scholar]
- 5. Weiner MW, Veitch DP, Aisen PS, et al. The Alzheimer's Disease Neuroimaging Initiative: a review of papers published since its inception. Alzheimer's Dement. 2012;8:S1‐S68. [DOI] [PMC free article] [PubMed] [Google Scholar]
- 6. Veitch DP, Weiner MW, Aisen PS, et al. Understanding disease progression and improving Alzheimer's disease clinical trials: recent highlights from the Alzheimer's Disease Neuroimaging Initiative. Alzheimer's Dement. 2019;15:106‐152. [DOI] [PubMed] [Google Scholar]
- 7. Tolar M, Abushakra S, Hey JA, Porsteinsson A, Sabbagh M. Aducanumab, gantenerumab, BAN2401, and ALZ‐801‐the first wave of amyloid‐targeting drugs for Alzheimer's disease with potential for near term approval. Alzheimer's Res Ther. 2020;12:95. [DOI] [PMC free article] [PubMed] [Google Scholar]
- 8. Bullain S, Doody R. What works and what does not work in Alzheimer's disease? From interventions on risk factors to anti‐amyloid trials. J Neurochem. 2020;155:120‐136. [DOI] [PubMed] [Google Scholar]
- 9. Walsh DM, Selkoe DJ. Amyloid beta‐protein and beyond: the path forward in Alzheimer's disease. Curr Opin Neurobiol. 2020;61:116‐124. [DOI] [PubMed] [Google Scholar]
- 10. Hadjichrysanthou C, Evans S, Bajaj S, et al. The dynamics of biomarkers across the clinical spectrum of Alzheimer's disease. Alzheimer's Res Ther. 2020;12:74. [DOI] [PMC free article] [PubMed] [Google Scholar]
- 11. Barupal DK, Fan S, Wancewicz B, et al. Generation and quality control of lipidomics data for the Alzheimer's disease neuroimaging initiative cohort. Sci data. 2018;5:180263. [DOI] [PMC free article] [PubMed] [Google Scholar]
- 12. St John‐Williams L, Mahmoudiandehkordi S, Arnold M, et al. Bile acids targeted metabolomics and medication classification data in the ADNI1 and ADNIGO/2 cohorts. Sci Data. 2019;6:212. [DOI] [PMC free article] [PubMed] [Google Scholar]
- 13. Chawinga WD, Zinn S. Global perspectives of research data sharing: a systematic literature review. Libr Inf Sci Res. 2019;41:109‐122. [Google Scholar]
- 14. Hutchins BI, Yuan X, Anderson JM, Santangelo GM. Relative Citation Ratio (RCR): a new metric that uses citation rates to measure influence at the article level. PLOS Biol. 2016;14:e1002541. [DOI] [PMC free article] [PubMed] [Google Scholar]
- 15. Juster FT, Suzman R. An overview of the Health and Retirement Study. J Hum Resources. 1995:S7‐S56. [Google Scholar]
- 16. Chen G, Levy D. Contributions of the Framingham heart study to the epidemiology of coronary heart disease. JAMA Cardiol. 2016;1:825‐830. [DOI] [PMC free article] [PubMed] [Google Scholar]
- 17. Shaw LM, Vanderstichele H, Knapik‐Czajka M, et al. Cerebrospinal fluid biomarker signature in Alzheimer's disease neuroimaging initiative subjects. Ann Neurol. 2009;65:403‐413. [DOI] [PMC free article] [PubMed] [Google Scholar]
- 18. Jack CR, Jr. , Knopman DS, Jagust WJ, et al. Tracking pathophysiological processes in Alzheimer's disease: an updated hypothetical model of dynamic biomarkers. Lancet Neurol. 2013;12:207‐216. [DOI] [PMC free article] [PubMed] [Google Scholar]
- 19. Hardy J, Selkoe DJ. The amyloid hypothesis of Alzheimer's disease: progress and problems on the road to therapeutics. Science. 2002;297:353‐356. [DOI] [PubMed] [Google Scholar]
- 20. Selkoe DJ, Hardy J. The amyloid hypothesis of Alzheimer's disease at 25 years. EMBO Mol Med. 2016;8:595‐608. [DOI] [PMC free article] [PubMed] [Google Scholar]
- 21. Insel PS, Mormino EC, Aisen PS, Thompson WK, Donohue MC. Neuroanatomical spread of amyloid b and tauin Alzheimer's disease: implications for primary prevention. Brain Commun. 2020;2:fcaa007. [DOI] [PMC free article] [PubMed] [Google Scholar]
- 22. Jack CR, Jr. , Knopman DS, Jagust WJ, et al. Hypothetical model of dynamic biomarkers of the Alzheimer's pathological cascade. Lancet Neurol. 2010;9:119‐128. [DOI] [PMC free article] [PubMed] [Google Scholar]
- 23. Goyal D, Tjandra D, Migrino RQ, et al. Characterizing heterogeneity in the progression of Alzheimer's disease using longitudinal clinical and neuroimaging biomarkers. Alzheimer's Dement. 2018;19:629‐637. [DOI] [PMC free article] [PubMed] [Google Scholar]
- 24. Iturria‐Medina Y, Khan AF, Adewale Q, Shirazi AH, Alzheimer's Disease Neuroimaging I . Blood and brain gene expression trajectories mirror neuropathology and clinical deterioration in neurodegeneration. Brain. 2020;143:661‐673. [DOI] [PMC free article] [PubMed] [Google Scholar]
- 25. Jones DT, Knopman DS, Gunter JL, et al. Cascading network failure across the Alzheimer's disease spectrum. Brain. 2016;139:547‐562. [DOI] [PMC free article] [PubMed] [Google Scholar]
- 26. Raj A, LoCastro E, Kuceyeski A, et al. Network diffusion model of progression predicts longitudinal patterns of atrophy and metabolism in Alzheimer's disease. Cell Rep. 2015;10:359‐369. [DOI] [PMC free article] [PubMed] [Google Scholar]
- 27. Franzmeier N, Neitzel J, Rubinski A, et al. Functional brain architecture is associated with the rate of tau accumulation in Alzheimer's disease. Nat Commun. 2020;11:347. [DOI] [PMC free article] [PubMed] [Google Scholar]
- 28. Vogel JW, Iturria‐Medina Y, Strandberg OT, et al. Spread of pathological tau proteins through communicating neurons in human Alzheimer's disease. Nat Commun. 2020;11:1‐15. [DOI] [PMC free article] [PubMed] [Google Scholar]
- 29. Iturria‐Medina Y, Sotero RC, Toussaint PJ, Evans AC, Alzheimer's Disease Neuroimaging I . Epidemic spreading model to characterize misfolded proteins propagation in aging and associated neurodegenerative disorders. PLoS Comput Biol. 2014;10:e1003956. [DOI] [PMC free article] [PubMed] [Google Scholar]
- 30. Scelsi MA, Khan RR, Lorenzi M, et al. Genetic study of multimodal imaging Alzheimer's disease progression score implicates novel loci. Brain. 2018;141:2167‐2180. [DOI] [PMC free article] [PubMed] [Google Scholar]
- 31. Hadjichrysanthou C, Evans S, Bajaj S, et al. The dynamics of biomarkers across the clinical spectrum of Alzheimer's disease. Alzheimer's Res Ther. 2020;12:1‐16. [DOI] [PMC free article] [PubMed] [Google Scholar]
- 32. Landau SM, Horng A, Jagust WJ, Alzheimer's Disease Neuroimaging I . Memory decline accompanies subthreshold amyloid accumulation. Neurology. 2018;90:e1452‐e1460. [DOI] [PMC free article] [PubMed] [Google Scholar]
- 33. Tijms BM, Vermunt L, Zwan MD, et al. Pre‐amyloid stage of Alzheimer's disease in cognitively normal individuals. Ann Clin Transl Neurol. 2018;5:1037‐1047. [DOI] [PMC free article] [PubMed] [Google Scholar]
- 34. Guo T, Landau SM, Jagust WJ, Alzheimer's Disease Neuroimaging I . Detecting earlier stages of amyloid deposition using PET in cognitively normal elderly adults. Neurology. 2020;94:e1512‐e1524. [DOI] [PMC free article] [PubMed] [Google Scholar]
- 35. Landau SM, Mintun MA, Joshi AD, et al. Amyloid deposition, hypometabolism, and longitudinal cognitive decline. Ann Neurol. 2012;72:578‐586. [DOI] [PMC free article] [PubMed] [Google Scholar]
- 36. Collij LE, Heeman F, Salvado G, et al. Multitracer model for staging cortical amyloid deposition using PET imaging. Neurology. 2020;95:e1538‐e1553. [DOI] [PMC free article] [PubMed] [Google Scholar]
- 37. Mattsson N, Palmqvist S, Stomrud E, Vogel J, Hansson O. Staging beta‐amyloid pathology with amyloid positron emission tomography. JAMA Neurol. 2019;76:1319‐1329. [DOI] [PMC free article] [PubMed] [Google Scholar]
- 38. Avants BB, Hutchison RM, Mikulskis A, et al. Amyloid beta–Positive subjects exhibit longitudinal network‐specific reductions in spontaneous brain activity. Neurobiol Aging. 2018;74:191‐201. [DOI] [PubMed] [Google Scholar]
- 39. Pascoal TA, Mathotaarachchi S, Kang MS, et al. A beta‐induced vulnerability propagates via the brain's default mode network. Nat Commun. 2019;10:13. [DOI] [PMC free article] [PubMed] [Google Scholar]
- 40. Altmann A, Scelsi MA, Shoai M, et al. A comprehensive analysis of methods for assessing polygenic burden on Alzheimer's disease pathology and risk beyond APOE. Brain Commun. 2020;2:fcz047. [DOI] [PMC free article] [PubMed] [Google Scholar]
- 41. Reus LM, Stringer S, Posthuma D, et al. Degree of genetic liability for Alzheimer's disease associated with specific proteomic profiles in cerebrospinal fluid. Neurobiol Aging. 2020;93:144.e1‐.e15. [DOI] [PubMed] [Google Scholar]
- 42. Leonenko G, Shoai M, Bellou E, et al. Genetic risk for Alzheimer disease is distinct from genetic risk for amyloid deposition. Ann Neurol. 2019;86:427‐435. [DOI] [PMC free article] [PubMed] [Google Scholar]
- 43. Apostolova LG, Risacher SL, Duran T, et al. Associations of the top 20 Alzheimer disease risk variants with brain amyloidosis. JAMA Neurol. 2018;75:328‐341. [DOI] [PMC free article] [PubMed] [Google Scholar]
- 44. Raghavan NS, Dumitrescu L, Mormino E, et al. Association between common variants in RBFOX1, an RNA‐binding protein, and brain amyloidosis in early and preclinical Alzheimer disease. JAMA Neurol. 2020;77:1‐11. [DOI] [PMC free article] [PubMed] [Google Scholar]
- 45. Yan TX, Liang JJ, Gao J, et al. FAM222A encodes a protein which accumulates in plaques in Alzheimer's disease. Nat Commun. 2020;11:411. [DOI] [PMC free article] [PubMed] [Google Scholar]
- 46. Wang H, Yang J, Schneider JA, De Jager PL, Bennett DA, Zhang HY. Genome‐wide interaction analysis of pathological hallmarks in Alzheimer's disease. Neurobiol Aging. 2020;93:61‐8. [DOI] [PMC free article] [PubMed] [Google Scholar]
- 47. Crary JF, Trojanowski JQ, Schneider JA, et al. Primary age‐related tauopathy (PART): a common pathology associated with human aging. Acta Neuropathol. 2014;128:755‐766. [DOI] [PMC free article] [PubMed] [Google Scholar]
- 48. Das SR, Xie L, Wisse LEM, et al. Longitudinal and cross‐sectional structural magnetic resonance imaging correlates of AV‐1451 uptake. Neurobiol Aging. 2018;66:49‐58. [DOI] [PMC free article] [PubMed] [Google Scholar]
- 49. Das SR, Xie L, Wisse LEM, et al. In vivo measures of tau burden are associated with atrophy in early Braak stage medial temporal lobe regions in amyloid‐negative individuals. Alzheimers Dement. 2019;15:1286‐1295. [DOI] [PMC free article] [PubMed] [Google Scholar]
- 50. Knopman DS, Lundt ES, Therneau TM, et al. Association of initial β‐amyloid levels with subsequent flortaucipir positron emission tomography changes in persons without cognitive impairment. JAMA Neurol. 2020;78(2):217‐228. e203921. [DOI] [PMC free article] [PubMed] [Google Scholar]
- 51. Xie L, Das SR, Wisse LEM, et al. Early tau burden correlates with higher rate of atrophy in transentorhinal cortex. J Alzheimer's Dis. 2018;62:85‐92. [DOI] [PMC free article] [PubMed] [Google Scholar]
- 52. Therriault J, Benedet AL, Pascoal TA, et al. APOEε4 potentiates the relationship between amyloid‐β and tau pathologies. Mol Psychiatry. 2020. [DOI] [PMC free article] [PubMed] [Google Scholar]
- 53. Grothe MJ, Sepulcre J, Gonzalez‐Escamilla G, et al. Molecular properties underlying regional vulnerability to Alzheimer's disease pathology. Brain. 2018;141:2755‐2771. [DOI] [PMC free article] [PubMed] [Google Scholar]
- 54. Jack CR, Jr. , Bennett DA, Blennow K, et al. A/T/N: an unbiased descriptive classification scheme for Alzheimer disease biomarkers. Neurology. 2016;87:539‐547. [DOI] [PMC free article] [PubMed] [Google Scholar]
- 55. Balsis S, Geraci L, Benge J, Tirso R, et al. Statistical model of dynamic markers of the Alzheimer's pathological cascade. J Gerontol B Psychol Sci Soc Sci. 2018;73:964‐973. [DOI] [PMC free article] [PubMed] [Google Scholar]
- 56. Sivera R, Delingette H, Lorenzi M, Pennec X, Ayache N, Alzheimer's Disease Neuroimaging I . A model of brain morphological changes related to aging and Alzheimer's disease from cross‐sectional assessments. Neuroimage. 2019;198:255‐270. [DOI] [PubMed] [Google Scholar]
- 57. Marinescu RV, Eshaghi A, Lorenzi M, et al. DIVE: a spatiotemporal progression model of brain pathology in neurodegenerative disorders. Neuroimage. 2019;192:166‐177. [DOI] [PubMed] [Google Scholar]
- 58. Li D, Iddi S, Thompson WK, Rafii MS, Aisen PS, Donohue MC. Bayesian latent time joint mixed‐effects model of progression in the Alzheimer's Disease Neuroimaging Initiative. Alzheimer's Dement. 2018;10:657‐668. [DOI] [PMC free article] [PubMed] [Google Scholar]
- 59. Venkatraghavan V, Bron EE, Niessen WJ, Klein S, Alzheimer's Disease Neuroimaging I . Disease progression timeline estimation for Alzheimer's disease using discriminative event based modeling. NeuroImage. 2019;186:518‐532. [DOI] [PubMed] [Google Scholar]
- 60. Tan MS, Ji X, Li JQ, et al. Longitudinal trajectories of Alzheimer's ATN biomarkers in elderly persons without dementia. Alzheimer's Res Ther. 2020;12:55. [DOI] [PMC free article] [PubMed] [Google Scholar]
- 61. Donohue MC, Sperling RA, Salmon DP, et al. The preclinical Alzheimer cognitive composite: measuring amyloid‐related decline. JAMA Neurol. 2014;71:961‐970. [DOI] [PMC free article] [PubMed] [Google Scholar]
- 62. McRae‐McKee K, Udeh‐Momoh CT, Price G, et al. Perspective: clinical relevance of the dichotomous classification of Alzheimer's disease biomarkers: should there be a “gray zone”? Alzheimer's Dement. 2019;15:1348‐1356. [DOI] [PubMed] [Google Scholar]
- 63. Palmqvist S, Mattsson N, Hansson O, Initiative AsDN . Cerebrospinal fluid analysis detects cerebral amyloid‐β accumulation earlier than positron emission tomography. Brain. 2016;139:1226‐1236. [DOI] [PMC free article] [PubMed] [Google Scholar]
- 64. Salvado G, Molinuevo JL, Brugulat‐Serrat A, et al. Centiloid cut‐off values for optimal agreement between PET and CSF core AD biomarkers. Alzheimer's Res Ther. 2019;11:27. [DOI] [PMC free article] [PubMed] [Google Scholar]
- 65. Meyer PF, Pichet Binette A, Gonneaud J, Breitner JCS, Villeneuve S. Characterization of Alzheimer disease biomarker discrepancies using cerebrospinal fluid phosphorylated tau and AV1451 positron emission tomography. JAMA Neurol. 2020;77:508‐516. [DOI] [PMC free article] [PubMed] [Google Scholar]
- 66. Illán‐Gala I, Pegueroles J, Montal V, et al. Challenges associated with biomarker‐based classification systems for Alzheimer's disease. Alzheimer's Dement. 2018;10:346‐357. [DOI] [PMC free article] [PubMed] [Google Scholar]
- 67. Illan‐Gala I, Vilaplana E, Pegueroles J, et al. The pitfalls of biomarker‐based classification schemes. Alzheimer's Dement. 2017;13:1072‐1074. [DOI] [PubMed] [Google Scholar]
- 68. Galasko D, Xiao M, Xu D, et al. Synaptic biomarkers in CSF aid in diagnosis, correlate with cognition and predict progression in MCI and Alzheimer's disease. Alzheimer's Dement. 2019;5:871‐882. [DOI] [PMC free article] [PubMed] [Google Scholar]
- 69. Sutphen CL, McCue L, Herries EM, et al. Longitudinal decreases in multiple cerebrospinal fluid biomarkers of neuronal injury in symptomatic late onset Alzheimer's disease. Alzheimer's Dement. 2018;14:869‐879. [DOI] [PMC free article] [PubMed] [Google Scholar]
- 70. Mattsson N, Cullen NC, Andreasson U, Zetterberg H, Blennow K. Association between longitudinal plasma neurofilament light and neurodegeneration in patients with Alzheimer Disease. JAMA Neurol. 2019;76:791‐799. [DOI] [PMC free article] [PubMed] [Google Scholar]
- 71. Montine TJ, Phelps CH, Beach TG, et al. National Institute on Aging‐Alzheimer's Association guidelines for the neuropathologic assessment of Alzheimer's disease: a practical approach. Acta Neuropathol. 2012;123:1‐11. [DOI] [PMC free article] [PubMed] [Google Scholar]
- 72. Wang H, Stewart T, Toledo JB, et al. A longitudinal study of total and phosphorylated alpha‐synuclein with other biomarkers in cerebrospinal fluid of Alzheimer's disease and mild cognitive impairment. J Alzheimer's Dis. 2018;61:1541‐1553. [DOI] [PMC free article] [PubMed] [Google Scholar]
- 73. Stage EC, Jr. , Svaldi D, Phillips M, et al. Neurodegenerative changes in early‐ and late‐onset cognitive impairment with and without brain amyloidosis. Alzheimer's Res Ther. 2020;12:93. [DOI] [PMC free article] [PubMed] [Google Scholar]
- 74. Teipel SJ, Marie Temp AG, Levin F, Dyrba M, Grothe MJ. Association of TDP‐43 Pathology with Global and Regional 18F‐Florbetapir PET Signal in the Alzheimer's Disease Spectrum. J Alzheimer's Dis. 2020;79:663‐670. [DOI] [PubMed] [Google Scholar]
- 75. Mitelpunkt A, Galili T, Kozlovski T, et al. Novel Alzheimer's disease subtypes identified using a data and knowledge driven strategy. Sci Rep. 2020;10:1327. [DOI] [PMC free article] [PubMed] [Google Scholar]
- 76. Edmonds EC, McDonald CR, Marshall A, et al. Early versus late MCI: improved MCI staging using a neuropsychological approach. Alzheimer's & Dement. 2019;15:699‐708. [DOI] [PMC free article] [PubMed] [Google Scholar]
- 77. Edmonds EC, Weigand AJ, Hatton SN, et al. Patterns of longitudinal cortical atrophy over 3 years in empirically derived MCI subtypes. Neurology. 2020;94(24):e2532‐e2544. [DOI] [PMC free article] [PubMed] [Google Scholar]
- 78. Scheltens NM, Tijms BM, Heymans MW, et al. Prominent non‐memory deficits in Alzheimer's disease are associated with faster disease progression. J Alzheimer's Dis. 2018;65:1029‐1039. [DOI] [PMC free article] [PubMed] [Google Scholar]
- 79. Young AL, Marinescu RV, Oxtoby NP, et al. Uncovering the heterogeneity and temporal complexity of neurodegenerative diseases with Subtype and Stage Inference. Nat Commun. 2018;9:4273. [DOI] [PMC free article] [PubMed] [Google Scholar]
- 80. Sun N, Mormino EC, Chen J, Sabuncu MR, Yeo BTT, Alzheimer's Disease Neuroimaging I . Multi‐modal latent factor exploration of atrophy, cognitive and tau heterogeneity in Alzheimer's disease. Neuroimage. 2019;201:116043. [DOI] [PubMed] [Google Scholar]
- 81. Mukherjee S, Mez J, Trittschuh EH, et al. Genetic data and cognitively defined late‐onset Alzheimer's disease subgroups. Mol Psychiatry. 2020;25:2942‐2951. [DOI] [PMC free article] [PubMed] [Google Scholar]
- 82. Marti‐Juan G, Sanroma G, Piella G, Alzheimer's Disease Neuroimaging I, the Alzheimer's Disease Metabolomics C . Revealing heterogeneity of brain imaging phenotypes in Alzheimer's disease based on unsupervised clustering of blood marker profiles. PloS One. 2019;14:e0211121. [DOI] [PMC free article] [PubMed] [Google Scholar]
- 83. Tijms BM, Gobom J, Reus L, et al. Pathophysiological subtypes of Alzheimer's disease based on cerebrospinal fluid proteomics. Brain. 2020;143:3776‐3792. [DOI] [PMC free article] [PubMed] [Google Scholar]
- 84. Edmonds EC, Weigand AJ, Thomas KR, et al. Increasing inaccuracy of self‐reported subjective cognitive complaints over 24 months in empirically derived subtypes of mild cognitive impairment. J Int Neuropsychol Soc. 2018;24:842‐853. [DOI] [PMC free article] [PubMed] [Google Scholar]
- 85. Vogel JW, Young AL, Oxtoby NP, et al. Four distinct trajectories of tau deposition identified in Alzheimer's disease. Nat Med. 2021;27(5):871‐881. [DOI] [PMC free article] [PubMed] [Google Scholar]
- 86. Santos CY, Snyder PJ, Wu W‐C, Zhang M, Echeverria A, Alber J. Pathophysiologic relationship between Alzheimer's disease, cerebrovascular disease, and cardiovascular risk: a review and synthesis. Alzheimer's Dement. 2017;7:69‐87. [DOI] [PMC free article] [PubMed] [Google Scholar]
- 87. Wu P, Li W, Cai X, Yan H, Chen M, for Alzheimer's Disease Neuroimaging I . Associations of cigarette smoking with memory decline and neurodegeneration among cognitively normal older individuals. Neurosci Lett. 2020;714:134563. [DOI] [PubMed] [Google Scholar]
- 88. Zhou R, Chen H, Ye F, Huang S, Zhang J. Influence of hypertension on longitudinal changes in brain glucose metabolism was modified by the APOE4 allele among cognitively normal older individuals. Front Aging Neurosci. 2020;12:85. [DOI] [PMC free article] [PubMed] [Google Scholar]
- 89. Hayes JP, Moody JN, Roca JG, Hayes SM, Alzheimer's Disease Neuroimaging I . Body mass index is associated with smaller medial temporal lobe volume in those at risk for Alzheimer's disease. NeuroImage Clin. 2020;25:102156. [DOI] [PMC free article] [PubMed] [Google Scholar]
- 90. Femminella GD, Taylor‐Davies G, Scott J, Edison P, Alzheimer's Disease Neuroimaging I . Do cardiometabolic risk factors influence amyloid, tau, and neuronal function in APOE4 carriers and non‐carriers in Alzheimer's disease trajectory? J Alzheimer's Dis. 2018;64:981‐993. [DOI] [PubMed] [Google Scholar]
- 91. Moran C, Beare R, Wang W, Callisaya M, Srikanth V, Alzheimer's Disease Neuroimaging I . Type 2 diabetes mellitus, brain atrophy, and cognitive decline. Neurology. 2019;92:e823‐e830. [DOI] [PMC free article] [PubMed] [Google Scholar]
- 92. Ge T, Sabuncu MR, Smoller JW, Sperling RA, Mormino EC. Dissociable influences of APOE ε4 and polygenic risk of AD dementia on amyloid and cognition. Neurology. 2018;90:e1605‐e1612. [DOI] [PMC free article] [PubMed] [Google Scholar]
- 93. Wang YL, Chen W, Cai WJ, et al. Associations of white matter hyperintensities with cognitive decline: a longitudinal study. J Alzheimer's Dis. 2020;73:759‐768. [DOI] [PubMed] [Google Scholar]
- 94. Walsh P, Sudre CH, Fiford CM, et al. The age‐dependent associations of white matter hyperintensities and neurofilament light in early‐ and late‐stage Alzheimer's disease. Neurobiol Aging. 2020;97:10‐17. [DOI] [PubMed] [Google Scholar]
- 95. Wisse LEM, Das SR, Davatzikos C, et al. Defining SNAP by cross‐sectional and longitudinal definitions of neurodegeneration. NeuroImage Clin. 2018;18:407‐412. [DOI] [PMC free article] [PubMed] [Google Scholar]
- 96. Walsh P, Sudre CH, Fiford CM, et al. CSF amyloid is a consistent predictor of white matter hyperintensities across the disease course from aging to Alzheimer's disease. Neurobiol Aging. 2020;91:5‐14. [DOI] [PubMed] [Google Scholar]
- 97. Moscoso A, Rey‐Bretal D, Silva‐Rodríguez J, et al. White matter hyperintensities are associated with subthreshold amyloid accumulation. NeuroImage. 2020;218:116944. [DOI] [PubMed] [Google Scholar]
- 98. Iturria‐Medina Y, Sotero RC, Toussaint PJ, Mateos‐Perez JM, Evans AC, Alzheimer's Disease Neuroimaging I . Early role of vascular dysregulation on late‐onset Alzheimer's disease based on multifactorial data‐driven analysis. Nat Commun. 2016;7:11934. [DOI] [PMC free article] [PubMed] [Google Scholar]
- 99. Lao PJ, Brickman AM. Multimodal neuroimaging study of cerebrovascular disease, amyloid deposition, and neurodegeneration in Alzheimer's disease progression. Alzheimers Dement (Amst). 2018;10:638‐646. [DOI] [PMC free article] [PubMed] [Google Scholar]
- 100. Laing KK, Simoes S, Baena‐Caldas GP, et al. Cerebrovascular disease promotes tau pathology in Alzheimer's disease. Brain Commun. 2020;19:fcaa132. [DOI] [PMC free article] [PubMed] [Google Scholar]
- 101. Li L, Wu D‐H, Li H‐Q, et al. Association of cerebral microbleeds with cognitive decline: a longitudinal study. J Alzheimer's Dis. 2020;75:571‐579. [DOI] [PubMed] [Google Scholar]
- 102. Mirza SS, Saeed U, Knight J, et al. APOE epsilon4, white matter hyperintensities, and cognition in Alzheimer and Lewy body dementia. Neurology. 2019;93:e1807‐e1819. [DOI] [PMC free article] [PubMed] [Google Scholar]
- 103. Ennerfelt HE, Lukens JR. The role of innate immunity in Alzheimer's disease. Immunol Rev. 2020;297:225‐246. [DOI] [PMC free article] [PubMed] [Google Scholar]
- 104. Bellou E, Baker E, Leonenko G, et al. Age‐dependent effect of APOE and polygenic component on Alzheimer's disease. Neurobiol Aging. 2020;93:67‐77. [DOI] [PMC free article] [PubMed] [Google Scholar]
- 105. Royall DR, Palmer RF, Alzheimer's Disease Neuroimaging I . A delta homolog for dementia case finding with replication in the Alzheimer's disease neuroimaging initiative. J Alzheimer's Dis. 2019;67:67‐79. [DOI] [PubMed] [Google Scholar]
- 106. Royall DR, Bishnoi RJ, Palmer RF. Blood‐based protein predictors of dementia severity as measured by delta: replication across biofluids and cohorts. Alzheimer's Dement. 2019;11:763‐774. [DOI] [PMC free article] [PubMed] [Google Scholar]
- 107. Meyer PF, Savard M, Poirier J, Morgan D, Breitner J, Alzheimer's Disease Neuroimaging I . Hypothesis: cerebrospinal fluid protein markers suggest a pathway toward symptomatic resilience to AD pathology. Alzheimer's Dement. 2019;15:1160‐1171. [DOI] [PubMed] [Google Scholar]
- 108. Carmona S, Zahs K, Wu E, Dakin K, Bras J, Guerreiro R. The role of TREM2 in Alzheimer's disease and other neurodegenerative disorders. Lancet Neurol. 2018;17:721‐730. [DOI] [PubMed] [Google Scholar]
- 109. Ewers M, Biechele G, Suárez‐Calvet M, et al. Higher CSF sTREM2 and microglia activation are associated with slower rates of beta‐amyloid accumulation. EMBO Mol Med. 2020;12:e12308. [DOI] [PMC free article] [PubMed] [Google Scholar]
- 110. Franzmeier N, Suárez‐Calvet M, Frontzkowski L, et al. Higher CSF sTREM2 attenuates ApoE4‐related risk for cognitive decline and neurodegeneration. Mol Neurodegeneration. 2020;15:57. [DOI] [PMC free article] [PubMed] [Google Scholar]
- 111. Suarez‐Calvet M, Morenas‐Rodriguez E, Kleinberger G, et al. Early increase of CSF sTREM2 in Alzheimer's disease is associated with tau related‐neurodegeneration but not with amyloid‐beta pathology. Mol Neurodegeneration. 2019;14:1. [DOI] [PMC free article] [PubMed] [Google Scholar]
- 112. Meyer PF, Savard M, Poirier J, et al. Bi‐directional association of cerebrospinal fluid immune markers with stage of Alzheimer's disease pathogenesis. J Alzheimer's Dis. 2018;63:577‐590. [DOI] [PMC free article] [PubMed] [Google Scholar]
- 113. Kleineidam L, Chouraki V, Próchnicki T, et al. PLCG2 protective variant p.P522R modulates tau pathology and disease progression in patients with mild cognitive impairment. Acta Neuropathol. 2020;139:1025‐1044. [DOI] [PMC free article] [PubMed] [Google Scholar]
- 114. Arenaza‐Urquijo EM, Vemuri P. Resistance vs resilience to Alzheimer disease: clarifying terminology for preclinical studies. Neurology. 2018;90:695‐703. [DOI] [PMC free article] [PubMed] [Google Scholar]
- 115. Bauer CE, Brown CA, Gold BT, Alzheimer's Disease Neuroimaging I . Education does not protect cognitive function from brain pathology in the ADNI 2 cohort. Neurobiol Aging. 2020;90:147‐149. [DOI] [PMC free article] [PubMed] [Google Scholar]
- 116. Wada M, Noda Y, Shinagawa S, et al. Effect of education on Alzheimer's disease‐related neuroimaging biomarkers in healthy controls, and participants with mild cognitive impairment and Alzheimer's disease: a cross‐sectional study. J Alzheimer's Dis. 2018;63:861‐869. [DOI] [PubMed] [Google Scholar]
- 117. McKenzie C, Bucks RS, Weinborn M, et al. Cognitive reserve predicts future executive function decline in older adults with Alzheimer's Disease pathology but not age‐associated pathology. Neurobiol Aging. 2020;88:119‐127. [DOI] [PubMed] [Google Scholar]
- 118. van Loenhoud AC, van der Flier WM, Wink AM, et al. Cognitive reserve and clinical progression in Alzheimer disease: a paradoxical relationship. Neurology. 2019;93:e334‐e346. [DOI] [PMC free article] [PubMed] [Google Scholar]
- 119. Arenaza‐Urquijo EM, Przybelski SA, Lesnick TL, et al. The metabolic brain signature of cognitive resilience in the 80+: beyond Alzheimer pathologies. Brain. 2019;142:1134‐1147. [DOI] [PMC free article] [PubMed] [Google Scholar]
- 120. Van Hooren RWE, Riphagen JM, Jacobs HIL. Inter‐network connectivity and amyloid‐beta linked to cognitive decline in preclinical Alzheimer's disease: a longitudinal cohort study. Alzheimer's Res Ther. 2018;10:88. [DOI] [PMC free article] [PubMed] [Google Scholar]
- 121. Pizzi SD, Punzi M, Sensi SL, et al. Functional signature of conversion of patients with mild cognitive impairment. Neurobiol Aging. 2019;74:21‐37. [DOI] [PubMed] [Google Scholar]
- 122. Neitzel J, Franzmeier N, Rubinski A, Ewers M, Alzheimer's Disease Neuroimaging I . Left frontal connectivity attenuates the adverse effect of entorhinal tau pathology on memory. Neurology. 2019;93:e347‐e357. [DOI] [PMC free article] [PubMed] [Google Scholar]
- 123. Fischer FU, Wolf D, Fellgiebel A, Alzheimer's Disease Neuroimaging I . Connectivity and morphology of hubs of the cerebral structural connectome are associated with brain resilience in AD‐ and age‐related pathology. Brain Imaging Behav. 2019;13:1650‐1664. [DOI] [PubMed] [Google Scholar]
- 124. Dumitrescu L, Mahoney ER, Mukherjee S, et al. Genetic variants and functional pathways associated with resilience to Alzheimer's disease. Brain. 2020;143:2561‐2575. [DOI] [PMC free article] [PubMed] [Google Scholar]
- 125.Alzheimer's Association. Facts and figures. 2020.
- 126. Li R, Singh M. Sex differences in cognitive impairment and Alzheimer's disease. Front Neuroendocrinol. 2014;35:385‐403. [DOI] [PMC free article] [PubMed] [Google Scholar]
- 127. Sohn D, Shpanskaya K, Lucas JE, et al. Sex differences in cognitive decline in subjects with high likelihood of mild cognitive impairment due to Alzheimer's disease. Sci Rep. 2018;8:7490. [DOI] [PMC free article] [PubMed] [Google Scholar]
- 128. Liu M, Paranjpe MD, Zhou X, et al. Sex modulates the ApoE epsilon4 effect on brain tau deposition measured by (18)F‐AV‐1451 PET in individuals with mild cognitive impairment. Theranostics. 2019;9:4959‐4970. [DOI] [PMC free article] [PubMed] [Google Scholar]
- 129. Hohman TJ, Dumitrescu L, Barnes LL, et al. Sex‐specific association of apolipoprotein E with cerebrospinal fluid levels of tau. JAMA Neurol. 2018;75:989‐998. [DOI] [PMC free article] [PubMed] [Google Scholar]
- 130. Buckley RF, Scott MR, Jacobs HIL, et al. Sex mediates relationships between regional tau pathology and cognitive decline. Ann Neurol. 2020;88:921‐932. [DOI] [PMC free article] [PubMed] [Google Scholar]
- 131. Buckley RF, Mormino EC, Rabin JS, et al. Sex differences in the association of global amyloid and regional tau deposition measured by positron emission tomography in clinically normal older adults. JAMA Neurol. 2019;76:542‐551. [DOI] [PMC free article] [PubMed] [Google Scholar]
- 132. Shokouhi S, Taylor WD, Albert K, Kang H, Newhouse PA, Alzheimer's Disease Neuroimaging I . In vivo network models identify sex differences in the spread of tau pathology across the brain. Alzheimer's Dement. 2020;12:e12016. [DOI] [PMC free article] [PubMed] [Google Scholar]
- 133. Sundermann EE, Tran M, Maki PM, Bondi MW. Sex differences in the association between apolipoprotein E ε4 allele and Alzheimer's disease markers. Alzheimers Dement (Amst). 2018;10:438‐447. [DOI] [PMC free article] [PubMed] [Google Scholar]
- 134. Sundermann EE, Panizzon MS, Chen X, Andrews M, Galasko D, Banks SJ. Sex differences in Alzheimer's‐related Tau biomarkers and a mediating effect of testosterone. Biol sex Differ. 2020;11:33. [DOI] [PMC free article] [PubMed] [Google Scholar]
- 135. Arnold M, Nho K, Kueider‐Paisley A, et al. Sex and APOE ε4 genotype modify the Alzheimer's disease serum metabolome. Nat Commun. 2020;11:1148. [DOI] [PMC free article] [PubMed] [Google Scholar]
- 136. Landau SM, Lu M, Joshi AD, et al. Comparing positron emission tomography imaging and cerebrospinal fluid measurements of beta‐amyloid. Ann Neurol. 2013;74:826‐836. [DOI] [PMC free article] [PubMed] [Google Scholar]
- 137. Jagust WJ, Landau SM, Shaw LM, et al. Relationships between biomarkers in aging and dementia. Neurology. 2009;73:1193‐1199. [DOI] [PMC free article] [PubMed] [Google Scholar]
- 138. Guo TF, Shaw LM, Trojanowski JQ, Jagust WJ, Landau SM, Alzheimers Dis Neuroimaging I . Association of CSF A beta, amyloid PET, and cognition in cognitively unimpaired elderly adults. Neurology. 2020;95:E2075‐E2085. [DOI] [PMC free article] [PubMed] [Google Scholar]
- 139. Klunk WE, Koeppe RA, Price JC, et al. The Centiloid Project: standardizing quantitative amyloid plaque estimation by PET. Alzheimer's Dement. 2015;11:1‐15.e1‐e4. [DOI] [PMC free article] [PubMed] [Google Scholar]
- 140. Blennow K, Shaw LM, Stomrud E, et al. Predicting clinical decline and conversion to Alzheimer's disease or dementia using novel Elecsys Abeta(1‐42), pTau and tTau CSF immunoassays. Sci Rep. 2019;9:19024. [DOI] [PMC free article] [PubMed] [Google Scholar]
- 141. Hansson O, Seibyl J, Stomrud E, et al. CSF biomarkers of Alzheimer's disease concord with amyloid‐beta PET and predict clinical progression: a study of fully automated immunoassays in BioFINDER and ADNI cohorts. Alzheimer's Dement. 2018;14:1470‐1481. [DOI] [PMC free article] [PubMed] [Google Scholar]
- 142. Liu JL, Hlavka JP, Hillestad R, Mattke S. Assessing the Preparedness of the U.S. Health Care System Infrastructure for an Alzheimer's Treatment. Santa Monica, CA: RAND Corporation; 2017. [PMC free article] [PubMed] [Google Scholar]
- 143. Maserejian N, Bian S, Wang W, et al. Practical algorithms for amyloid beta probability in subjective or mild cognitive impairment. Alzheimer's Dement. 2019;11:180. [DOI] [PMC free article] [PubMed] [Google Scholar]
- 144. Lee JH, Byun MS, Yi D, et al. Prediction of cerebral amyloid with common information obtained from memory clinic practice. Front Aging Neurosci. 2018;10:309. [DOI] [PMC free article] [PubMed] [Google Scholar]
- 145. Ezzati A, Harvey DJ, Habeck C, et al. Predicting amyloid‐beta levels in amnestic mild cognitive impairment using machine learning techniques. J Alzheimer's Dis. 2020;73:1211‐1219. [DOI] [PMC free article] [PubMed] [Google Scholar]
- 146. Casamitjana A, Petrone P, Tucholka A, et al. MRI‐based screening of preclinical Alzheimer's disease for prevention clinical trials. J Alzheimer's Dis. 2018;64:1099‐1112. [DOI] [PubMed] [Google Scholar]
- 147. Ashford MT, Veitch DP, Neuhaus J, Nosheny RL, Tosun D, Weiner MW. The search for a convenient procedure to detect one of the earliest signs of Alzheimer's disease: a systematic review of the prediction of brain amyloid status. Alzheimer's Dement. 2021;17(5):866‐887. [DOI] [PubMed] [Google Scholar]
- 148. Palmqvist S, Insel PS, Zetterberg H, et al. Accurate risk estimation of beta‐amyloid positivity to identify prodromal Alzheimer's disease: cross‐validation study of practical algorithms. Alzheimer's Dement. 2019;15:194‐204. [DOI] [PMC free article] [PubMed] [Google Scholar]
- 149. Goudey B, Fung BJ, Schieber C, Faux NG, Alzheimer's disease metabolomics C, Alzheimer's disease neuroimaging I . A blood‐based signature of cerebrospinal fluid Abeta1‐42 status. Sci Rep. 2019;9:4163. [DOI] [PMC free article] [PubMed] [Google Scholar]
- 150. Biomarker Consortium FftNIfH . Biomarkers Consortium—Plasma Aβ as a Predictor of Amyloid Positivity in Alzheimer's Disease. Biomarker Consortium FftNIfH; 2020. [Google Scholar]
- 151. Moscoso A, Grothe MJ, Ashton NJ, et al. Time course of phosphorylated‐tau181 in blood across the Alzheimer's disease spectrum. Brain. 2020;144(1):325‐339. [DOI] [PMC free article] [PubMed] [Google Scholar]
- 152. Tosun D, Veitch DP, Aisen P,, et al. Detection of β‐amyloid positivity in ADNI with demographics, cognition, MRI, and plasma biomarkers. Brain Commun. 2021;3(2):fcab008. [DOI] [PMC free article] [PubMed] [Google Scholar]
- 153. Karikari TK, Benedet AL, Ashton NJ, et al. Diagnostic performance and prediction of clinical progression of plasma phospho‐tau181 in the Alzheimer's Disease Neuroimaging Initiative. Mol Psychiatry. 2020;26(2):429‐442. [DOI] [PubMed] [Google Scholar]
- 154. Teunissen CE, Thijssen EH, Verberk IMW. Plasma p‐tau217: from ‘new kid’ to most promising candidate for Alzheimer's disease blood test. Brain. 2020;143:3170‐3172. [DOI] [PMC free article] [PubMed] [Google Scholar]
- 155. Benedet AL, Leuzy A, Pascoal TA, et al. Stage‐specific links between plasma neurofilament light and imaging biomarkers of Alzheimer's disease. Brain. 2020;143:3793‐3804. [DOI] [PMC free article] [PubMed] [Google Scholar]
- 156. Lee T, Lee H. Prediction of Alzheimer's disease using blood gene expression data. Sci Rep. 2020;10:3485. [DOI] [PMC free article] [PubMed] [Google Scholar]
- 157. Varma VR, Oommen AM, Varma S, et al. Brain and blood metabolite signatures of pathology and progression in Alzheimer disease: a targeted metabolomics study. PLoS Med. 2018;15:e1002482. [DOI] [PMC free article] [PubMed] [Google Scholar]
- 158. Huynh K, Lim WLF, Giles C, et al. Concordant peripheral lipidome signatures in two large clinical studies of Alzheimer's disease. Nat Commun. 2020;11:5698. [DOI] [PMC free article] [PubMed] [Google Scholar]
- 159. Bernath MM, Bhattacharyya S, Nho K, et al. Serum triglycerides in Alzheimer disease: relation to neuroimaging and CSF biomarkers. Neurology. 2020;94:E2088‐E2098. [DOI] [PMC free article] [PubMed] [Google Scholar]
- 160. Riedel BC, Daianu M, Ver Steeg G, et al. Uncovering biologically coherent peripheral signatures of health and risk for Alzheimer's disease in the aging brain. Front Aging Neurosci. 2018;10:390. [DOI] [PMC free article] [PubMed] [Google Scholar]
- 161. Grill JD, Nuno MM, Gillen DL, Alzheimer's Disease Neuroimaging I . Which MCI patients should be included in prodromal Alzheimer disease clinical trials? Alzheimer Dis Assoc Disord. 2019;33:104‐112. [DOI] [PMC free article] [PubMed] [Google Scholar]
- 162. Franzmeier N, Koutsouleris N, Benzinger T, et al. Predicting sporadic Alzheimer's disease progression via inherited Alzheimer's disease‐informed machine‐learning. Alzheimer's Dement. 2020;16:501‐511. [DOI] [PMC free article] [PubMed] [Google Scholar]
- 163. Tabatabaei‐Jafari H, Shaw ME, Walsh E, Cherbuin N, Alzheimer's Disease Neuroimaging I . Regional brain atrophy predicts time to conversion to Alzheimer's disease, dependent on baseline volume. Neurobiol Aging. 2019;83:86‐94. [DOI] [PubMed] [Google Scholar]
- 164. Kling MA, Goodenowe DB, Senanayake V, et al. Circulating ethanolamine plasmalogen indices in Alzheimer's disease: relation to diagnosis, cognition, and CSF tau. Alzheimer's Dement. 2020;16:1234‐1247. [DOI] [PMC free article] [PubMed] [Google Scholar]
- 165. Insel PS, Weiner M, Mackin RS, et al. Determining clinically meaningful decline in preclinical Alzheimer disease. Neurology. 2019;93:E322‐E332. [DOI] [PMC free article] [PubMed] [Google Scholar]
- 166. Hadjichrysanthou C, Ower AK, de Wolf F, Anderson RM, Alzheimer's Disease Neuroimaging I . The development of a stochastic mathematical model of Alzheimer's disease to help improve the design of clinical trials of potential treatments. PloS One. 2018;13:e0190615. [DOI] [PMC free article] [PubMed] [Google Scholar]
- 167. Grothe MJ, Barthel H, Sepulcre J, et al. In vivo staging of regional amyloid deposition. Neurology. 2017;89:2031‐2038. [DOI] [PMC free article] [PubMed] [Google Scholar]
- 168. Vogel JW, Vachon‐Presseau E, Pichet Binette A, et al. Brain properties predict proximity to symptom onset in sporadic Alzheimer's disease. Brain. 2018;141:1871‐1883. [DOI] [PMC free article] [PubMed] [Google Scholar]
- 169. Papp KV, Buckley R, Mormino E, et al. Clinical meaningfulness of subtle cognitive decline on longitudinal testing in preclinical AD. Alzheimers Dement. 2020;16:552‐560. [DOI] [PMC free article] [PubMed] [Google Scholar]
- 170. Thomas KR, Bangen KJ, Weigand AJ, et al. Objective subtle cognitive difficulties predict future amyloid accumulation and neurodegeneration. Neurology. 2020;94:E397‐E406. [DOI] [PMC free article] [PubMed] [Google Scholar]
- 171. Elman JA, Panizzon MS, Gustavson DE, et al. Amyloid‐β positivity predicts cognitive decline but cognition predicts progression to amyloid‐β positivity. Biol Psychiatry. 2020;87:819‐828. [DOI] [PMC free article] [PubMed] [Google Scholar]
- 172. Thomas KR, Edmonds EC, Eppig J, Salmon DP, Bondi MW, Initi AsDN . Using neuropsychological process scores to identify subtle cognitive decline and predict progression to mild cognitive impairment. J Alzheimers Dis. 2018;64:195‐204. [DOI] [PMC free article] [PubMed] [Google Scholar]
- 173. Thomas KR, Eppig J, Edmonds EC, et al. Word‐list intrusion errors predict progression to mild cognitive impairment. Neuropsychology. 2018;32:235‐245. [DOI] [PMC free article] [PubMed] [Google Scholar]
- 174. Gleason CE, Norton D, Anderson ED, et al. Cognitive variability predicts incident Alzheimer's disease and mild cognitive impairment comparable to a cerebrospinal fluid biomarker. J Alzheimer's Dis. 2018;61:79‐89. [DOI] [PMC free article] [PubMed] [Google Scholar]
- 175. Halliday DWR, Gawryluk JR, Garcia‐Barrera MA, MacDonald SWS. White matter integrity is associated with intraindividual variability in neuropsychological test performance in healthy older adults. Front Human Neurosci. 2019;13:352. [DOI] [PMC free article] [PubMed] [Google Scholar]
- 176. Bangen KJ, Weigand AJ, Thomas KR, et al. Cognitive dispersion is a sensitive marker for early neurodegenerative changes and functional decline in nondemented older adults. Neuropsychology. 2019;33:599‐608. [DOI] [PMC free article] [PubMed] [Google Scholar]
- 177. Nosheny RL, Jin C, Neuhaus J, et al. Study partner‐reported decline identifies cognitive decline and dementia risk. Ann Clin Transl Neurol. 2019;6:2448‐2459. [DOI] [PMC free article] [PubMed] [Google Scholar]
- 178. Ryan MM, Grill JD, Gillen DL, Alzheimer's Disease Neuroimaging I . Participant and study partner prediction and identification of cognitive impairment in preclinical Alzheimer's disease: study partner vs. participant accuracy. Alzheimer's Res Ther. 2019;11:85. [DOI] [PMC free article] [PubMed] [Google Scholar]
- 179. Swinford CG, Risacher SL, Charil A, Schwarz AJ, Saykin AJ. Memory concerns in the early Alzheimer's disease prodrome: regional association with tau deposition. Alzheimers Dement. 2018;10:322‐331. [DOI] [PMC free article] [PubMed] [Google Scholar]
- 180. Moons KG, Kengne AP, Grobbee DE, et al. Risk prediction models: II. External validation, model updating, and impact assessment. Heart. 2012;98:691‐698. [DOI] [PubMed] [Google Scholar]
- 181. Spencer BE, Jennings RG, Brewer JB, Initiative AsDN . Combined biomarker prognosis of mild cognitive impairment: an 11‐year follow‐up study in the Alzheimer's Disease Neuroimaging Initiative. J Alzheimer's Dis. 2019;68:1549‐1559. [DOI] [PMC free article] [PubMed] [Google Scholar]
- 182. van Maurik IS, Slot RER, Verfaillie SCJ, et al. Personalized risk for clinical progression in cognitively normal subjects‐the ABIDE project. Alzheimer's Res Ther. 2019;11:33. [DOI] [PMC free article] [PubMed] [Google Scholar]
- 183. van Maurik IS, Vos SJ, Bos I, et al. Biomarker‐based prognosis for people with mild cognitive impairment (ABIDE): a modelling study. Lancet Neurol. 2019;18:1034‐1044. [DOI] [PubMed] [Google Scholar]
- 184. Jang J‐W, Park JH, Kim S, et al. A ‘comprehensive visual rating scale 'for predicting progression to dementia in patients with mild cognitive impairment. PloS One. 2018;13:e0201852. [DOI] [PMC free article] [PubMed] [Google Scholar]
- 185. Licher S, Leening MJG, Yilmaz P, et al. Development and validation of a dementia risk prediction model in the general population: an analysis of three longitudinal studies. Am J Psychiat. 2019;176:543‐551. [DOI] [PubMed] [Google Scholar]
- 186. Jo T, Nho K, Saykin AJ. Deep learning in Alzheimer's disease: diagnostic classification and prognostic prediction using neuroimaging data. Front Aging Neurosci. 2019;11:220. [DOI] [PMC free article] [PubMed] [Google Scholar]
- 187. Ledig C, Schuh A, Guerrero R, Heckemann RA, Rueckert D. Structural brain imaging in Alzheimer's disease and mild cognitive impairment: biomarker analysis and shared morphometry database. Sci Rep. 2018;8(1):11258. [DOI] [PMC free article] [PubMed] [Google Scholar]
- 188. Samper‐Gonzalez J, Burgos N, Bottani S, et al. Reproducible evaluation of classification methods in Alzheimer's disease: framework and application to MRI and PET data. NeuroImage. 2018;183:504‐521. [DOI] [PubMed] [Google Scholar]
- 189. Qiu S, Joshi PS, Miller MI, et al. Development and validation of an interpretable deep learning framework for Alzheimer's disease classification. Brain. 2020;143:1920‐1933. [DOI] [PMC free article] [PubMed] [Google Scholar]
- 190. Ma Z, Jing B, Li Y, et al. Identifying mild cognitive impairment with random forest by integrating multiple MRI morphological metrics. J Alzheimer's Dis. 2020;73:991‐1002. [DOI] [PubMed] [Google Scholar]
- 191. Wang Q, Guo L, Thompson PM, et al. The added value of diffusion‐weighted mri‐derived structural connectome in evaluating mild cognitive impairment: a multi‐cohort validation. J Alzheimers Dis. 2018;64:149‐169. [DOI] [PMC free article] [PubMed] [Google Scholar]
- 192. Chen JC, Shu G, Chen H, et al. Predicting progression from mild cognitive impairment to Alzheimer's disease on an individual subject basis by applying the CARE index across different independent cohorts. Aging (Albany NY). 2019;11:2185‐2201. [DOI] [PMC free article] [PubMed] [Google Scholar]
- 193. Li HM, Habes M, Wolk DA, Fan Y, Alzheimer's Dis Neuroimaging I, Australian Imaging B . A deep learning model for early prediction of Alzheimer's disease dementia based on hippocampal magnetic resonance imaging data. Alzheimers Dement. 2019;15:1059‐1070. [DOI] [PMC free article] [PubMed] [Google Scholar]
- 194. Birkenbihl C, Salimi Y, Domingo‐Fernándéz D, Lovestone S, Fröhlich H, Hofmann‐Apitius M. Evaluating the Alzheimer's disease data landscape. Alzheimer's Dement. 2020;6:e12102. [DOI] [PMC free article] [PubMed] [Google Scholar]
- 195. Blue EE, Horimoto A, Mukherjee S, Wijsman EM, Thornton TA. Local ancestry at APOE modifies Alzheimer's disease risk in Caribbean Hispanics. Alzheimer's Dement. 2019;15:1524‐1532. [DOI] [PMC free article] [PubMed] [Google Scholar]
- 196. Babenko VN, Afonnikov DA, Ignatieva EV, Klimov AV, Gusev FE, Rogaev EI. Haplotype analysis of APOE intragenic SNPs. BMC Neurosci. 2018;19:16. [DOI] [PMC free article] [PubMed] [Google Scholar]
- 197. Choi YY, Lee JJ, Choi KY, et al. The aging slopes of brain structures vary by ethnicity and sex: evidence from a large magnetic resonance imaging dataset from a single scanner of cognitively healthy elderly people in Korea. Front Aging Neurosci. 2020;12:233. [DOI] [PMC free article] [PubMed] [Google Scholar]
- 198. Duara R, Loewenstein DA, Lizarraga G, et al. Effect of age, ethnicity, sex, cognitive status and APOE genotype on amyloid load and the threshold for amyloid positivity. NeuroImage Clin. 2019;22:101800. [DOI] [PMC free article] [PubMed] [Google Scholar]
- 199. Stickel A, McKinnon A, Ruiz J, Grilli MD, Ryan L. The impact of cardiovascular risk factors on cognition in Hispanics and non‐Hispanic whites. Learn Mem. 2019;26:235‐244. [DOI] [PMC free article] [PubMed] [Google Scholar]
- 200. Kikuchi M, Adachi N, Matsumaru N, Tsukamoto K. Current landscape of late‐phase clinical trials for Alzheimer's disease: comparing regional variation between subjects in Japan and North America. Pharmaceut Med. 2019;33:511‐518. [DOI] [PubMed] [Google Scholar]
- 201. Iwatsubo T, Iwata A, Suzuki K, et al. Japanese and North American Alzheimer's disease neuroimaging initiative studies: harmonization for international trials. Alzheimer's Dement. 2018;14:1077‐1087. [DOI] [PubMed] [Google Scholar]
- 202. Illán‐Gala I, Pegueroles J, Montal V, et al. Challenges associated with biomarker‐based classification systems for Alzheimer's disease. Alzheimer's Dement. 2018;21:346‐357. [DOI] [PMC free article] [PubMed] [Google Scholar]
- 203. Hayes JP, Moody JN, Roca JG, Hayes SM, Alzheimer's Disease Neuroimaging I . Body mass index is associated with smaller medial temporal lobe volume in those at risk for Alzheimer's disease. NeuroImage Clin. 2019;25:102156. [DOI] [PMC free article] [PubMed] [Google Scholar]
- 204. Lao PJ, Brickman AM, Initiative AsDN . Multimodal neuroimaging study of cerebrovascular disease, amyloid deposition, and neurodegeneration in Alzheimer's disease progression. Alzheimer's Dement. 2018;10:638‐646. [DOI] [PMC free article] [PubMed] [Google Scholar]
Associated Data
This section collects any data citations, data availability statements, or supplementary materials included in this article.
Supplementary Materials
Supporting Information
Supporting Information
Supporting Information