Abstract
A new approach to the community-level BIOLOG assay was proposed. This assay, which we call the BIOLOG-MPN assay, is a most-probable-number (MPN) assay that uses BIOLOG plates and multiple sole carbon sources, and the profiles obtained by this assay consist of MPNs estimated for the substrates in the BIOLOG plates. In order to demonstrate the performance of the BIOLOG-MPN assay, it was applied to pure cultures, model bacterial communities that contain two strains in different ratios, and microbial community samples. MPN estimation using BIOLOG plates worked well for the substrates on which utilizers can grow at a sufficiently high rate for color development under the conditions of the assay procedure. Furthermore, the results obtained using model communities showed that the MPNs obtained reflected the mixing ratios of pure cultures in the model communities. The profiles obtained using model communities and community samples were differentiated properly by statistical analyses. The results suggest that the BIOLOG-MPN assay is a promising procedure for obtaining a quantitative picture of the community structure.
The BIOLOG assay, which is a sole-carbon-source test, was originally developed to identify microbial isolates based on their substrate utilization profiles. Since the proposal of the direct inoculation of environmental samples into BIOLOG plates (3), the community-level BIOLOG assay has become popular because of its rapidity and simplicity. Although the community-level substrate utilization profiles seem to work well in differentiating microbial community samples of various types, recent studies and reviews have pointed out that the interpretation of the results requires much care (2, 5, 6, 8, 10, 11). The major caveats can be summarized as follows: (i) the inoculum density and incubation time are arbitrary, and (ii) the substrate utilization profiles obtained do not reflect the nature or structure of the original microbial communities from which the samples were taken.
It is well-known that the inoculum density has a considerable effect on the rate of color development. In order to reduce the effect of arbitrariness in inoculum density, normalization procedures are often applied. A straightforward way is the normalization of the inoculum size. However, it has been argued that this type of normalization has the disadvantage of being time-consuming; moreover, it is unclear which cell enumeration method should be used (2). Another way is the normalization of color development based on the average well color development (AWCD). The simplest procedure for this type of normalization is to divide the color development in each well by AWCD. However, it has been pointed out that this type of normalization is effective only when the initial cell density does not differ markedly among the samples compared (6). It is often recommended that the inoculum density be kept as high as possible because a low inoculum density may increase the lag time in color development (5, 8). A prolonged lag time means that rare and/or slow-growing populations cannot contribute to the resulting substrate utilization profile. Another reason is that the low inoculum density may exclude rare populations in the inoculum. The absence of rare populations in highly diluted samples was discussed theoretically (8) and was suggested based on the result obtained from a study using a dilution series of inoculum (12). An improved procedure for reducing the effect of differences in the rate of color development is the comparison of samples among plate readings of equivalent AWCD (2). In this procedure, the incubation time is not fixed but dependent on the rate of color development.
Regarding the reduction of the effect of the arbitrariness of incubation time, statistical analyses based on the parameters representing the kinetics of color development (11) and the area under the curve of color development (4, 9) were proposed. Concerning experimental procedures, there are two conflicting general recommendations: one is that prolonged incubation time is preferable because it can eliminate most of the effect of inoculum densities (12), and the other is that short incubation time with high inoculum density is preferable because it is effective for reducing the enrichment effect (2).
Since the alteration of the community structure, i.e., the enrichment effect, occurs during incubation of BIOLOG plates, it has been pointed out that the substrate utilization profile reflects the resulting community produced, not the original microbial communities from which the samples were obtained (2, 5, 6, 8, 10, 11). Alteration of the community structure is inevitable because samples need a certain incubation period to attain sufficient cell density, i.e., approximately 108 cells/ml, for color development. In particular, in the case of environmental samples, one sample would contain populations with undetermined cell densities exhibiting a variety of kinetic responses in BIOLOG plates. In other words, we cannot know a priori which of the populations in a sample contribute to the color development under a certain combination of inoculum density and incubation time. Consequently, the color development observed cannot be interpreted in terms of the number of utilizers or the metabolic potential of the original microbial community (5).
In this study, we investigated a new approach to the community-level BIOLOG assay, where we introduced the concept of most probable number (MPN). MPN is one of the most popular and conventional enumeration procedures. By using a medium containing a sole carbon source for MPN enumeration, the cell density of utilizers specific to the carbon source can be estimated. Thus, our new approach, which we call BIOLOG-MPN assay, is a MPN estimation method that uses BIOLOG plates and multiple sole carbon sources. The profile obtained by the BIOLOG-MPN assay consists of cell densities of utilizers of substrates contained in BIOLOG plates.
MATERIALS AND METHODS
Sample preparation.
Three types of samples were prepared: pure cultures, model communities, and community samples. As pure cultures, Escherichia coli JM109 (Takara Shuzo Co., Ltd., Kyoto, Japan) and Pseudomonas aureofaciens IAM12353 (IAM Culture Collection, Institute of Molecular and Cellular Biosciences, The University of Tokyo) were used. The pure cultures were prepared as follows: first, the cells were precultivated on nutrient broth (NB) agar medium and then transferred onto tryptic soy broth (TSB) agar medium and incubated at 30°C for 1 day. Then, colonies on the plates were swabbed and resuspended in 50 mM phosphate buffer (pH 7) so that the suspension would have a transmittance level of 20%. The cell concentration of the suspension was confirmed to be approximately 1.1 × 10⁹ cells/ml by the direct counting method with acridine orange (7). Three model communities were prepared by mixing two suspensions of the pure cultures described above at three E. coli-to-P. aureofaciens ratios, namely, 1,000:1 (mixture A [MIX_A]), 1:1 (MIX_B), and 1:1,000 (MIX_C).
As microbial community samples, four samples of activated sludge taken from a municipal wastewater treatment plant (WTP_1 to WTP_4) were tested. They were taken from the same plant in four different seasons. In addition, two samples of activated sludge fed by artificial wastewater were also tested; one was fed with phenol (PHEN) as the carbon source, and the other was fed with aniline (ANI) as the carbon source. They were taken from the reactors in our laboratory. The feeds contained PHEN or ANI at a concentration of 500 mg/liter. The reactors were run in a semicontinuous process, that is, half of the volume of the reactor was exchanged with fresh feed once a day. Activated sludges were stored in a refrigerator for 3 or 4 days after they were collected. A sample was prepared as follows: (i) the sample was washed twice with 50 mM phosphate buffer by centrifugation at 8,000 × g for 15 min followed by removal of the resulting supernatant; (ii) the sample concentration was adjusted to 100 mg of suspended solids (SS) per liter using 50 mM phosphate buffer, and (iii) sonicated for 2 min at 40 W (Insonator 201 M; Kubota Ltd., Tokyo, Japan).
A dilution series was then prepared for each sample. The initial cell density, which was prepared to be a transmittance level of 20% for pure cultures and model communities and 100 mg of SS per liter for activated sludge samples, was referred to as the dilution level (DL) of zero. The dilution step was set at 10-fold. Thus, the cell density at DL = 5, for example, is 10−5 of that at DL = 0. The dilution series for pure cultures and model communities had a range of 11 orders of magnitude, and those for community samples had a range of 5 to 7 orders of magnitude. Phosphate buffer of 50 mM was used for preparing the dilution series.
Inoculation and incubation.
One BIOLOG ECO plate (BIOLOG Inc., Hayward, Calif.), which was used in this study, has three replicates of a set of 31 substrates and one blank well. Six replicates were prepared, using two BIOLOG ECO plates for each DL. The inoculation volume was 150 μl/well. The plates were incubated at 30°C for 2 weeks (pure cultures and model communities) or 1 week (community samples). The optical density (OD) values were measured at a wavelength of 595 nm with a plate reader (Microplate Reader model 3550; Bio-Rad, Richmond, Calif.). The difference between the OD values at the beginning and end of incubation was regarded as the increase in OD values for the well. The average increase of the OD value in six blank wells was then subtracted from the increase in the OD value, with the difference being the net increase.
MPN estimation and statistical analyses.
The net increase in the OD value was translated into a positive or negative response with the threshold OD value of 0.3. Since there are six replicates, each substrate may yield zero to six positive responses at each DL. The MPNs were estimated based on the maximum-likelihood estimation as follows. When it is assumed that cells are randomly distributed in the suspension of the sample, the probability that a certain number of positive wells will be observed at a certain DL is calculated by the following equations:
 |
1 |
 |
where d is the cell density (number of cells per milliliter) at DL = 0, mi is the expected number of cells in a well at DL = i, Ni is the observed number of positive wells at DL = i, and Li is the probability that the number of positive wells is observed to be mi at DL = i. For the MPN estimation, four consecutive DLs (DLs = i, i + 1, i + 2, i + 3, 0 < i < maximum DL − 3) for which the difference between mi and mi + 3 may be maximized were selected. The MPN was then determined as the value of d which maximizes the likelihood function (equation 2). The calculation was executed by using Microsoft Excel 5.0 for Macintosh.
 |
2 |
Here, L is the likelihood function that represents the probability that the numbers of positive wells for the four consecutive DLs are exactly the same as in the observation when the cell density at DL = 0 is d.
The set of logarithmically transformed MPNs for 31 substrates and one blank was regarded as the profile representative of the sample. In the case where no positive response was observed even at DL = 0, the MPN was regarded to be 0.4 cell/ml. This cell density gives the expected cell number introduced into a well of 0.06 cell/well, which corresponds to no positive response in all six replicates at a probability of 0.7. Statistical analyses, such as principal component analysis or cluster analysis, were applied in order to examine the similarity in profiles among the samples. Principal component analysis was applied to pure cultures and model communities. The cluster analysis was applied to community samples, where the distance between profiles was measured as the Euclidean distance and the group average method was applied as the linkage strategy. These statistical analyses were executed with STATISTICA version 5 for MS Windows (StatSoft, Inc., Tulsa, Okla.).
Effectiveness of MPN estimation using BIOLOG plates.
Using BIOLOG MT plates, 84 replicates for each DL were prepared. Three combinations of substrate and inoculum were tested: xylose and the pure culture of E. coli, l-asparagine and the pure culture of E. coli, and d-xylose and an activated-sludge sample obtained from a municipal wastewater treatment plant. The concentration of substrate in each well was 0.3 mg/well. The samples were prepared as described in “Sample preparation” above. After 2 weeks of incubation, the number of positive wells at each DL was counted with the threshold for positive response of OD = 0.3. Then, the observed number of positive responses at each DL was estimated as follows. Assuming that cells are distributed randomly in the sample suspensions and that the number of positive responses follows a Poisson distribution, the expected number of positive wells at each DL was estimated by the following equation:
 |
3 |
where Ni is the expected number of positive wells at DL = i and d is the cell density (number of cells per milliliter) at DL = 0. The value of d was determined so that the expected number of positive wells at each DL can show the best agreement with the observation.
RESULTS
MPN estimations.
The result of analyzing the effectiveness of MPN estimation using BIOLOG plates (Table 1) indicates that the numbers of positive wells expected based on the Poisson distribution showed good agreement with the observations. Furthermore, in the tests using the pure culture of E. coli, the MPNs obtained were similar to the inoculum cell density of approximately 109 cells/ml confirmed by direct counting using acridine orange.
TABLE 1.
MPN estimation using BIOLOG plates
| DL or estimated cell density | Observed (expected) no.a of positive wells with the following inoculum and substrate:
|
||
|---|---|---|---|
|
E. coli
|
WTP (xylose) | ||
| Xylose | Asparagine | ||
| 1 | 84 (84.0) | 84 (84.0) | 84 (84.0) |
| 2 | 84 (84.0) | 84 (84.0) | 83 (83.8) |
| 3 | 84 (84.0) | 84 (84.0) | 39 (37.9) |
| 4 | 83 (84.0) | 84 (84.0) | 4 (4.9) |
| 5 | 84 (84.0) | 84 (84.0) | 1 (0.5) |
| 6 | 84 (84.0) | 84 (84.0) | 0 (0.1) |
| 7 | 84 (84.0) | 84 (84.0) | |
| 8 | 76 (75.1) | 69 (70.1) | |
| 9 | 15 (16.9) | 14 (13.8) | |
| 10 | 3 (1.9) | 4 (1.5) | |
| 11 | 1 (0.2) | 0 (0.2) | |
| Estimated cell density at DL = 0b (no. of cells/ml) | 1.5 × 10⁹ | 1.2 × 10⁹ | 4.0 × 10³ |
The observed number of positive wells of 84 replicates and the expected number (shown in parentheses) are shown.
The cell densities at DL = 0 were determined so that the expected numbers would show the best agreement with the observations.
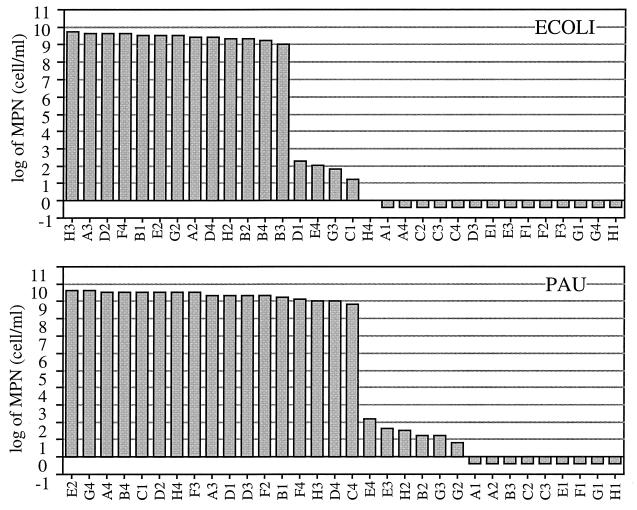
Figure 1 shows the MPNs obtained for the two pure cultures of E. coli and P. aureofaciens, where the substrates are in the order of estimated MPNs. MPNs for some substrates were estimated to be approximately 109 cells/ml, which corresponds to the inoculum cell density confirmed by direct counting with acridine orange. On the other hand, MPNs for other substrates were estimated to be less than 103 cells/ml.
FIG. 1.
MPNs obtained for pure cultures of E. coli (ECOLI), and P. aureofaciens (PAU), using BIOLOG ECO plates. Substrates are given in the order of the estimated MPNs.
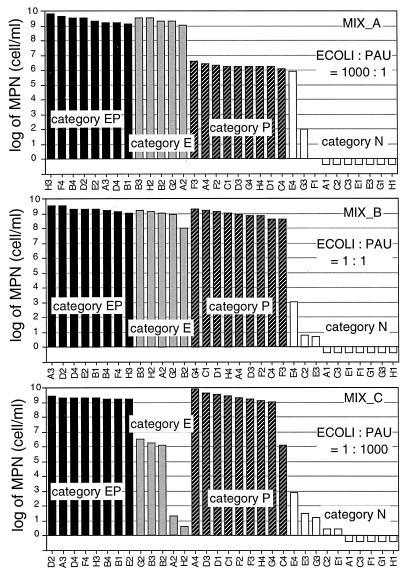
The results for model communities are shown in Fig. 2, in which the substrates were categorized into four categories based on the results shown in Fig. 1: substrates for which MPNs can be estimated correctly for both bacteria (category EP), those for E. coli only (category E), those for P. aureofaciens only (category P), and those for neither (category N). For all substrates included in category EP, the MPNs were estimated to be approximately 109 cells/ml for the three model communities. The MPNs for category E substrates were estimated to be approximately 109 cells/ml for MIX_A and MIX_B and 106 cells/ml for MIX_C (substrates A2 [β-methyl-d-glucoside] and H2 [dl-α-glycerol phosphate] were the exceptions). Likewise, the MPNs for category P substrates were estimated to be approximately 109 cells/ml for MIX_B and MIX_C and approximately 106 cells/ml for MIX_A (substrate C4 [l-phenylalanine] was the exception). As for category N, MPNs for all substrates except E4 (l-threonine) were estimated to be less than 103 cells/ml. These observations agree with the ratio of the two strains contained in the model communities.
FIG. 2.
MPNs obtained for the model communities. The substrates are categorized into four categories based on the results shown in Fig. 1.
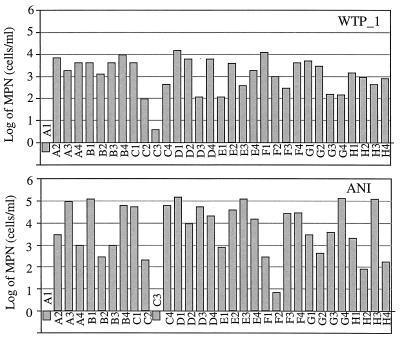
The MPNs for community samples were estimated to be in the range from nearly 0 to 106 cells/ml, depending on the sample inoculated and the substrate. Figure 3 shows the profiles of ANI and WTP_1 based on MPNs as examples.
FIG. 3.
Examples of profiles based on MPNs obtained for community samples.
Statistical analyses.
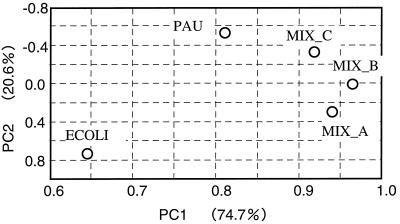
Figure 4 shows the results of the principal component analysis applied to the profiles of pure cultures and model communities. The profile of MIX_A was found to be between those of E. coli and MIX_B, while the profile of MIX_C was found to be between those of P. aureofaciens and MIX_B. The first component accounted for 74.7% of the variation in the data and the second component accounted for 20.6%.
FIG. 4.
Principal component analysis of profiles based on MPNs of pure cultures and model communities. Abbreviations: PC1 and PC2, first and second components of principal component analysis, respectively; ECOLI, E. coli; PAU, P. aureofaciens.
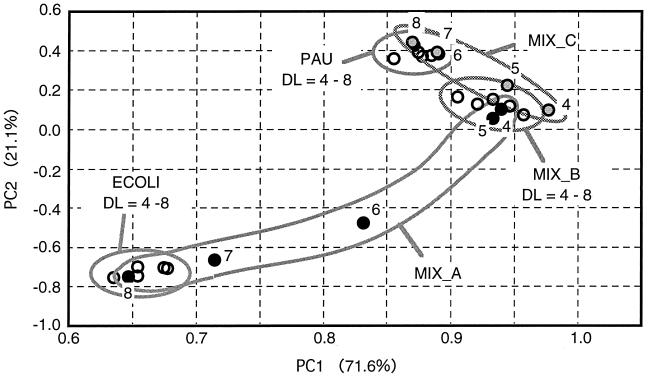
Profiles based on color development were also examined by principal component analysis. The profile for each sample at each dilution level was obtained by averaging the net increases in OD values from six replicates measured after 2 weeks of incubation. Figure 5 shows 25 profiles that were obtained from five samples at five DLs each. Figure 5 shows that the positions of the profiles for the two pure cultures and MIX_B were stable and independent of the DL and that their relative positions were similar to those in Fig. 4. On the other hand, the positions of MIX_A profiles and MIX_C profiles changed, depending on the DL. The profiles of both MIX_A and MIX_C at lower DLs, DLs = 4 and 5, were located near that of MIX_B. However, in the case of MIX_A, the profiles at higher DLs, DLs = 7 and 8, were near those of E. coli. In the case of MIX_C, the profiles at higher DLs, DLs = 6, 7, and 8, were located near those of P. aureofaciens. The first component accounted for 71.6% of the variation in the data, and the second component accounted for 21.1%.
FIG. 5.
Principal component analysis of profiles based on color development obtained for pure cultures and model communities. The profiles at DLs of 4 to 8 are included. For MIX_A and MIX_C, the number of each DL is shown. Black and shaded circles represent the profiles of MIX_A and MIX_C, respectively. Abbreviations: PC1 and PC2, first and second components of principal component analysis, respectively; ECOLI, E. coli; PAU, P. aureofaciens.
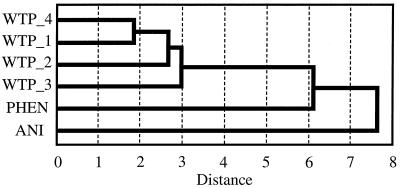
The results of cluster analysis applied to the profiles of community samples (Fig. 6) show that the four profiles of the activated sludge samples taken from a municipal wastewater treatment plant (WTP_1 to WTP_4) clustered together, while the profiles of activated sludges fed by artificial wastewater (PHEN and ANI) and WTP_1 to WTP_4 were far apart.
FIG. 6.
Cluster analysis of profiles based on MPNs of community samples. The distance between profiles was measured as Euclidean distance, and the group average method was applied as the linkage strategy.
DISCUSSION
The community-level BIOLOG assay that directly inoculates environmental samples is an attractive method of differentiating community samples. However, the procedures in current use are still controversial and even conflict with each other. In addition, it has been pointed out that interpretation of the substrate utilization profiles obtained by the assays requires much care. We propose here a new approach to the community-level BIOLOG assay, which we call BIOLOG-MPN since we introduce the concept of MPN to the BIOLOG assay.
In most of the current procedures, the responses are detected based on color development (OD value) after a certain incubation period. The extent of color development for a certain substrate can be affected by three factors: initial density of the utilizers in the inoculum, growth rates of the utilizers in the well of the BIOLOG plates, and incubation period. These factors are related to each other, and we cannot separate the effects of the three factors on the resulting color development because we do not know a priori the initial densities of the utilizers in the sample or their growth rates. In contrast, in the case of the BIOLOG-MPN assay, the response to a substrate is more definable. When we focus on each substrate, the BIOLOG-MPN assay can be regarded as MPN enumeration using a sole carbon source on the BIOLOG plate. Therefore, the MPN is defined as the initial cell density of the utilizers that can grow sufficiently under the conditions of the assay procedure.
The results shown in Table 1 suggest that MPN estimation using BIOLOG plates works well when the utilizer of the substrate can grow at a sufficiently high rate for color development under the assay procedure. This is also supported by the results shown in Fig. 1, where the estimated MPNs clearly fell into two groups, MPNs of approximately 109 and MPNs less than 103. However, there are two types of substrates for which the MPNs were estimated to be less than 103, that is, some substrates had no color development even at the lowest DL and some had color development only at low DLs. As for the latter substrate type, it is thought that the populations in the samples can utilize the substrate but that the growth rates were not high enough under the conditions of the assay procedure. Although we think that a prolonged incubation period is preferable for accurate MPN enumeration, particularly for slow-growing utilizers, we arbitrarily used incubation periods of 1 or 2 weeks for practical reasons.
In the results for the model communities (Fig. 2), MPNs estimated for most of the substrates reflect the mixing ratios of the two strains. Although this suggests that the profile obtained by BIOLOG-MPN can quantitatively reflect the microbial community structure that contains strains at abundance levels of several orders of magnitude difference, some exceptions were observed, that is, the MPNs for substrates C4 (l-phenylalanine), A2 (β-methyl-d-glucoside), and H2 (dl-α-glycerol phosphate) in MIX_C were lower than those theoretically predicted based on the results found with pure cultures, and the value for substrate E4 (l-threonine) in MIX_A was higher than the theoretical prediction (Fig. 2). Although we cannot definitively show the reason for these observations at present, one possibility is that the discrepancies between predictions and observations were due to the low color development that was observed for these substrates. If a certain combination of strain and substrate shows low color development, particularly if it is near the threshold OD value for positive response, even a subtle variation in the color development would affect the detection of positive responses and the resulting MPN estimation.
Figure 5 shows that the relative positions of the profiles of MIX_A and MIX_C depended on the DL when the profiles were generated based on the color development at a certain period of incubation. This observation can be explained in terms of the composition of the model communities, that is, E. coli in MIX_C and P. aureofaciens in MIX_A are excluded from the inocula at DL = 7 or higher. Likewise, according to the results of cluster analyses of profiles of community samples using color development (data not shown), the shape of the dendrogram can be affected by the DL. These results suggest that profiles based on color development observed at a certain DL can be misleading, particularly in the case of environmental samples that contain populations with much different densities. In contrast, the profile obtained by the BIOLOG-MPN assay is independent of the DL and unique for the sample. In addition, the BIOLOG-MPN assay works well as a method for differentiating microbial community samples. According to the results of principal component analysis using pure cultures and model communities (Fig. 4), the relative positions of the profiles are consistent with the structures of the model communities. The shape of the dendrogram based on the result of the cluster analysis applied to the profiles of activated sludges also appropriately reflects the difference in the origins of the samples (Fig. 5).
The BIOLOG-MPN assay still has some limitations, some of which are related to the specifications of the BIOLOG system. In order to establish the BIOLOG-MPN assay as a MPN assay that uses multiple sole carbon sources that can be used on environmental community samples, we think that three improvements are necessary. First, the sensitivity for the detection of positive response should be improved. Although the current BIOLOG assay using a redox dye as an indicator for substrate utilization is convenient, the sensitivity for the detection of positive response seems insufficient for MPN enumeration. If the detection of substrate utilization were more sensitive, the MPN enumeration would be more accurate. Then, it would be expected that the discrepancy between observed and expected MPNs in the results using model communities (Fig. 2) would be reduced. Second, the incubation conditions in the wells of the BIOLOG plate should be customized for the target microbial community. In other words, the incubation conditions in the wells of the BIOLOG plate can cause a bias toward a certain group of microbial populations. For example, the substrate concentration in the well of the BIOLOG plate is considered to be much higher than that usually found in the environment. Other examples may be the salt content in the medium and the temperature during incubation. When a researcher interprets the results of the BIOLOG-MPN assay, these selection biases should be kept in mind. Third, ecologically relevant substrates should be selected in a BIOLOG plate. Campbell et al. (1) concluded that although the use of ecologically relevant substrates is beneficial, these substrates would be useful only if their use resulted in equal or better differentiation of samples. In the BIOLOG-MPN assay, if the dominant populations have a wide range of substrate utilization, they can mask the existence of rare populations. It is thought that a number of applications of the BIOLOG-MPN assay to environmental samples are necessary in order to determine the set of substrates appropriate for examining environmental samples.
Although the number and kind of examples tested in this study were limited and the BIOLOG-MPN assay also suffers from the limitations inherent to the BIOLOG assay, it can be concluded that the BIOLOG-MPN assay provides a definable and quantitative picture of the community structure of a sample. On the other hand, the disadvantage of the BIOLOG-MPN assay is that it requires much time and resources. We recommend that the current procedures be used to trace changes in a microbial community and that the BIOLOG-MPN assay be used for defining the community structure of concern. The combined use of current procedures and the BIOLOG-MPN assay will improve our understanding of the microbial community from the viewpoint of physiological substrate utilization.
ACKNOWLEDGMENTS
This work was supported by the Promotion System for Intellectual Infrastructure of Research and Development of Science and Technology Agency (STA) of Japan.
We gratefully acknowledge Gunze-Sangyo Inc. for technical advice on BIOLOG ECO plates and K. Morikawa for technical advice on direct counting with acridine orange. We also wish to give special thanks to A. Shinotsuka who helped us with the BIOLOG assay.
REFERENCES
- 1.Campbell C D, Grayston S J, Hirst D J. Use of rhizosphere carbon sources in sole carbon source tests to discriminate soil microbial communities. J Microbiol Methods. 1997;30:33–41. [Google Scholar]
- 2.Garland J L. Analysis and interpretation of community-level physiological profiles in microbial ecology. FEMS Microbiol Ecol. 1997;24:289–300. [Google Scholar]
- 3.Garland J L, Mills A L. Classification and characterization of heterotrophic microbial communities on the basis of patterns of community-level sole-carbon-source utilization. Appl Environ Microbiol. 1991;57:2351–2359. doi: 10.1128/aem.57.8.2351-2359.1991. [DOI] [PMC free article] [PubMed] [Google Scholar]
- 4.Guckert J B, Carr G J, Johnson T D, Hamm B G, Davidson D H, Kumagai Y. Community analysis by BIOLOG: curve integration for statistical analysis of activated sludge microbial habitats. J Microbiol Methods. 1997;27:183–197. [Google Scholar]
- 5.Haack S K, Garchow H, Klug M J, Forny L J. Analysis of factors affecting the accuracy, reproducibility, and interpretation of microbial community carbon source utilization patterns. Appl Environ Microbiol. 1995;61:1458–1468. doi: 10.1128/aem.61.4.1458-1468.1995. [DOI] [PMC free article] [PubMed] [Google Scholar]
- 6.Heuer H, Smalla K. Evaluation of community-level catabolic profiling using BIOLOG GN microplates to study microbial community changes in potato phyllosphere. J Microbiol Methods. 1997;30:49–61. [Google Scholar]
- 7.Hobbie J E, Daley R J, Jasper S. Use of Nuclepore filters for counting bacteria by fluorescence microscopy. Appl Environ Microbiol. 1977;33:1225–1228. doi: 10.1128/aem.33.5.1225-1228.1977. [DOI] [PMC free article] [PubMed] [Google Scholar]
- 8.Konopka A, Oliver L, Turco R F., Jr The use of carbon substrate utilization patterns in environmental and ecological microbiology. Microb Ecol. 1998;35:103–115. doi: 10.1007/s002489900065. [DOI] [PubMed] [Google Scholar]
- 9.Laine M M, Haario H, Jørgensen K S. Microbial functional activity during composting of chlorophenol-contaminated sawmill soil. J Microbiol Methods. 1997;30:21–32. [Google Scholar]
- 10.Smalla K, Wachtendorf U, Heuer H, Liu W, Forney L. Analysis of BIOLOG GN substrate utilization patterns by microbial communities. Appl Environ Microbiol. 1998;64:1220–1225. doi: 10.1128/aem.64.4.1220-1225.1998. [DOI] [PMC free article] [PubMed] [Google Scholar]
- 11.Verschuere L, Fievez V, Van Vooren L, Verstraete W. The contribution of individual populations to the BIOLOG pattern of model microbial communities. FEMS Microbiol Ecol. 1997;24:353–362. [Google Scholar]
- 12.Wünsche L, Brüggemann L, Babel W. Determination of substrate utilization patterns of soil microbial communities: an approach to assess population changes after hydrocarbon pollution. FEMS Microbiol Ecol. 1995;17:295–306. [Google Scholar]


