

Abstract
Background and Aims
Epidemiologic studies show a strong association between chronic inflammation and type 2 diabetes (T2D). Diet may also affect the risk of T2D by modulating inflammation. This meta-analysis aimed to assess the relation of dietary inflammatory index (DII) and risk of T2D.
Methods
PubMed and Scopus were systematically searched from their inception to September 2020 to identify relevant studies. Relative risks, hazard ratios, or odds ratios (OR), with their corresponding 95% confidence intervals (95% CI), were calculated and pooled using a random-effects model.
Results
A total of 48 different studies, with a total sample size of 1,687,424 participants, were eligible to be included in this meta-analysis. In the overall analysis, no significant association was observed between DII and risk of T2D (OR = 1.03, 95% CI: 0.91 to 1.15), with significant evidence for heterogeneity (I2 = 96.5%, P < 0.001); however, higher DII was identified as being significantly related to increased risk of T2D in high quality studies (OR = 1.58, 95% CI: 1.15 to 2.17). In the stratified analysis by the dietary assessment tool, background disease, and sex of participants, DII showed no significant association with T2D.
Conclusions
Higher DII might be associated with an increased risk of T2D. Additional well-designed studies are required to confirm this finding.
1. Introduction
Diabetes is one of the fastest-growing health issues that has reached an alarming level in many societies today [1, 2]. In the last 20 years, the number of adults diagnosed with diabetes almost tripled, from 151 million to over 463 million, and this number is projected to reach 700 million by 2045 [3]. Globally, 4.3 million deaths and USD 760 billion direct health expenditure have been attributed to diabetes in 2019 [3]. Type 2 diabetes (T2D) is contributing to 90–95% of all diabetes cases [3] and is a potential risk factor for cardiovascular disease [4], so it is critical to find a low-cost strategy that can help in its early prevention. The role of the immune system in development of T2D has gained interest in recent years such that a growing number of studies have highlighted the involvement of inflammatory biomarkers in the pathogenesis of T2D [5, 6]. Studies have shown that adiposity, insulin resistance, and hyperglycemia can induce systemic inflammation through stimulating the production of proinflammatory proteins such as C-reactive protein and cytokines including interleukin-1β (IL-1β), interleukin-6 (IL-6), and tumor necrosis factor-α (TNF-α) [7]. Additionally, environmental and behavioral factors can augment systemic inflammation in the time of stress [8].
Diet is one of the key modifiable factors which may modulate the systemic inflammation [9]. That is, diet may influence metabolic heath through dietary factors that exhibit anti- or proinflammatory properties [10]. For instance, dietary flavonoid intake has been inversely associated with inflammation [11], whereas saturated fatty acids have shown a positive association [12]. However, studying whole dietary patterns/indices may be better in evaluating the inflammatory effect of diet because such patterns/indices can capture the interaction of multiple nutrients or foods to reflect the complexity of a diet [13]. Dietary diversity index, also known as potential inflammatory of diet, is a literature-derived, population-based dietary index developed by Shivappa et al. [14]. DII includes 45 food parameters (foods, macro- and micronutrients) that are classified into three categories based on their impact on key inflammatory biomarkers: anti-inflammatory, proinflammatory, and inflammatory neutral [14]. Review studies assessing DII in relation to metabolic outcomes have revealed a positive link between DII and obesity [15], metabolic syndrome [16], and cardiovascular diseases [17].
However, to date, there is no meta-analysis assessing diabetes outcomes of DII although two meta-analyses have assessed the association of DII with markers of glucose homeostasis that precede diabetes [18, 19]. These meta-analyses showed that higher DII scores were significantly associated with hyperglycemia, hyperinsulinemia, and insulin resistance measured by HOMA-IR [18, 19]. However, the results were based on a small number of studies (n = 3–13) and had high between-study heterogeneity, and the authors omitted important free-text thesaurus terms such as “dietary inflammatory pattern” [18, 19]. Determining the association of DII with T2D may facilitate its use for intervention and provide a basis for assessment of T2D risk at population level. Therefore, given that the association of DII with T2D still remains unclear and controversial in the literature, this meta-analysis aimed to systematically examine and quantify the association of DII with the risk of T2D.
2. Methods
The common approach used for this study was reported according to the Preferred Reporting Items for Systematic Reviews and Meta-Analyses (PRISMA) statement [20].
2.1. Search Strategy and Selection
A systematic search of peer-reviewed literature in Medline/PubMed was supplemented by hand searching references of eligible studies and relevant reviews. We used broad free-text thesaurus terms and Medical Subject Headings for “dietary inflammatory index” and “type 2 diabetes” to set the search syntax as follows: (((((“dietary inflammatory index” [Title/Abstract]) OR (“inflammatory diet” [Title/Abstract])) OR (“anti-inflammatory diet” [Title/Abstract])) OR (“inflammatory potential of the diet” [Title/Abstract])) OR (“proinflammatory diet” [Title/Abstract])) AND ((((((“diabetes mellitus” [MeSH]) OR (diabetes)) OR (“type 2 diabetes mellitus”)) OR (T2DM)) OR (“non-insulin-dependent diabetes mellitus”)) OR (“diabetes mellitus”)). No limitation was placed on date, and all studies from Medline inception to January 2021 were imported to an EndNote library for screening. Search was conducted by SA.
2.2. Inclusion Criteria
This review included eligible observation studies (longitudinal, cross-sectional, and case-control) examining potential inflammatory of diet (exposure) as a function of T2D (outcome) and reported relative risks (RR), hazard ratios (HR), or odds ratios (OR) or provided sufficient data to calculate them; when data were not reported in the studies, we contacted the corresponding author to obtain data. Criteria for exclusion included the following: clinical trials, editorials, books, dissertation, and other grey literature. Data were extracted independently by two reviewers, and disagreements were resolved by discussion.
2.3. Screening
All the records were imported to an EndNote library for enhancing the screening process. AM and HM screened titles and abstracts for potential eligibility and removed records based on predefined criteria. In studies with T2D as the secondary outcome, it was difficult to determine eligibility based on title/abstract, so full text of 80% of studies were retrieved for further inspection. Retrieved papers were read in full and all references followed up.
2.4. Data Extraction and Quality Assessment
An evidence table with a priori determined headings was used for data extraction of eligible studies as follows: the first author's name, geographical setting and population, year of publication, sex and mean age of participants, sample size, DII scoring system(s) and assessment tool(s), T2D assessment tool, DII comparison cut-points, documented effect sizes, and covariates adjusted, if available. Data were extracted independently by two reviewers, and in case of disagreement, a third reviewer was involved.
Two reviewers (SA and HM) separately filled out Newcastle–Ottawa Scale (NOS), one of the best tools for quality appraisal of observational studies, for included studies. Cross-sectional and case-control studies were assigned a maximum of 10 asterisks for the three domains of selection (0–4), comparability (0–2), and assessment of exposure (0–3). Each cohort study was also given a maximum of 10 asterisks for parameters in the three domains of selection (0–5), comparability (0–2), and assessment of outcome (0–3). Final quality scores were determined based on the number of criteria received “∗”: 7–9 (high quality); 4–6 (medium quality); 1–3 (low quality).
2.5. Data Synthesis and Analysis
Studies reporting the association of DII with T2D using odds ratios, hazard ratios, or relative risks were considered as eligible for qualitative synthesis. However, for quantitative synthesis, log-transformed risk ratios as well as corresponding standard errors (SEs) were obtained from ORs, RRs, or HRs extracted from models that were adjusted for the highest number of covariates. If the study did not report these three risk ratios directly, we used the raw data (total sample size and cases) provided by the study to estimate the unadjusted ORs. Due to great variety in the included studies, particularly in terms of DII scoring system, a random-effects model was used for pooling risk estimates on a forest plot regardless of the presence or absence of heterogeneity (I2 values). I2 > 50% together with P < 0.10 was used to determine statistically significant heterogeneity. Subgroup analyses using random-effects models investigated potential sources of variation that were due to reasons other than chance. Potential sources examined were quality of studies, dietary assessment tool, and sex of participants. The possibility of publication bias was assessed by conducting Egger's test (P value set at 0.05) and constructing funnel plots for visual inspection. Metaregression analysis was conducted to assess if pooled estimates were affected by age of participants. Sensitivity analysis was conducted to assess the robustness of the synthesized results. All analyses were done using Stata, version 13 (StataCorp, College Station, TX). Pooled estimates' significance was set at P < 0.05.
3. Results
The preliminary search through databases yielded a total of 421 publications. After excluding duplicate (n = 55) and irrelevant publications (n = 310) based on title and abstract, 56 articles underwent full-text screening. Among them, 8 further studies were excluded since they were reviews, had irrelevant exposure or outcome, or reported results according to the linear regression analysis (beta coefficient), and thus their risk estimates were not calculable [21, 22]. Eventually, the present meta-analysis included a total of 48 different studies with 55 data sets [23–70] including a total sample size of 1,687,424 participants. For some studies, different effect sizes had been reported in their stratified analyses; we extracted all effect sizes for such studies. The flow chart of the study showing the process of screening is presented in Figure 1. Studies were published during 2013 to 2020, and the sample size of the included publications varied between 22 and 533256 subjects. Among the included studies, there were 8 high quality studies reporting the adjusted risk estimate for T2D associated with DII as the primary outcome [32, 33, 39, 50–52, 59, 63], while for other studies [23–31, 34–38, 40–49, 53–58, 60–62, 64–70], T2D was a secondary outcome and the crude odds ratio for T2D was calculated based on the frequency of subjects with T2D in the highest category of DII, compared with subjects in the lowest category. DII was calculated with the use of 7-day dietary record in 3 studies [31, 44, 50], 24-hour dietary recall in 11 studies [35, 37, 46, 51, 54, 55, 62–64, 68, 70], dietary history questionnaire in 2 studies [45, 52], and food frequency questionnaire (FFQ) in the remaining studies. Moreover, data for men was reported in 7 studies [28, 36, 44, 50, 53, 54, 64] and for women was reported in 10 studies [24, 28, 34, 36, 38, 49, 52, 54, 64, 67], and other studies reported results for a combination of both sexes. The quality of the included publications was considered as high in 8 studies [32, 33, 39, 50–52, 59, 63] and low in 40 studies [23–31, 34–38, 40–49, 53–58, 60–62, 64–70]. Table 1 represents other characteristics of the analyzed studies.
Figure 1.
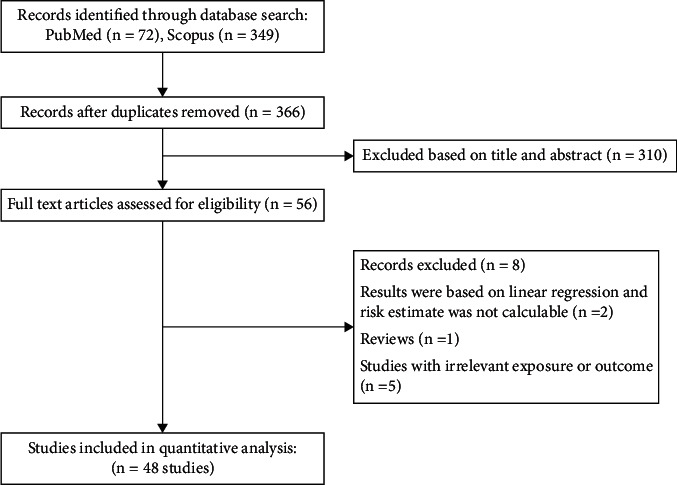
Flow chart of study.
Table 1.
Characteristics of studies.
| Population | |||||||||
|---|---|---|---|---|---|---|---|---|---|
| Reference | Year | Study design | Location | No. of participants | Sex | Age (range or mean ± SD) | Exposure assessment | Outcome assessment | Diabetes was the primary outcome, and analyses were adjusted for potential confounders |
| Woudenbergh et al. | 2013 | Cross-sectional | Netherlands | 1024 | M/F | 64 ± 9 | FFQ | FPG-2-h, -HbA1c | No |
| Shivappa et al. | 2014 | Cross-sectional | USA | 34703 | F | 61.58 ± 4.2 | FFQ | Self-report | No |
| Alkerwi et al. | 2015 | Cross-sectional | Luxembourg | 1352 | M/F | 44.25 ± 0.8 | FFQ | Medication use | No |
| Garcia-Arellano et al. | 2015 | Cross-sectional | Spain | 7216 | M/F | 67 ± 6 | FFQ | Medical record | No |
| Ramallal et al. | 2015 | Cross-sectional | Spain | 18794 | M/F | 38 ± 12 | FFQ | Medical record | No |
| Sánchez-Villegas et al. | 2015 | Cross-sectional | Spain | 15093 | M/F | 38.28 | FFQ | Medical record | No |
| Ruiz-Canela et al. | 2015 | Cross-sectional | Spain | 4145 | F | 68 ± 6 | FFQ | Medical record | No |
| Ruiz-Canela et al. | 2015 | Cross-sectional | Spain | 3091 | M | 66 ± 7 | FFQ | Medical record | No |
| Shivappa et al. | 2015 | Case-control | Italy | 978 | M/F | 62.5 | FFQ | Medical record | No |
| Xu et al. | 2015 | Cross-sectional | Sweden | 1942 | M/F | 70.6 ± 0.6 | 7-day dietary record | FPG ≥ 126 mg/dL, 2 h glucose ≥ 200 mg/dL, hypoglycemic agents or insulin use | No |
| Antwi et al. | 2016 | Case-control | USA | 2573 | M/F | 66.7 ± 10.3 | FFQ | Medical records | Yes |
| Moslehi et al. | 2016 | Cross-sectional | Iran | 2975 | M/F | 45 ± 11.7 | FFQ | FPG ≥ 126 mg/dL, 2 h glucose ≥ 200 mg/dL, use of antidiabetic medication | Yes |
| Vissers et al. | 2016 | Cross-sectional | Australia | 6972 | F | 52 ± 1 | FFQ | Doctor-diagnosed | No |
| Bergmans et al. | 2017 | Cross-sectional | USA | 11592 | M/F | 20-80 | 24-hour diet recall | Self-reported history | No |
| Bodén et al. | 2017 | Case-control | Sweden | 5284 | M | 53.85 ± 7.36 | FFQ | Self-report+FPG ≥ 7.0 mmol/L or 2 h glucose ≥ 11.1 mmol/L | No |
| Bodén et al. | 2017 | Case-control | Sweden | 1660 | F | 54.47 ± 8.28 | FFQ | Self-report+FPG ≥ 7.0 mmol/L or 2 h glucose ≥ 11.1 mmol/L | No |
| Phillips et al. | 2017 | Cross-sectional | Ireland | 2047 | M/F | 59.7 ± 0.17 | FFQ | FPG ≥ 7 mmol/L or doctor-diagnosed diabetes | No |
| Shivappa et al. 1 | 2017 | Cross-sectional | Germany | 1297 | M | 54.5 ± 5.8 | 7-day dietary record | Self-report | No |
| Shivappa et al. 2 | 2017 | Cross-sectional | USA | 12366 | M/F | 47.4 ± 19.1 | 24-hour diet recall | Self-report | No |
| Vissers et al. | 2017 | Cross-sectional | Australia | 7169 | F | 52 ± 1 | FFQ | Doctor-diagnosed | No |
| Denova-Gutiérrez et al. | 2018 | Cross-sectional | Mexico | 1174 | M/F | 39.9 ± 0.48 | FFQ | FPG ≥ 126 mg/dL and HbA1c> 6.5% | Yes |
| Farhangi et al. | 2018 | Cross-sectional | Iran | 454 | M/F | 59.02 ± 9.07 | FFQ | - | No |
| Hodge et al. | 2018 | Cross-sectional | Australia | 39532 | M/F | 55.3 ± 8.5 | FFQ | Structured interview | No |
| Mazidi et al. | 2018 | Cross-sectional | USA | 21 649 | M/F | 47.3 ± 0.25 | 24-hour diet recall | Questionnaire | No |
| McMahon et al. | 2018 | Cross-sectional | USA | 40161 | M | 45-69 | FFQ | Questionnaire and medical record | No |
| Rouhani et al. | 2018 | Cross-sectional | Iran | 221 | M/F | 56.57 ± 15.32 | FFQ | Self-report | No |
| Tomata et al. | 2018 | Cross-sectional | Japan | 793 | M/F | 75.2 ± 4.5 | Dietary history questionnaire | Self-report | No |
| Shivappa et al. | 2018 | Cross-sectional | Italy | 20823 | M/F | 55.32 ± 11.6 | FFQ | FPG ≥ 126 mg/dL, medication use | No |
| Wirth | 2018 | Cross-sectional | USA | 26046 | M/F | 46.1 ± 0.29 | 24-hour diet recall | Self-report | No |
| Zheng et al. | 2018 | Cross-sectional | USA | 101449 | M/F | 65.52 ± 0.04 | FFQ | Medical history | No |
| Abdulahi et al. | 2019 | Cross-sectional | Iran | 300 | M/F | 42.9 ± 10.9 | FFQ | FPG ≥ 126 mg/dL | Yes |
| Guinter et al. | 2019 | Cohort | USA | 6016 | M | 48.2 ± 10.02 | 3-day diet record | Self-report of medication use, self-reports by their personal physician | Yes |
| King et al. | 2019 | Cross-sectional | USA | 4434 | M/F | 49.4 | 24-hour diet recall | HbA1c (%)> 6.5, self-report | Yes |
| Laouali et al. | 2019 | Cohort | France | 70991 | F | 53 ± 6.7 | Dietary history questionnaire | FPG ≥ 7.0 mmol/L or random glucose ≥11.1 mmol/L at diagnosis, use of a glucose-lowering medication, or HbA1c level ≥53 mmol/mol (7.0%) | Yes |
| Agraib et al. | 2019 | Case-control | Jordan | 388 | M/F | 51.85 ± 10.2 | FFQ | Interview-based standardized questionnaire | No |
| Asadi et al. | 2019 | Cross-sectional | Iran | 4672 | M/F | 49.25 ± 7.85 | FFQ | - | No |
| Bondonno et al. | 2019 | Cross-sectional | Australia | 1422 | F | 75.2 ± 2.7 | FFQ | Medical history | No |
| Morimoto et al. | 2019 | Cross-sectional | Brazil | 684 | M | 59.7 ± 13.5 | 24-hour diet recall | Medical history | No |
| Morimoto et al. | 2019 | Cross-sectional | Brazil | 1585 | F | 59.7 ± 13.5 | 24-hour diet recall | Medical history | No |
| Mark Park et al. | 2019 | Cross-sectional | USA | 1815 | M/F | 41 | 24-hour diet recall | FPG ≥ 100 mg/dL or antidiabetic medication use, HOMA-IR ≥ 90th | No |
| Mark Park et al. | 2019 | Cross-sectional | USA | 1918 | M/F | 48.7 | 24-hour diet recall | FPG ≥ 100 mg/dL or antidiabetic medication use, HOMA-IR ≥ 90th | No |
| Tyrovolas et al. | 2019 | Cross-sectional | Greece | 3042 | M/F | 45 ± 14 | FFQ | Self-report | No |
| Veronese et al. | 2019 | Cross-sectional | Italy | 1565 | M/F | 65.5 ± 8.9 | FFQ | Self-report | No |
| Zheng et al. | 2019 | Cross-sectional | USA | 533256 | M/F | 61.68 ± 0.02 | FFQ | Self-report | No |
| Hoon Lee et al. | 2020 | Cross-sectional | USA | 19666 | M/F | 52.7 ± 9.6 | FFQ | Self-report | Yes |
| Asadi et al. | 2020 | Cross-sectional | Iran | 4365 | M/F | 49.14 ± 7.88 | FFQ | - | No |
| Herrou et al. | 2020 | Cross-sectional | France | 15096 | M/F | 60.5 ± 5.88 | 24-hour diet recall | Medical record | No |
| Lee et al. | 2020 | Cross-sectional | Korea | 1712 | M | 52.14 ± 0.2 | 24-hour diet recall | - | No |
| Lee et al. | 2020 | Cross-sectional | Korea | 2473 | F | 52.87 ± 0.2 | 24-hour diet recall | - | No |
| Li et al. | 2020 | Cross-sectional | USA | 210145 | M/F | 46.9 ± 9.2 | FFQ | Self-report | No |
| Li et al. | 2020 | Cross-sectional | USA | 210145 | M/F | 46.9 ± 9.2 | FFQ | Self-report | No |
| Li et al. | 2020 | Cross-sectional | USA | 210145 | M/F | 46.9 ± 9.2 | FFQ | Self-report | No |
| Wang et al. | 2020 | Cross-sectional | USA | 6893 | M/F | 69.66 ± 0.3 | 24-hour diet recall | FPG ≥ 126 mg/dL, 2 h glucose ≥200 mg/dL, self-report, insulin use | No |
| Wang et al. | 2020 | Cross-sectional | China | 1064 | F | 65 ± 0.5 | FFQ | Medical history | No |
| Zabetian-Targhi et al. | 2020 | Cross-sectional | Australia | 706 | M/F | 67.7 ± 6.9 | FFQ | RPG ≥ 199.8 mg/dL, FPG ≥ 126 mg/dL, 2 h glucose ≥199.8 mg/dL | No |
M: male; F: female; FFQ: food frequency questionnaire; FPG: fasting plasma glucose; RPG: random plasma glucose; HbA1c: hemoglobin A1c; HOMA-IR: homeostatic model assessment for insulin resistance
3.1. Quantitative Synthesis of Data
The results for the overall and subgroup analysis are shown in Table 2. In the overall analysis, when all eligible publications were pooled, no significant association was found between DII and risk of T2D (OR = 1.03, 95% CI: 0.91 to 1.15), with significant evidence for heterogeneity (I2 = 96.5%, P < 0.001); however, higher DII was identified as being significantly related to a 58% increased risk of T2D in high quality studies (OR = 1.58, 95% CI: 1.15 to 2.17) (Figure 2). No significant relationship was observed between DII and risk of T2D in the subgroup analysis based on the dietary assessment tool and sex of participants (Table 2).
Table 2.
Subgroup analysis for the association between dietary inflammatory index and type 2 diabetes.
| Subgroup by | Effect sizes∗ (n) | I 2 (%) | P heterogeneity | OR (95% CI) |
|---|---|---|---|---|
| All studies | 55 | 96.5 | ≤0.001 | 1.03 (0.91–1.15) |
| Study quality | ||||
| High quality | 8 | 96.8 | ≤0.001 | 1.58 (1.15–2.17) |
| Low quality | 47 | 96.4 | ≤0.001 | 0.95 (0.84–1.08) |
| Sex | ||||
| Male | 7 | 51.3 | 0.05 | 1.01 (0.85–1.19) |
| Female | 10 | 72.1 | ≤0.001 | 0.88 (0.75–1.03) |
| Both | 38 | 97.3 | ≤0.001 | 1.07 (0.92–1.24) |
| Dietary assessment | ||||
| 24-hour recall | 13 | 94.4 | ≤0.001 | 1.05 (0.84–1.31) |
| 7-day dietary record | 3 | 87.5 | ≤0.001 | 0.74 (0.36–1.52) |
| Food frequency questionnaire | 37 | 97.0 | ≤0.001 | 1.04 (0.89–1.21) |
| Dilatory history questionnaire | 2 | 0.0 | 0.064 | 1.00 (0.89–1.11) |
∗ There was more than 1 effect size for some studies.
Figure 2.
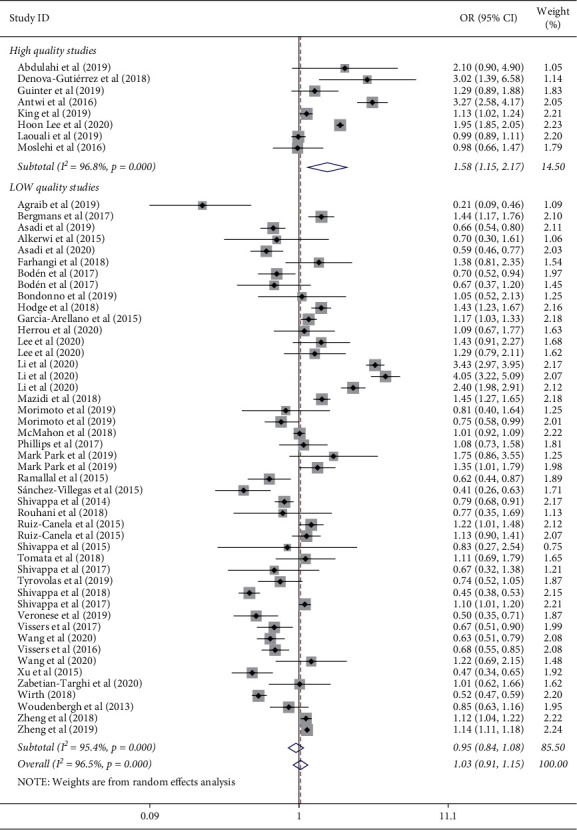
Meta-analysis for the association of dietary inflammatory index and risk of type 2 diabetes stratified by the quality of studies.
3.2. Metaregression and Publication Bias
In the metaregression analysis, age of participants did not affect the relation of DII to T2D (t = 0.62, P = 0.54) (Figure 3). Furthermore, no evidence of publication bias was found based on the Egger test (t = - 1.42, P = 0.16) (Figure 4).
Figure 3.
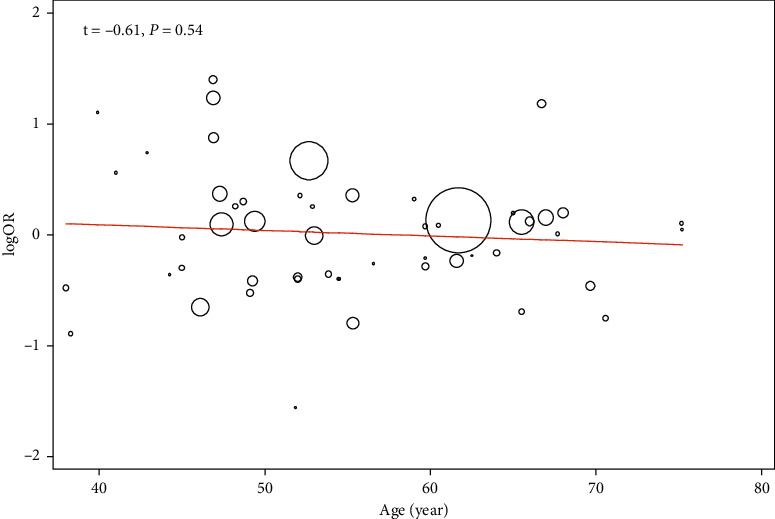
Metaregression analysis for the effect of age on the relation of dietary inflammatory index to risk of type 2 diabetes.
Figure 4.
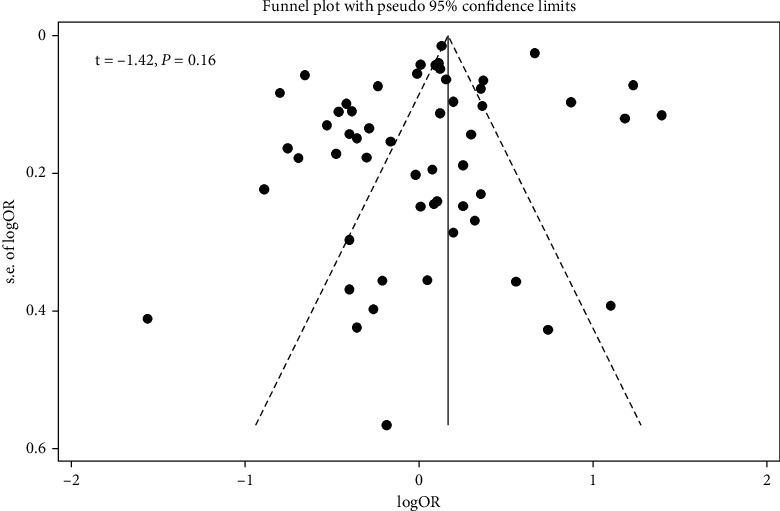
Funnel plot for publication bias.
3.3. Sensitivity Analysis
Sensitivity analysis by omitting one study at a time did not significantly change the results, showing the reliability of the findings (Figure 5).
Figure 5.
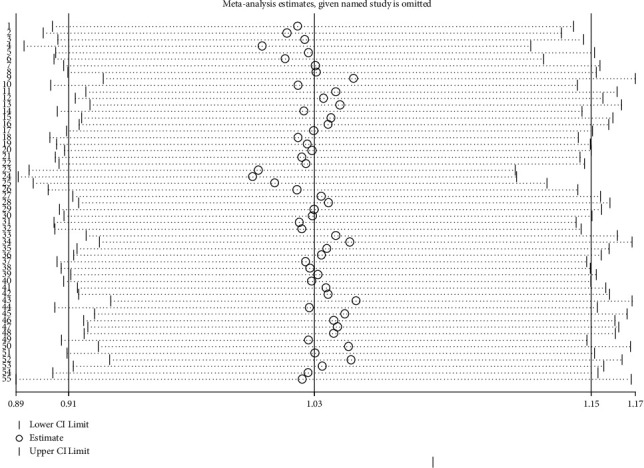
Sensitivity analysis by omitting one study at a time and reanalyzing other studies.
4. Discussion
Studies exploring the relation of DII to the risk of T2M have yielded inconclusive findings. This meta-analysis aimed to resolve these inconsistencies by pooling the available observational studies. The pooled effect size of high quality studies showed that higher DII is significantly related to the increased risk of T2D, although this finding was not supported in the stratified analyses by dietary assessment tool and sex of participants.
Long time exposure to low-grade inflammation could result in an elevation in the risk of obesity and its-related metabolic complications such as T2D [71]. The relation of systemic inflammatory markers to T2D has been well established. Diet is also suggested as a main contributor to the balance that affects the overall inflammatory response at various sites in chronic conditions. Investigations have identified a positive association between unhealthy Western dietary patterns—featured mainly by lower consumption of fish, fruits, vegetables, fiber, and whole grains and higher intake of red and processed meat, sugar, solid fat, and fast foods—and inflammation [72] as well as T2M [73, 74]. Moreover, multiple prospective cohort studies have shown a negative relationship between the adherence to Mediterranean diet (with anti-inflammatory effects) [75] and the risk of T2M [76]. In this meta-analysis, we found a direct relationship between inflammatory potential of a diet, assessed by DII, and risk of T2D. DII is closely correlated to circulating inflammatory biomarkers [77], a potential pathway involved in the T2D pathogenesis [78]. The result in our analysis is supported by previous studies examining the association between DII and T2M; in the study by Denova-Gutiérrez et al. [39] on 1174 Mexican adults, after controlling potential confounding factors including body mass index (BMI), it was revealed that people with the highest score for the DII had a 3-fold increased risk of T2D, compared with individuals with the lowest scores of DII. Similarly, a recent study [79] found that individuals adhering to a proinflammatory diet had a 18-fold higher odds of prediabetes, compared to those consuming an anti-inflammatory diet. In the cross-sectional analysis of 4434 adults with age ≥20 years in the National Health and Nutrition Examination Survey [51], the mean DII scores in people with T2D and with hemoglobin A1c (HbA1c) > 6.5% were significantly higher than those without T2D and those with HbA1c <6.5%, proposing that DII is a significant predictor of diabetes and its severity, so that with 1 point increase in the DII score, odds of having diabetes and HbA1c higher than 9% increased by 13% and 43%, respectively. Moreover, HbA1c was significantly related to an increased CRP [51]. More recent studies have yielded additional support for our finding; DII is reported to be directly related to all markers of T2D risk, including fasting insulin, fasting glucose HbA1c, homeostasis model assessment index for insulin resistance (HOMA2-IR), and two-hour glucose levels [21]. The anti-inflammatory dietary pattern was also negatively associated with CRP and lower odds of T2D in a recent study in the National Diet and Nutrition Survey on a total of 1531 British adults [80]. Such findings support the results of the present meta-analysis that diet-induced inflammation increased the odds of T2D. Nevertheless, the cross-sectional study from the Tehran Lipid and Glucose Study including 2975 Iranian adults [33] found no significant relationship between DII and impaired fasting glucose, insulin resistance, and T2D, while DII had a positive weak relation only to 2-hour plasma glucose (2h-PG). These discrepancies might be derived from differences in study design, background disease, types and number of dietary components applied to compute the DII, level of adjustments for covariates, and most importantly quality of studies. It should be considered that the null association of DII with T2D in the overall and subgroup analysis is due to the high number of low quality studies in the overall and subgroup analysis, in which T2D was not a primary outcome.
The precise mechanism by which diet-related inflammation might elevate the odds of T2D is not well known although it is well established that T2D is fostered in a proinflammatory setting [71]. A proinflammatory diet might contribute to the risk of T2D by elevating circulating levels of inflammatory cytokines (e.g., interferon γ, IL-1, IL-6, IL-8, CRP, and TNF-α), which can lead to insulin resistance [6, 77]. It has been suggested that some nutrients and foods could have immunomodulatory impacts and reduce inflammation, thereby improving insulin resistance and beta cell function [81]. In this sense, most of the frequently used food items in the proinflammatory diet (trans-fatty acids, saturated fatty acids, red and processed meat, and energy intake) have been linked to inflammatory markers [82–84] and T2M [85, 86]. However, low consumption of n-3 fatty acids, vegetables, dietary fiber, and fruits in a diet with low DII score has been linked to elevated risk of T2D [87, 88], possibly mediated by an increase in inflammatory markers [89]. In addition, some studies [21, 52], but not all [39], have revealed that the relation of DII to T2D is partly mediated by BMI so that a diet with high inflammatory potential could increase BMI, which is one of the strongest risk factors for T2D. Furthermore, an anti-inflammatory diet has been shown to be inversely related to glycemic index (GI) score [90]; on the other hand, a diet with low GI leads to weight loss, along with a reduction [91] in proinflammatory mediators [92] and improvement in insulin sensitivity [93], justifying the link of high DII diets to T2D.
The present study is the first meta-analysis to comprehensively investigate the relation of DII to T2D. The results have significant clinical implications as targeting the DII components could be a useful strategy to decrease the risk of T2D. As a strength point, there was no significant evidence for publication bias. However, some limitations of our meta-analysis should be considered. First, T2D was a secondary outcome in the majority of the included studies, and we calculated crude effect size for such studies, which may increase their susceptibility to bias. Nevertheless, to resolve this issue, we performed subgroup analysis based on the study quality to obtain a more reliable conclusion. Second, a significant heterogeneity was detected across the publications; despite that, we applied random-effects analysis to consider the observed heterogeneity. This heterogeneity can be derived from differences in genetic background, background disease, level of adjustment for covariates, sample size, and quality of studies. Subgroup analysis found that dietary questionnaire used to calculate DII was a potential source of heterogeneity, showing that differences in dietary assessment tool among previous publications may partly justify the detected heterogeneity. Third, the analyzed publications were observational in design, which are subject to selection bias, and causality could not be inferred. Finally, number and type of food components applied for the computation of the DII varied across studies, and standardizing the intake of each food components according to world mean and standard deviation (SD) complicates the comparability of DII across different populations, which may be a source of inconsistent findings in the prior studies.
In conclusion, this meta-analysis indicated that adherence to a proinflammatory diet may increase the risk of T2D. Thus, the recommendation of a healthy dietary pattern may decrease diet-induced inflammation and subsequently lower the risk of T2D. Additional studies are required to identify whether a diet that particularly targets the DII components could be useful clinically to decrease the development of T2D.
Data Availability
All data and codes are available by contacting the corresponding author.
Conflicts of Interest
The authors declare no conflicts of interest.
Authors' Contributions
AM, MA, HM, RH, MLG, AN, and MFN participated in the study design and in writing the manuscript. SA, AN, and AM participated in the data collection. SA and NG analyzed the data. AM and NG interpreted the data and critically reviewed the paper under the supervision of SA. All authors read and approved the final manuscript.
References
- 1.Mortazavi-Jahromi S. S., Alizadeh S., Javanbakht M. H., Mirshafiey A. Anti-diabetic effect of β-D-mannuronic acid (M2000) as a novel NSAID with immunosuppressive property on insulin production, blood glucose, and inflammatory markers in the experimental diabetes model. Archives of Physiology and Biochemistry . 2019;125(5):435–440. doi: 10.1080/13813455.2018.1481094. [DOI] [PubMed] [Google Scholar]
- 2.Emami M. R., Khorshidi M., Zarezadeh M., Safabakhsh M., Rezagholizadeh F., Alizadeh S. Acute effects of caffeine ingestion on glycemic indices: a systematic review and meta-analysis of clinical trials. Complementary Therapies in Medicine . 2019;44:282–290. doi: 10.1016/j.ctim.2019.05.003. [DOI] [PubMed] [Google Scholar]
- 3.Saeedi P., Petersohn I., Salpea P., et al. Global and regional diabetes prevalence estimates for 2019 and projections for 2030 and 2045: results from the international diabetes federation diabetes atlas, 9th edition. Diabetes Research and Clinical Practice . 2019;157 doi: 10.1016/j.diabres.2019.107843.107843 [DOI] [PubMed] [Google Scholar]
- 4.Mortazavi-Jahromi S. S., Alizadeh S., Javanbakht M. H., Mirshafiey A. Cardioprotective effect of β-d-mannuronic acid (M2000) as a novel NSAID on gene expression of oxLDL scavenger receptors in the experimental diabetic model. Immunopharmacology and Immunotoxicology . 2018;40(4):284–289. doi: 10.1080/08923973.2018.1455209. [DOI] [PubMed] [Google Scholar]
- 5.Hu F. B., Meigs J. B., Li T. Y., Rifai N., Manson J. E. Inflammatory markers and risk of developing type 2 diabetes in women. Diabetes . 2004;53(3):693–700. doi: 10.2337/diabetes.53.3.693. [DOI] [PubMed] [Google Scholar]
- 6.Shoelson S. E., Lee J., Goldfine A. B. Inflammation and insulin resistance. Journal of Clinical Investigation . 2006;116(7):1793–1801. doi: 10.1172/jci29069. [DOI] [PMC free article] [PubMed] [Google Scholar]
- 7.Duncan B. B., Schmidt M. I., Pankow J. S., et al. Low-grade systemic inflammation and the development of type 2 diabetes. Diabetes . 2003;52(7):1799–1805. doi: 10.2337/diabetes.52.7.1799. [DOI] [PubMed] [Google Scholar]
- 8.Kang D.-H., Rice M., Park N.-J., Turner-Henson A., Downs C. Stress and inflammation: a biobehavioral approach for nursing research. Western Journal of Nursing Research . 2010;32(6):730–760. doi: 10.1177/0193945909356556. [DOI] [PubMed] [Google Scholar]
- 9.Mohseni R., Abbasi S., Mohseni F., Rahimi F., Alizadeh S. Association between dietary inflammatory index and the risk of prostate cancer: a meta-analysis. Nutrition and Cancer . 2019;71(3):359–366. doi: 10.1080/01635581.2018.1516787. [DOI] [PubMed] [Google Scholar]
- 10.Minihane A. M., Vinoy S., Russell W. R., et al. Low-grade inflammation, diet composition and health: current research evidence and its translation. British Journal of Nutrition . 2015;114(7):999–1012. doi: 10.1017/s0007114515002093. [DOI] [PMC free article] [PubMed] [Google Scholar]
- 11.Chun O. K., Chung S.-J., Claycombe K. J., Song W. O. Serum C-reactive protein concentrations are inversely associated with dietary flavonoid intake in U.S. Adults. Journal of Nutrition . 2008;138(4):753–760. doi: 10.1093/jn/138.4.753. [DOI] [PubMed] [Google Scholar]
- 12.Calder P. C. Long chain fatty acids and gene expression in inflammation and immunity. Current Opinion in Clinical Nutrition and Metabolic Care . 2013;16(4):425–433. doi: 10.1097/mco.0b013e3283620616. [DOI] [PubMed] [Google Scholar]
- 13.Maddahi N., Yarizadeh H., Aghamir S. M. K., Alizadeh S., Yekaninejad M. S., Mirzaei K. The association of dietary inflammatory index with urinary risk factors of kidney stones formation in men with nephrolithiasis. BMC Research Notes . 2020;13(1):373–377. doi: 10.1186/s13104-020-05206-y. [DOI] [PMC free article] [PubMed] [Google Scholar]
- 14.Shivappa N., Steck S. E., Hurley T. G., Hussey J. R., Hébert J. R. Designing and developing a literature-derived, population-based dietary inflammatory index. Public Health Nutrition . 2014;17(8):1689–1696. doi: 10.1017/s1368980013002115. [DOI] [PMC free article] [PubMed] [Google Scholar]
- 15.Varkaneh H. K., Fatahi S., Tajik S., Rahmani J., Zarezadeh M., Shab-Bidar S. Dietary inflammatory index in relation to obesity and body mass index: a meta-analysis. Nutrition & Food Science . 2018;48(5):702–721. doi: 10.1108/nfs-09-2017-0203. [DOI] [Google Scholar]
- 16.Yi Q., Li X., He Y., et al. Associations of dietary inflammatory index with metabolic syndrome and its components: a systematic review and meta-analysis. Public Health Nutrition . 2021;24(16):5463–5470. doi: 10.1017/s1368980021000288. [DOI] [PMC free article] [PubMed] [Google Scholar]
- 17.Shivappa N., Godos J., Hébert J., et al. Dietary inflammatory index and cardiovascular risk and mortality-A meta-analysis. Nutrients . 2018;10(2):p. 200. doi: 10.3390/nu10020200. [DOI] [PMC free article] [PubMed] [Google Scholar]
- 18.Aslani Z., Sadeghi O., Heidari-Beni M., et al. Association of dietary inflammatory potential with cardiometabolic risk factors and diseases: a systematic review and dose–response meta-analysis of observational studies. Diabetology & Metabolic Syndrome . 2020;12(1):1–40. doi: 10.1186/s13098-020-00615-2. [DOI] [PMC free article] [PubMed] [Google Scholar]
- 19.Farhangi M. A., Nikniaz L., Nikniaz Z., Dehghan P. Dietary inflammatory index potentially increases blood pressure and markers of glucose homeostasis among adults: findings from an updated systematic review and meta-analysis. Public Health Nutrition . 2020;23(8):1362–1380. doi: 10.1017/s1368980019003070. [DOI] [PMC free article] [PubMed] [Google Scholar]
- 20.Page M. J., McKenzie J. E., Bossuyt P. M., et al. The PRISMA 2020 statement: an updated guideline for reporting systematic reviews. BMJ . 2021;372 doi: 10.1136/bmj.n71. [DOI] [PMC free article] [PubMed] [Google Scholar]
- 21.Mtintsilana A., Micklesfield L. K., Chorell E., et al. Adiposity mediates the association between the dietary inflammatory index and markers of type 2 diabetes risk in middle-aged black South African women. Nutrients . 2019;11(6):p. 1246. doi: 10.3390/nu11061246. [DOI] [PMC free article] [PubMed] [Google Scholar]
- 22.Pocovi-Gerardino G., Correa-Rodríguez M., Callejas-Rubio J.-L., et al. Dietary inflammatory index score and cardiovascular disease risk markers in women with systemic lupus erythematosus. Journal of the Academy of Nutrition and Dietetics . 2020;120(2):280–287. doi: 10.1016/j.jand.2019.06.007. [DOI] [PubMed] [Google Scholar]
- 23.van Woudenbergh G. J., Theofylaktopoulou D., Kuijsten A., et al. Adapted dietary inflammatory index and its association with a summary score for low-grade inflammation and markers of glucose metabolism: the Cohort study on Diabetes and Atherosclerosis Maastricht (CODAM) and the Hoorn study. The American journal of clinical nutrition . 2013;98(6):1533–1542. doi: 10.3945/ajcn.112.056333. [DOI] [PubMed] [Google Scholar]
- 24.Shivappa N., Prizment A. E., Blair C. K., Jr., Jacobs D. R., Steck S. E., Hébert J. R. Dietary inflammatory index and risk of colorectal cancer in the Iowa women’s health study. Cancer Epidemiology Biomarkers & Prevention . 2014;23(11):2383–2392. doi: 10.1158/1055-9965.epi-14-0537. [DOI] [PMC free article] [PubMed] [Google Scholar]
- 25.Alkerwi A. a., Vernier C., Crichton G. E., Sauvageot N., Shivappa N., Hébert J. R. Cross-comparison of diet quality indices for predicting chronic disease risk: findings from the Observation of Cardiovascular Risk Factors in Luxembourg (ORISCAV-LUX) study. British Journal of Nutrition . 2015;113(2):259–269. doi: 10.1017/s0007114514003456. [DOI] [PMC free article] [PubMed] [Google Scholar]
- 26.Garcia-Arellano A., Ramallal R., Ruiz-Canela M., et al. Dietary inflammatory index and incidence of cardiovascular disease in the PREDIMED study. Nutrients . 2015;7(6):4124–4138. doi: 10.3390/nu7064124. [DOI] [PMC free article] [PubMed] [Google Scholar]
- 27.Ramallal R., Toledo E., Martínez-González M. A., et al. Dietary inflammatory index and incidence of cardiovascular disease in the SUN cohort. PLoS One . 2015;10(9) doi: 10.1371/journal.pone.0135221.e0135221 [DOI] [PMC free article] [PubMed] [Google Scholar]
- 28.Ruiz-Canela M., Zazpe I., Shivappa N., et al. Dietary inflammatory index and anthropometric measures of obesity in a population sample at high cardiovascular risk from the PREDIMED (PREvención con DIeta MEDiterránea) trial. British Journal of Nutrition . 2015;113(6):984–995. doi: 10.1017/s0007114514004401. [DOI] [PMC free article] [PubMed] [Google Scholar]
- 29.Sánchez-Villegas A., Ruíz-Canela M., de la Fuente-Arrillaga C., et al. Dietary inflammatory index, cardiometabolic conditions and depression in the Seguimiento Universidad de Navarra cohort study. British Journal of Nutrition . 2015;114(9):1471–1479. doi: 10.1017/S0007114515003074. [DOI] [PubMed] [Google Scholar]
- 30.Shivappa N., Bosetti C., Zucchetto A., Serraino D., La Vecchia C., Hébert J. R. Dietary inflammatory index and risk of pancreatic cancer in an Italian case-control study. British Journal of Nutrition . 2015;113(2):292–298. doi: 10.1017/s0007114514003626. [DOI] [PMC free article] [PubMed] [Google Scholar]
- 31.Xu H., Sjögren P., Ärnlöv J., et al. A proinflammatory diet is associated with systemic inflammation and reduced kidney function in elderly adults. Journal of Nutrition . 2015;145(4):729–735. doi: 10.3945/jn.114.205187. [DOI] [PubMed] [Google Scholar]
- 32.Antwi S. O., Oberg A. L., Shivappa N., et al. Pancreatic cancer: associations of inflammatory potential of diet, cigarette smoking and long-standing diabetes. Carcinogenesis . 2016;37(5):481–490. doi: 10.1093/carcin/bgw022. [DOI] [PMC free article] [PubMed] [Google Scholar]
- 33.Moslehi N., Ehsani B., Mirmiran P., et al. Inflammatory properties of diet and glucose-insulin homeostasis in a cohort of Iranian adults. Nutrients . 2016;8(11):p. 735. doi: 10.3390/nu8110735. [DOI] [PMC free article] [PubMed] [Google Scholar]
- 34.Vissers L. E. T., Waller M. A., van der Schouw Y. T., et al. The relationship between the dietary inflammatory index and risk of total cardiovascular disease, ischemic heart disease and cerebrovascular disease: findings from an Australian population-based prospective cohort study of women. Atherosclerosis . 2016;253:164–170. doi: 10.1016/j.atherosclerosis.2016.07.929. [DOI] [PubMed] [Google Scholar]
- 35.Bergmans R. S., Malecki K. M. The association of dietary inflammatory potential with depression and mental well-being among U.S. adults. Preventive Medicine . 2017;99:313–319. doi: 10.1016/j.ypmed.2017.03.016. [DOI] [PMC free article] [PubMed] [Google Scholar]
- 36.Bodén S., Wennberg M., Van Guelpen B., et al. Dietary inflammatory index and risk of first myocardial infarction; a prospective population-based study. Nutrition Journal . 2017;16(1):1–10. doi: 10.1186/s12937-017-0243-8. [DOI] [PMC free article] [PubMed] [Google Scholar]
- 37.Shivappa N., Steck S. E., Hussey J. R., Ma Y., Hebert J. R. Inflammatory potential of diet and all-cause, cardiovascular, and cancer mortality in national health and nutrition examination survey III study. European Journal of Nutrition . 2017;56(2):683–692. doi: 10.1007/s00394-015-1112-x. [DOI] [PMC free article] [PubMed] [Google Scholar]
- 38.Vissers L. E. T., Waller M., van der Schouw Y. T., et al. A pro-inflammatory diet is associated with increased risk of developing hypertension among middle-aged women. Nutrition, Metabolism, and Cardiovascular Diseases . 2017;27(6):564–570. doi: 10.1016/j.numecd.2017.03.005. [DOI] [PubMed] [Google Scholar]
- 39.Denova-Gutiérrez E., Muñoz-Aguirre P., Shivappa N., et al. Dietary inflammatory index and type 2 diabetes mellitus in adults: the diabetes mellitus survey of Mexico City. Nutrients . 2018;10(4):p. 385. doi: 10.3390/nu10040385. [DOI] [PMC free article] [PubMed] [Google Scholar]
- 40.Farhangi M. A., Najafi M. Dietary inflammatory index: a potent association with cardiovascular risk factors among patients candidate for coronary artery bypass grafting (CABG) surgery. Nutrition Journal . 2018;17(1):20–10. doi: 10.1186/s12937-018-0325-2. [DOI] [PMC free article] [PubMed] [Google Scholar]
- 41.Hodge A. M., Bassett J. K., Dugué P.-A., et al. Dietary inflammatory index or Mediterranean diet score as risk factors for total and cardiovascular mortality. Nutrition, Metabolism, and Cardiovascular Diseases . 2018;28(5):461–469. doi: 10.1016/j.numecd.2018.01.010. [DOI] [PMC free article] [PubMed] [Google Scholar]
- 42.Phillips C. M., Shivappa N., Hébert J. R., Perry I. J. Dietary inflammatory index and mental health: a cross-sectional analysis of the relationship with depressive symptoms, anxiety and well-being in adults. Clinical Nutrition . 2018;37(5):1485–1491. doi: 10.1016/j.clnu.2017.08.029. [DOI] [PubMed] [Google Scholar]
- 43.Shivappa N., Bonaccio M., Hebert J. R., et al. Association of proinflammatory diet with low-grade inflammation: results from the Moli-sani study. Nutrition . 2018;54:182–188. doi: 10.1016/j.nut.2018.04.004. [DOI] [PMC free article] [PubMed] [Google Scholar]
- 44.Shivappa N., Schneider A., Hébert J. R., Koenig W., Peters A., Thorand B. Association between dietary inflammatory index, and cause-specific mortality in the MONICA/KORA Augsburg Cohort Study. The European Journal of Public Health . 2018;28(1):167–172. doi: 10.1093/eurpub/ckx060. [DOI] [PMC free article] [PubMed] [Google Scholar]
- 45.Tomata Y., Shivappa N., Zhang S., et al. Dietary inflammatory index and disability-free survival in community-dwelling older adults. Nutrients . 2018;10(12):p. 1896. doi: 10.3390/nu10121896. [DOI] [PMC free article] [PubMed] [Google Scholar]
- 46.Wirth M. D., Sevoyan M., Hofseth L., Shivappa N., Hurley T. G., Hébert J. R. The dietary inflammatory index is associated with elevated white blood cell counts in the national health and nutrition examination survey. Brain, Behavior, and Immunity . 2018;69:296–303. doi: 10.1016/j.bbi.2017.12.003. [DOI] [PMC free article] [PubMed] [Google Scholar]
- 47.Zheng J., Merchant A. T., Wirth M. D., et al. Inflammatory potential of diet and risk of pancreatic cancer in the prostate, lung, colorectal and ovarian (PLCO) cancer screening trial. International Journal of Cancer . 2018;142(12):2461–2470. doi: 10.1002/ijc.31271. [DOI] [PMC free article] [PubMed] [Google Scholar]
- 48.Agraib L. M., Azab M., Al-Shudifat A.-E., et al. Dietary inflammatory index and odds of coronary artery disease in a case-control study from Jordan. Nutrition . 2019;63-64:98–105. doi: 10.1016/j.nut.2018.11.027. [DOI] [PubMed] [Google Scholar]
- 49.Bondonno N. P., Blekkenhorst L. C., Bird A. L., et al. Dietary inflammatory index and the aging kidney in older women: a 10-year prospective cohort study. European Journal of Nutrition . 2019;59(7):1–11. doi: 10.1007/s00394-019-02160-9. [DOI] [PubMed] [Google Scholar]
- 50.Guinter M. A., Merchant A. T., Tabung F. K., et al. Adiposity does not modify the effect of the dietary inflammatory potential on type 2 diabetes incidence among a prospective cohort of men. Journal of Nutrition & Intermediary Metabolism . 2019;16 doi: 10.1016/j.jnim.2019.100095.100095 [DOI] [PMC free article] [PubMed] [Google Scholar]
- 51.King D. E., Xiang J. The dietary inflammatory index is associated with diabetes severity. The Journal of the American Board of Family Medicine . 2019;32(6):801–806. doi: 10.3122/jabfm.2019.06.190092. [DOI] [PMC free article] [PubMed] [Google Scholar]
- 52.Laouali N., Mancini F. R., Hajji-Louati M., et al. Dietary inflammatory index and type 2 diabetes risk in a prospective cohort of 70,991 women followed for 20 years: the mediating role of BMI. Diabetologia . 2019;62(12):2222–2232. doi: 10.1007/s00125-019-04972-0. [DOI] [PubMed] [Google Scholar]
- 53.McMahon D. M., Burch J. B., Hébert J. R., et al. Diet-related inflammation and risk of prostate cancer in the California Men’s Health Study. Annals of Epidemiology . 2019;29:30–38. doi: 10.1016/j.annepidem.2018.10.008. [DOI] [PMC free article] [PubMed] [Google Scholar]
- 54.Morimoto M., Shivappa N., de Souza Genaro P., et al. Lack of association between dietary inflammatory index and low impact fractures in the Brazilian population: the Brazilian Osteoporosis Study (BRAZOS) Advances in rheumatology (London, England) . 2019;59:p. 16. doi: 10.1186/s42358-019-0059-7. [DOI] [PubMed] [Google Scholar]
- 55.Park Y.-M. M., Choi M. K., Lee S.-S., et al. Dietary inflammatory potential and risk of mortality in metabolically healthy and unhealthy phenotypes among overweight and obese adults. Clinical Nutrition . 2019;38(2):682–688. doi: 10.1016/j.clnu.2018.04.002. [DOI] [PMC free article] [PubMed] [Google Scholar]
- 56.Rouhani M. H., Najafabadi M. M., Surkan P. J., Esmaillzadeh A., Feizi A., Azadbakht L. Dietary inflammatory index and its association with renal function and progression of chronic kidney disease. Clinical nutrition ESPEN . 2019;29:237–241. doi: 10.1016/j.clnesp.2018.09.001. [DOI] [PubMed] [Google Scholar]
- 57.Tyrovolas S., Panagiotakos D. B., Georgousopoulou E. N., et al. The anti-inflammatory potential of diet and nonalcoholic fatty liver disease: the ATTICA study. Therapeutic advances in gastroenterology . 2019;12 doi: 10.1177/1756284819858039.1756284819858039 [DOI] [PMC free article] [PubMed] [Google Scholar]
- 58.Zheng J., Wirth M. D., Merchant A. T., et al. Inflammatory potential of diet, inflammation-related lifestyle factors, and risk of pancreatic cancer: results from the NIH-AARP Diet and health study. Cancer Epidemiology Biomarkers & Prevention . 2019;28(7):1266–1270. doi: 10.1158/1055-9965.epi-19-0250. [DOI] [PMC free article] [PubMed] [Google Scholar]
- 59.Abdurahman A. A., Bule M., Azadbakhat L., et al. The association between diet quality and obesity-related metabolic risks. Human Antibodies . 2020;28(1):1–9. doi: 10.3233/hab-190387. [DOI] [PubMed] [Google Scholar]
- 60.Asadi Z., Ghaffarian Zirak R., Yaghooti Khorasani M., et al. Dietary inflammatory index is associated with healthy eating index, alternative healthy eating index, and dietary patterns among Iranian adults. Journal of Clinical Laboratory Analysis . 2020;34(12) doi: 10.1002/jcla.23523.e23523 [DOI] [PMC free article] [PubMed] [Google Scholar]
- 61.Asadi Z., Yaghooti‐Khorasani M., Ghazizadeh H., et al. Association between dietary inflammatory index and risk of cardiovascular disease in the Mashhad stroke and heart atherosclerotic disorder study population. IUBMB Life . 2020;72(4):706–715. doi: 10.1002/iub.2172. [DOI] [PubMed] [Google Scholar]
- 62.Herrou J., Julia C., Kesse-Guyot E., et al. Absence of association between inflammatory dietary pattern and low trauma fractures: results of the French cohort NutriNet-Santé. Joint Bone Spine . 2020;87(6):632–639. doi: 10.1016/j.jbspin.2020.05.013. [DOI] [PubMed] [Google Scholar]
- 63.Lee D. H., Li J., Li Y., et al. Dietary inflammatory and insulinemic potential and risk of type 2 diabetes: results from three prospective U.S. Cohort studies. Diabetes Care . 2020;43(11):2675–2683. doi: 10.2337/dc20-0815. [DOI] [PMC free article] [PubMed] [Google Scholar]
- 64.Lee Y.-N., Kang P. Relationship between the 10-year risk for atherosclerotic cardiovascular disease and the dietary inflammatory index among korean adults based on the seventh korea national health and nutrition examination survey (KNHANES) BioMed Research International . 2020;2020:8. doi: 10.1155/2020/8196798.8196798 [DOI] [PMC free article] [PubMed] [Google Scholar]
- 65.Li J., Lee D. H., Hu J., et al. Dietary inflammatory potential and risk of cardiovascular disease among men and women in the U.S. Journal of the American College of Cardiology . 2020;76(19):2181–2193. doi: 10.1016/j.jacc.2020.09.535. [DOI] [PMC free article] [PubMed] [Google Scholar]
- 66.Veronese N., Cisternino A. M., Shivappa N., et al. Dietary inflammatory index and mortality: a cohort longitudinal study in a Mediterranean area. Journal of Human Nutrition and Dietetics . 2020;33(1):138–146. doi: 10.1111/jhn.12701. [DOI] [PubMed] [Google Scholar]
- 67.Wang K., Sun J. Z., Wu Q. X., et al. Long-term anti-inflammatory diet in relation to improved breast cancer prognosis: a prospective cohort study. NPJ Breast Cancer . 2020;6(1):36–11. doi: 10.1038/s41523-020-00179-4. [DOI] [PMC free article] [PubMed] [Google Scholar]
- 68.Wang T., Jiang H., Wu Y., Wang W., Zhang D. The association between Dietary Inflammatory Index and disability in older adults. Clinical Nutrition . 2020;40(4):2285–2292. doi: 10.1016/j.clnu.2020.10.017. [DOI] [PubMed] [Google Scholar]
- 69.Zabetian-Targhi F., Srikanth V. K., Smith K. J., et al. Associations between the dietary inflammatory index, brain volume, small vessel disease, and global cognitive function. Journal of the Academy of Nutrition and Dietetics . 2020;121(5):915–924. doi: 10.1016/j.jand.2020.11.004. [DOI] [PubMed] [Google Scholar]
- 70.Mazidi M., Shivappa N., Wirth M. D., Hebert J. R., Kengne A. P. Greater Dietary Inflammatory Index score is associated with higher likelihood of chronic kidney disease. British Journal of Nutrition . 2018;120(2):204–209. doi: 10.1017/s0007114518001071. [DOI] [PubMed] [Google Scholar]
- 71.Pereira S. S., Alvarez-Leite J. I. Low-grade inflammation, obesity, and diabetes. Current obesity reports . 2014;3(4):422–431. doi: 10.1007/s13679-014-0124-9. [DOI] [PubMed] [Google Scholar]
- 72.Esmaillzadeh A., Kimiagar M., Mehrabi Y., Azadbakht L., Hu F. B., Willett W. C. Dietary patterns and markers of systemic inflammation among Iranian women. Journal of Nutrition . 2007;137(4):992–998. doi: 10.1093/jn/137.4.992. [DOI] [PubMed] [Google Scholar]
- 73.van Dam R. M., Rimm E. B., Willett W. C., Stampfer M. J., Hu F. B. Dietary patterns and risk for type 2 diabetes mellitus in U.S. Men. Annals of Internal Medicine . 2002;136(3):201–209. doi: 10.7326/0003-4819-136-3-200202050-00008. [DOI] [PubMed] [Google Scholar]
- 74.Shu L., Shen X. M., Li C., Zhang X. Y., Zheng P. F. Dietary patterns are associated with type 2 diabetes mellitus among middle-aged adults in Zhejiang Province, China. Nutrition Journal . 2017;16(1):81–89. doi: 10.1186/s12937-017-0303-0. [DOI] [PMC free article] [PubMed] [Google Scholar]
- 75.Maiorino M. I., Bellastella G., Petrizzo M., Scappaticcio L., Giugliano D., Esposito K. Anti-inflammatory effect of Mediterranean diet in type 2 diabetes is durable: 8-year follow-up of a controlled trial. Diabetes Care . 2016;39(3):e44–e45. doi: 10.2337/dc15-2356. [DOI] [PubMed] [Google Scholar]
- 76.Martínez-González M. Á, De la Fuente-Arrillaga C., Nunez-Cordoba J., et al. Adherence to Mediterranean diet and risk of developing diabetes: prospective cohort study. BMJ . 2008;336(7657):1348–1351. doi: 10.1136/bmj.39561.501007.BE. [DOI] [PMC free article] [PubMed] [Google Scholar]
- 77.Shivappa N., Hébert J. R., Rietzschel E. R., et al. Associations between dietary inflammatory index and inflammatory markers in the Asklepios Study. British Journal of Nutrition . 2015;113(4):665–671. doi: 10.1017/s000711451400395x. [DOI] [PMC free article] [PubMed] [Google Scholar]
- 78.Wang X., Bao W., Liu J., et al. Inflammatory markers and risk of type 2 diabetes. Diabetes Care . 2013;36(1):166–175. doi: 10.2337/dc12-0702. [DOI] [PMC free article] [PubMed] [Google Scholar]
- 79.Vahid F., Shivappa N., Karamati M., Naeini A. J., Hebert J. R., Davoodi S. H. Association between Dietary Inflammatory Index (DII) and risk of prediabetes: a case-control study. Applied Physiology Nutrition and Metabolism . 2017;42(4):399–404. doi: 10.1139/apnm-2016-0395. [DOI] [PubMed] [Google Scholar]
- 80.McGeoghegan L., Muirhead C. R., Almoosawi S. Association between an anti-inflammatory and anti-oxidant dietary pattern and diabetes in British adults: results from the national diet and nutrition survey rolling programme years 1-4. International Journal of Food Sciences and Nutrition . 2016;67(5):553–561. doi: 10.1080/09637486.2016.1179268. [DOI] [PubMed] [Google Scholar]
- 81.Pollack R. M., Donath M. Y., LeRoith D., Leibowitz G. Anti-inflammatory agents in the treatment of diabetes and its vascular complications. Diabetes Care . 2016;39(Supplement 2):S244–S52. doi: 10.2337/dcs15-3015. [DOI] [PubMed] [Google Scholar]
- 82.Mozaffarian D., Pischon T., Hankinson S. E., et al. Dietary intake of trans fatty acids and systemic inflammation in women. The American journal of clinical nutrition . 2004;79(4):606–612. doi: 10.1093/ajcn/79.4.606. [DOI] [PMC free article] [PubMed] [Google Scholar]
- 83.Strasser B., Berger K., Fuchs D. Effects of a caloric restriction weight loss diet on tryptophan metabolism and inflammatory biomarkers in overweight adults. European Journal of Nutrition . 2015;54(1):101–107. doi: 10.1007/s00394-014-0690-3. [DOI] [PubMed] [Google Scholar]
- 84.Han S. N., Leka L. S., Lichtenstein A. H., Ausman L. M., Schaefer E. J., Meydani S. N. Effect of hydrogenated and saturated, relative to polyunsaturated, fat on immune and inflammatory responses of adults with moderate hypercholesterolemia. Journal of lipid research . 2002;43(3):445–452. doi: 10.1016/s0022-2275(20)30151-6. [DOI] [PubMed] [Google Scholar]
- 85.Lane M. A., Ingram D. K., Roth G. S. Calorie restriction in nonhuman primates: effects on diabetes and cardiovascular disease risk. Toxicological Sciences: An Official Journal of the Society of Toxicology . 1999;52(suppl_1):41–48. doi: 10.1093/toxsci/52.2.41. [DOI] [PubMed] [Google Scholar]
- 86.Mahendran Y., Cederberg H., Vangipurapu J., et al. Glycerol and fatty acids in serum predict the development of hyperglycemia and type 2 diabetes in Finnish men. Diabetes Care . 2013;36(11):3732–3738. doi: 10.2337/dc13-0800. [DOI] [PMC free article] [PubMed] [Google Scholar]
- 87.Sirtori C. R., Galli C. N-3 fatty acids and diabetes. Biomedicine & Pharmacotherapy . 2002;56(8):397–406. doi: 10.1016/s0753-3322(02)00255-x. [DOI] [PubMed] [Google Scholar]
- 88.Ford E. S., Mokdad A. H. Fruit and vegetable consumption and diabetes mellitus incidence among U.S. Adults. Preventive Medicine . 2001;32(1):33–39. doi: 10.1006/pmed.2000.0772. [DOI] [PubMed] [Google Scholar]
- 89.Holt E. M., Steffen L. M., Moran A., et al. Fruit and vegetable consumption and its relation to markers of inflammation and oxidative stress in adolescents. Journal of the American Dietetic Association . 2009;109(3):414–421. doi: 10.1016/j.jada.2008.11.036. [DOI] [PMC free article] [PubMed] [Google Scholar]
- 90.Kim Y., Chen J., Wirth M., Shivappa N., Hebert J. Lower dietary inflammatory index scores are associated with lower glycemic index scores among college students. Nutrients . 2018;10(2):p. 182. doi: 10.3390/nu10020182. [DOI] [PMC free article] [PubMed] [Google Scholar]
- 91.Bouché C., Rizkalla S. W., Luo J., et al. Five-week, low–glycemic index diet decreases total fat mass and improves plasma lipid profile in moderately overweight nondiabetic men. Diabetes Care . 2002;25(5):822–828. doi: 10.2337/diacare.25.5.822. [DOI] [PubMed] [Google Scholar]
- 92.Schwingshackl L., Hoffmann G. Long-term effects of low glycemic index/load vs. high glycemic index/load diets on parameters of obesity and obesity-associated risks: a systematic review and meta-analysis. Nutrition, Metabolism, and Cardiovascular Diseases . 2013;23(8):699–706. doi: 10.1016/j.numecd.2013.04.008. [DOI] [PubMed] [Google Scholar]
- 93.Joslowski G., Halim J., Goletzke J., et al. Dietary glycemic load, insulin load, and weight loss in obese, insulin resistant adolescents: RESIST study. Clinical Nutrition . 2015;34(1):89–94. doi: 10.1016/j.clnu.2014.01.015. [DOI] [PubMed] [Google Scholar]
Associated Data
This section collects any data citations, data availability statements, or supplementary materials included in this article.
Data Availability Statement
All data and codes are available by contacting the corresponding author.