

Abstract
Background
Current guidelines call for peer‐reviewed evidence of efficacy and safety for commercial weight loss programs to be recommended as options for those seeking to lose weight.
Objectives
This study investigated the Ideal Protein (IP) system, a commercial weight loss program, compared to a guideline‐based, low‐calorie/low‐fat (LCLF) dietary behavioral intervention on body weight and CVD risk factors in adults with obesity.
Methods
In this randomized, assessor‐blinded, parallel‐group trial, 192 participants with body mass index (BMI) ≥30 and ≤49 kg/m2 were assigned to either the IP Phase I diet or LFLC diet interventions. The IP Phase I is focused on lean protein and vegetables with avoidance of fruit and dairy, while the LFLC diet goals include <30% of daily energy from fat, <7% from saturated fat, 55% from carbohydrate, and an energy deficit of 500 kcal/day. The primary endpoint was change in body weight at 3 months. Secondary endpoints included change in waist circumference (WC), hip circumference (HC), total cholesterol (TC), low‐density lipoprotein cholesterol (LDL‐C) and high‐density lipoprotein cholesterol (HDL‐C), triglycerides (TG), fasting glucose (FG), systolic blood pressure (SBP) and diastolic blood pressure (DBP).
Results
The mean ± SD of change in weight at 3 months was −9.6 ± 12.7 kg in the IP group as compared to −1.6 ± 27.2 kg in the LFLC group. The mean between‐group difference in change at 3 months was −8.1 kg (95% confidence interval [CI] −16.6 to 0.6; p = 0.05). Additional significant between‐group differences included WC, HC, TC, and TG levels, all favoring the IP group. There were no serious adverse events during the intervention period.
Conclusions
The present findings demonstrate the efficacy and safety of the IP weight loss program as compared to a guideline‐based LCLF dietary behavioral intervention among black and white adults with obesity and CVD risk factors, providing support for the effectiveness of the program.
Keywords: carbohydrate‐restricted, diet, energy intake, food, nutrition, weight loss
1. INTRODUCTION
Obesity is a major public health problem and contributes substantially to risk for cardiovascular diseases (CVD) and Type 2 diabetes mellitus, both among the top causes of death in the United States. 1 Dietary strategies have long been the cornerstone of strategies to prevent and treat obesity as well as CVD risk factors including Type 2 diabetes. In 1998, the National Heart Lung and Blood Institute recommended dietary approaches that are low‐calorie, achieved by reducing quantity of food intake, particularly those rich in dietary fat and carbohydrates, for weight loss among persons with obesity. 2 Likewise, recent evidence has supported the efficacy of dietary strategies which focus on restricting specific macronutrients to create the calorie deficit necessary for weight loss. 3 Within a framework of overall energy reduction, dietary macronutrient composition has been known to influence vascular risk factors that are changed via weight loss (e.g., lipid profile, blood glucose, and/or blood pressure). Given that CVD is the leading cause of death in the United States, from a public health perspective, it is critically important to examine the effects of dietary behavioral weight loss programs on both measures of adiposity and important CVD risk factors.
Weight loss guidelines call for commercial weight loss programs to assess their products and programs in randomized controlled trials. 4 For example, Summary recommendation 4 days of the 2013 American Heart Association/American College of Cardiology/The Obesity Society (AHA/ACC/TOS) Guideline for the Management of Overweight and Obesity in Adults 5 considers the use of commercial weight loss programs, stating that “some commercial‐based programs that provide a comprehensive lifestyle intervention can be prescribed as an option for weight loss, provided there is peer‐reviewed published evidence of their safety and efficacy.” Evidence of safety and efficacy is of paramount importance in the treatment of obesity and the guideline working group also recommended, “translational studies that evaluate programs that can be delivered in community, work‐site, and other settings (including commercial programs)”. 5
The objective of this study was to examine the effects of a popular, commercially available, restricted carbohydrate, optimal protein (Ideal Protein [IP]) dietary behavioral intervention, as compared to a standard, guideline‐based, low‐fat, low‐calorie (LFLC) dietary behavioral intervention on changes in body weight as primary outcome, and major CVD risk factors including lipid profile blood glucose, and blood pressure as secondary outcomes over the course of 3 months in a community setting. It was hypothesized that the IP intervention would produce equivalent or superior weight loss and CVD risk reduction as compared to the guideline based LFLC intervention.
2. METHOD
2.1. Setting and participants
Participants were recruited by means of flyers, phone calls, and mass media advertisements (print and radio) from the community of Bogalusa, Louisiana and its surroundings. Interested participants reported to the Tulane University field research clinic in Bogalusa, Louisiana and were screened for eligibility based on inclusion and exclusion criteria as well as completion of a one‐week self‐monitoring run‐in period with food diary. Enrollment and follow‐up of participants was conducted from January of 2018 through February of 2020. Men and women aged 22–79 years with a body mass index 30–49 kg/m2 were included. In addition, participants were required to have at least one co‐morbid condition that increased risk of CVD (e.g., history of CVD, Type 2 diabetes mellitus, fasting plasma glucose>100 mg/dL, metabolic syndrome as defined by ATP III criteria, hypertension, hyperlipidemia, waist circumference>40 in for men or >35 in for women). Major exclusion criteria were hospitalization for a CVD event such as myocardial infarction, stroke, transient ischemic attack, coronary revascularization, heart failure, peripheral artery disease, or unstable angina within the last 6 weeks or unstable coronary artery disease; pregnancy or breastfeeding; history of bariatric surgery, currently on a diet or using prescription weight loss medications, and/or experienced weight loss >15 pounds within 6 months of study entry; regular use of alcohol >3 beverages per day or 21 beverages per week; past or present history of an eating disorder (including anorexia, bulimia or binge eating disorder) or severe/untreated psychiatric illness. A total of 192 participants (mean ± SD age 52 ± 13, 80% female, 27% African American) were included in the study (Figure 1). This study was registered at clinicaltrials.gov as NCT03515889.
FIGURE 1.
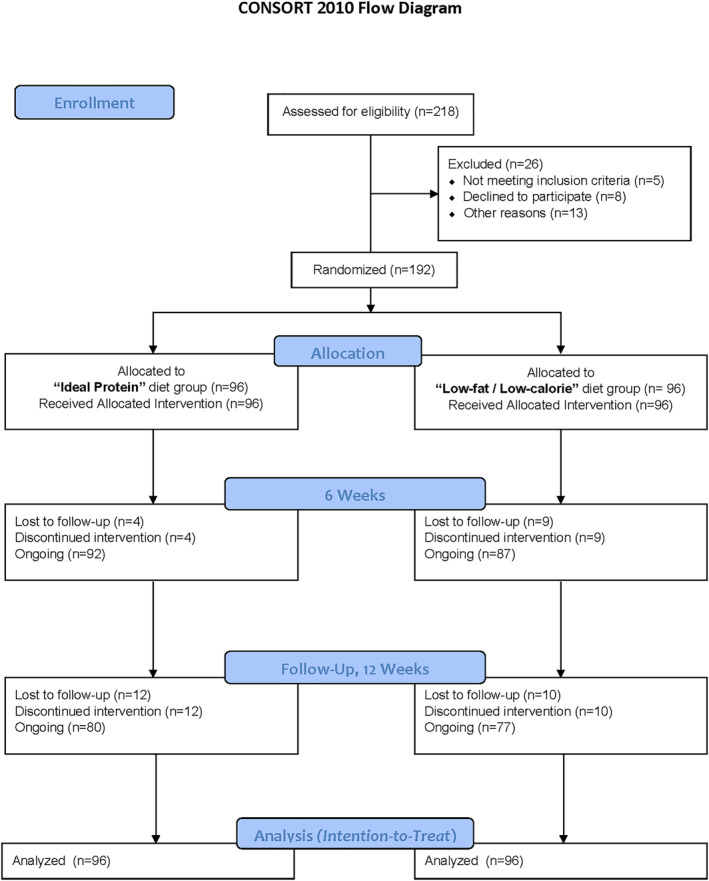
Flow of participants in the study
2.2. Study design and intervention
Participants were assigned, using a blocked, sex‐stratified, 1:1 randomization, to one of the two diet intervention groups. The intervention assignments were obtained by phone call or computer on the day of randomization. Prior to randomization, all potential participants were required to successfully complete a 1‐week run‐in period, during which daily intake of food was recorded in a standardized food diary. Participants who failed to record their daily food intake in the diary for five or more days in the 7‐day period were excluded.
Participants assigned to the guideline‐based, low‐fat, diet group were instructed to maintain <30% of daily energy from total fat, with <7% from saturated fat, and 55% from carbohydrate, and an energy deficit of 500 kcal/day based on current and previous recommendations. 6 Participants in the IP group followed the Phase I diet as documented in the Ideal Protein Clinic Manual and in the Ideal Protein Coaches Manual. Briefly, the IP Phase I diet does not include a specific calorie deficit goal or carbohydrate goal but is a prescriptive diet with a focus on lean protein, vegetables and avoidance of fruit and dairy. Instructions for the IP Phase I diet are provided in Table S1.
Both groups were provided supplementary foods appropriate for their dietary goals in order to improve adherence to the two diets. Foods were provided at the research clinic every two weeks. Participants picked up the supplementary foods at counselling visits with the study dietician at two‐week intervals. Foods provided to the guideline based LFLC were low‐fat and low‐calorie and available at local grocery stores, for example ready‐to‐eat tuna salad, high‐fiber breakfast cereals, air popped popcorn, instant oatmeal, and others. These foods were purchased by the study dietician from local grocery stores for distribution to participants at counseling visits. The IP group received prepackaged foods produced specifically for Ideal Protein program. These foods were ordered by the study dietician from the makers of Ideal Protein (Laboratories C.O.P). A list of foods provided to both groups is presented in Table S2.
Participants assigned to the IP group attended weekly in‐person, follow‐up visits of 15 min duration with a telephone follow‐up occurring during the first 4 days after initiating the program. At follow‐up visits study dieticians reinforced the diet guidance given as part of the program, food diary recording of dietary intake for the week prior, and assisted participants with goal setting for the next week. Participants assigned to the guideline based LCLF group met with a study dietician in weekly individual counseling sessions for the first 4 weeks, followed by small group counseling sessions every other week for the next 2 months (a maximum of 9 sessions). Specifically, these sessions assessed dietary practices based on food diary recording and taught behavioral techniques for weight loss that included reading nutrition labels, self‐monitoring, goal setting, grocery shopping, meal planning, changes to traditional recipes and the replacement of usual foods high in fat, strategies for dining out, and conscious eating. Both groups were asked to refrain from changing their physical activity levels during the intervention.
2.3. Data collection
Two 24‐h dietary recalls were obtained from participants at baseline and 3 months to characterize and monitor individual dietary intake of macronutrients. One recall reflected consumption on a weekday and the other reflected consumption on a weekend day. All dietary recalls were conducted by a certified study dietitian. Dietary nutrient intakes were calculated using the food composition tables of the Nutrition Data System for Research (NDSR, Minnesota, MN).
A detailed medical history including hypertension, diabetes, CVD, medication use, and health behaviors (smoking habits, alcohol use, and physical activity) was obtained at the screening visit. Exercise intervention was not a part of this study and participants in both groups were asked to maintain their usual level of physical activity. To monitor physical activity levels, self‐report was collected at each clinical visit using the international physical activity questionnaire (IPAQ). The IPAQ has been used to monitor physical activity levels in randomized controlled trials dietary weight loss interventions. 7 , 8 , 9 Anthropometric measures, blood pressure, blood and urine samples were collected at the screening visit, at randomization, and at 3‐month follow‐up visit. Body weight and height were measured without shoes to the nearest 0.1 kg and 0.1 cm, respectively, using a single calibrated scale (Detecto, model 6855, Webb City, MO) and free‐standing digital stadiometer (Seca North America, Chino, CA). Two replicate measurements of body weight were collected, and the arithmetic mean was used for analyses. Waist circumference was measured 1 cm above the umbilicus. To minimize measurement error, the Gulick II tape measure with a tensioning device was used. Two measurements were obtained, and the arithmetic mean was used for analyses. Experienced staff, trained and certified in BP measurement, who were blinded to the participant assignment measured BP using an automated oscillometric Omron HEM 907 sphygmomanometer after the individual had been seated quietly for 5 min 10 Blood samples were collected after an 8‐h fast. Serum total cholesterol, high density lipoprotein (HDL) cholesterol and triglycerides were assayed according to procedures recommended by the National Heart, Lung, and Blood Institute and the Centers for Disease Control and Prevention. 11 Low density lipoprotein (LDL) cholesterol was calculated using the Friedewald formula. 12 Fasting plasma glucose was measured using standard enzymatic methods. Glycosylated hemoglobin (HbA1c) was measured using a quantitative antibody assay (Tina Quant®, Roche Diagnostics). Urinary ketones were measured via urine dipstick. This study was approved by the Tulane University Institutional Review Board and written informed consent was provide by all participants.
2.4. Statistical analyses
The power assessment for the primary endpoint, body weight, was based on data abstracted from trials similar to this study. 13 , 14 , 15 Assuming 80% power and a two‐sided significance level of 0.05, 80 participants per group were needed to provide statistical power to detect a significant difference in standardized effect size of 0.16. The sample size of 192 participants allows for a 20% dropout rate following randomization.
Data on baseline characteristics of study participants were expressed as Mean (SD) or n (%). Student t‐tests or Chi‐square tests were used to compare baseline characteristics between the IP and the LFLC groups. For the primary and secondary endpoints (continuous outcomes), a random‐effect linear model was fitted to all observed data and allowed missing data under the assumption of missing at random. Each random‐effect model consists of a random intercept and a random slope to adjust for the within‐participant variability among the observed longitudinal data. Complete data are not necessary for analysis with mixed models. Such models assume that missing data are unrelated to previously observed outcomes but can be related to the treatment because it is a covariate in the model, or covariate‐dependent missing completely at random. Likelihood‐based mixed effects models (random intercept and slope) further relax the covariate‐dependent missing‐completely at random assumption by allowing missing data to be dependent on previously observed outcomes and treatment (in other words, missing at random). Multiple imputation was used to replace missing data in sensitivity analyses. All p values were two‐sided and statistical significance was defined as p < 0.05. SAS (SAS Institute Inc, Cary, North Carolina) or R were used for all analyses.
3. RESULTS
3.1. Baseline characteristics
Baseline characteristics of the trial participants are shown in Table 1. Demographic characteristics and cardiovascular risk factors were similar between groups. The percentage of participants completing assessment at 3 months was 81.3% (n = 156), with 83.3% in the IP group, and 80.2% in the LFLC group, respectively (Figure 1).
TABLE 1.
Baseline characteristics of study participants by dietary intervention group
| Characteristic | Dietary intervention group | |
|---|---|---|
| IP group (n = 96) | LFLC group (n = 96) | |
| Demographics | ||
| Age, years | 52.8 (13.2) | 51.9 (13.1) |
| Sex, n (%) | ||
| Male | 19 (19.8) | 19 (19.8) |
| Female | 77 (80.2) | 77 (80.2) |
| Race, n (%) | ||
| Black | 22 (22.9) | 29 (30.2) |
| White | 73 (76.0) | 65 (67.7) |
| Other | 1 (1.1) | 2 (2.1) |
| Anthropometrics | ||
| Weight, kg | 108.2 (19.9) | 106.2 (25) |
| BMI, kg/m2 | 38.6 (5.9) | 38.8 (10.2) |
| Waist circumference, cm | 114.0 (13.1) | 113.3 (11.8) |
| Hip circumference, cm | 122.3 (11.9) | 120.9 (11.4) |
| Lipids metabolism | ||
| Total cholesterol, mg/dL | 184.6 (37.4) | 184.8 (38.7) |
| HDL‐C, mg/dL | 49.0 (11.0) | 49.6 (14.0) |
| LDL‐C, mg/dL | 108.7 (32.2) | 110 (33.4) |
| Triglycerides, mg/dL a | 118.0 (80.0) | 127.1 (64.6) |
| Glucose metabolism | ||
| Glucose, mg/dL | 111.2 (29.8) | 110.8 (30.2) |
| HbA1C, % | 5.9 (0.9) | 5.9 (0.8) |
| Blood pressure | ||
| SBP, mmHg | 127.9 (15.4) | 127.6 (17.4) |
| DBP, mmHg | 77.9 (9.8) | 79.3 (14) |
Note: Values expressed as mean (SD) and frequencies (%), unless otherwise stated.
Abbreviations: BMI, body mass index; DBP, diastolic blood pressure; Glucose, fasting blood glucose; HbA1C, hemoglobin A1C/glycated hemoglobin; HDL‐C, high‐density lipoprotein cholesterol; IP, ideal protein; LDL‐C, low‐density lipoprotein cholesterol; LFLC, low‐fat low‐calorie; SBP, systolic blood pressure.
Median (interquartile range).
3.2. Body weight and waist circumference
Weight loss from baseline values was greater in the IP group than in the LCLF group at 3 months (Table 2). The reduction in body weight was significantly greater in the IP group as compared to the LCLF group (mean difference in change at 3 months, −8.1 kg; 95% CI, −16.6 to 0.6, p = 0.05). Change in weight from baseline in the IP group was −9.6 ± 12.7 kg, whereas change in weight from baseline in the LCLF group was −1.6 ± 27.2 kg (Figure 2). Participants in both groups significantly reduced their waist circumference. Changes in waist circumference favored the IP group as compared to the LCLF group (−3.8 cm, 95%CI ‐6.2 to 1.4; p < 0.01). Similarly, changes in hip circumference were significantly different between groups and favored the IP group as compared to the LCLF group (p < 0.01).
TABLE 2.
Between‐ and within‐dietary intervention group differences in secondary endpoints at 3 months
| Secondary endpoints | IP group | LFLC group | Between‐group difference | |||||||
|---|---|---|---|---|---|---|---|---|---|---|
| Baseline | 3‐Month | Mean change | p value | Baseline | 3‐Month | Mean change | p value | Mean difference | p value | |
| BMI, kg/m2 | 38.6 (5.9) | 35.1 (5.0) | −3.5 (4.6) | <0.001 | 38.8 (10.2) | 38.2 (17) | −0.6 (18.7) | 0.76 | −2.9 (−6.8 to 1.0) | 0.15 |
| Waist circumference, cm | 114.0 (13.1) | 105.9 (15.6) | −8.0 (10.1) | <0.001 | 113.3 (11.8) | 109.1 (12.3) | −4.2 (6.3) | <0.001 | −3.8 (−6.2 to 1.4) | <0.01 |
| Hip circumference, cm | 122.3 (11.9) | 115.3 (12.5) | −7 (8.5) | <0.001 | 120.9 (11.4) | 117.6 (11.4) | −3.4 (5.6) | <0.001 | −3.6 (−5.7 to −1.6) | <0.01 |
| Total cholesterol, mg/dL | 184.6 (37.4) | 174.4 (38.5) | −9.8 (24.7) | <0.001 | 184.8 (38.7) | 181.2 (36.2) | −3.6 (19.1) | 0.06 | −6.2 (−12.5 to 0.1) | 0.05 |
| HDL‐C, mg/dL | 49.0 (11.0) | 49.0 (11.6) | −0.04 (6.4) | 0.95 | 49.6 (14.0) | 49.9 (12.6) | 0.3 (6.6) | 0.67 | −0.3 (−2.2 to 1.5) | 0.73 |
| LDL‐C, mg/dL | 108.7 (32.2) | 105.3 (31.0) | −3.4 (21.9) | 0.13 | 110.0 (33.4) | 108.2 (33.5) | −1.8 (18.5) | 0.35 | −1.6 (−7.4 to 4.2) | 0.58 |
| Triglycerides, mg/dL a | 118.0 (80.0) | 90.0 (49.0) | −29.7 (40.8) | <0.001 | 127.1 (64.6) | 111.1 (55.5) | −15.9 (41.7) | <0.001 | −13.8 (−25.6 to −2.0) | 0.02 |
| Glucose, mg/dL | 111.2 (29.8) | 99.4 (20.1) | −11.8 (21.6) | <0.001 | 110.8 (30.2) | 104.2 (21.9) | −6.6 (21.2) | <0.001 | −5.2 (−11.4 to 0.9) | 0.09 |
| HbA1C, % | 5.9 (0.9) | 5.6 (0.6) | −0.3 (0.5) | <0.001 | 5.9 (0.8) | 5.7 (0.6) | −0.2 (0.4) | <0.001 | −0.1 (−0.2 to 0.03) | 0.13 |
| SBP, mmHg | 127.9 (15.4) | 121.2 (14.1) | −6.8 (12.8) | <0.001 | 127.6 (17.4) | 124.3 (15.5) | −3.3 (13.2) | <0.01 | −3.5 (−7.2 to 0.2) | 0.06 |
| DBP, mmHg | 77.9 (9.8) | 72.6 (9.9) | −5.3 (8.7) | <0.001 | 79.3 (14.0) | 76.5 (10.0) | −2.8 (9.2) | 0.04 | −2.5 (−4.1 to 1.0) | 0.08 |
Note: Values expressed as mean (SD) unless otherwise stated. Between‐group differences reported as mean difference (95% confidence interval).
Abbreviations: BMI, body mass index; DBP, diastolic blood pressure; Glucose, fasting blood glucose; HbA1C, hemoglobin A1C/ glycated hemoglobin; HDL‐C, high‐density lipoprotein cholesterol; IP, ideal protein; LDL‐C, low‐density lipoprotein cholesterol; LFLC, low‐fat low‐calorie; SBP, systolic blood pressure.
Median (interquartile range).
FIGURE 2.
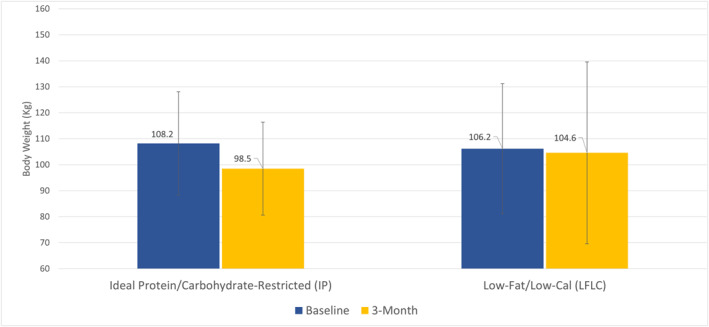
Primary efficacy endpoint (comparison of mean weight loss in kg between participants in the IP group vs. the LFLC group, at 3 months). Clustered column graph depicting average weight at base line (blue) and 3 months follow‐up (3‐month) for each dietary intervention group, respectively. The I bars indicate standard deviation. Weight loss was significant in the IP group at 3 months. No significant weight loss was observed in the LFLC group. The between‐group difference favored the IP group
3.3. Dietary intake, urinary ketones and physical activity
Dietary composition data for participants by randomized group assignments are summarized in Table 3. At baseline, reported dietary composition in the LFLC group was similar to that in the IP group. During follow‐up, total energy intake decreased significantly from baseline in both groups, but more so in the IP group than in the LCLF group (p < 0.001 between groups). The intake of total carbohydrate was significantly higher, and intakes of protein and total, saturated, and monounsaturated fat (as percentages of kilocalories) were significantly lower in the LCLF group at 3 months (p < 0.001 for these comparisons). At the 3‐month visit, 12 of 156 participants had detectable urinary ketones with 4 trace, 7 small and 1 large. Of those with detectable ketones, 10 were assigned to the IP group while 2 were assigned to the LCLF group. Self‐report physical activity levels did not differ by assigned group throughout the study (data not shown).
TABLE 3.
Between‐ and within‐dietary intervention group differences in dietary composition at 3 months
| Parameter | IP group | LFLC group | Between‐group difference | |||||||
|---|---|---|---|---|---|---|---|---|---|---|
| Baseline | 3‐Month | Mean change | p value | Baseline | 3‐Month | Mean change | p value | Mean difference | p value | |
| Energy, kcal | 1618.6 (544.9) | 864.9 (152.0) | −753.7 (545.6) | <0.001 | 1550.5 (557.2) | 1164.9 (413.8) | −385.6 (569.2) | <0.001 | −368.2 (−547.5 to −188.0) | <0.001 |
| Carbohydrate, g | 173.1 (69.9) | 52.9 (14.8) | −120.2 (72.2) | <0.001 | 176.4 (72.2) | 130 (48.6) | −46.4 (72.7) | <0.001 | −73.8 (−97.2 to −50.5) | <0.001 |
| Total DF, g | 12.9 (5.5) | 17.6 (6.1) | 4.7 (8.3) | <0.001 | 14.2 (7.2) | 14.8 (5.4) | 0.7 (7.7) | 0.47 | 4.1 (1.5 to 6.6) | <0.01 |
| Soluble DF, g | 4.3 (1.9) | 7.4 (3.6) | 3.2 (3.9) | <0.001 | 4.5 (2.2) | 5 (2.3) | 0.5 (2.8) | 0.13 | 2.6 (1.6 to 3.8) | <0.001 |
| Insoluble DF, g | 8.6 (4.1) | 10.3 (4.3) | 1.7 (6.0) | 0.02 | 9.6 (5.5) | 9.8 (4.1) | 0.2 (6.1) | 0.8 | 1.5 (−0.4 to 3.5) | 0.12 |
| SFA, g | 24.7 (11.5) | 11.2 (3.8) | −13.9 (11.8) | <0.001 | 20.7 (9.5) | 13.6 (8.3) | −7.1 (10.7) | <0.001 | −6.5 (−10.1 to −2.8) | <0.001 |
| MUFA, g | 26.5 (12.8) | 12.4 (4.1) | −14.1 (13.0) | <0.001 | 21.1 (8.8) | 16.2 (8.3) | −7.0 (10.5) | <0.001 | −7.2 (−10.9 to −3.4) | <0.001 |
| PUFA, g | 15.9 (7.2) | 4.8 (2.2) | −11.1 (7.0) | <0.001 | 15.7 (6.6) | 10.8 (5.3) | −5.0 (7.5) | <0.001 | −6.1 (−8.5 to −3.8) | <0.001 |
| Protein, g | 69.3 (25.8) | 103.3 (22.4) | 33.9 (32.1) | <0.001 | 67.2 (27.0) | 64.2 (21) | −3.0 (27.7) | 0.36 | 36.9 (27.2 to 46.6) | <0.001 |
| Dietary cholesterol, mg | 293.8 (164.8) | 245.2 (170) | −48.5 (233.5) | 0.07 | 259.9 (156.3) | 228.6 (136.5) | −31.3 (184.5) | 0.15 | −17.2 (−85.3 to 50.9) | 0.61 |
| Dietary Sodium, mg | 2872.7 (1031) | 1684.6 (731.9) | −1188.1 (1224) | <0.001 | 2775.0 (1096) | 2296.3 (904.9) | −478.7 (1256.0) | <0.01 | −709.5 (−1108.4 to −310.0) | <0.01 |
| Dietary Potassium, mg | 1801.0 (591.5) | 2040.4 (565) | 239.5 (778.3) | <0.01 | 1888.6 (787.2) | 1655.4 (495.2) | −233.3 (829.0) | 0.02 | 472.7 (214.2 to 731.3) | <0.001 |
| Omega 3 FA, g | 1.6 (0.8) | 0.7 (0.4) | −0.9 (0.8) | <0.001 | 1.6 (0.7) | 1.1 (0.6) | −0.5 (0.8) | <0.001 | −0.4 (−0.7 to 0.2) | <0.01 |
| Folate, mcg | 297.8 (127.1) | 312.4 (147.2) | 14.6 (200) | 0.52 | 296.9 (158.7) | 284.6 (186.2) | −12.3 (220.6) | 0.64 | 26.9 (−40.8 to 94.5) | 0.4 |
| Vitamin C, mg | 44.1 (37.1) | 107.6 (94.3) | 63.5 (97.2) | <0.001 | 44.4 (35.2) | 56.1 (40.7) | 11.8 (56.1) | 0.08 | 51.7 (25.8 to 77.5) | <0.001 |
Note: Values expressed as mean (SD) unless otherwise stated. Between‐group differences reported as mean difference (95% confidence interval).
Abbreviations: DF, dietary fiber; FA, fatty acids; IP, ideal protein; LFLC, low‐fat low‐calorie; MUFA, monounsaturated fatty acids; PUFA, polyunsaturated fatty acids; SFA, saturated fatty acids.
3.4. Serum lipid levels
At 3 months, serum levels of total cholesterol decreased significantly from baseline in the IP group (<0.01) but decreases from baseline achieved only borderline significance in the LCLF group (p = 0.06). The difference between diet groups was statistically significant (p = 0.05). While LDL cholesterol declined from baseline in both groups, neither reduction was statistically significant, nor was the between group difference. HDL cholesterol remained largely unchanged by the two dietary interventions. Triglycerides declined significantly from baseline in both diet groups but declined more in the IP group than in the LCLF group (p = 0.02).
3.5. Blood glucose and BP levels
Average levels of fasting glucose (FG) and HbA1 were significantly reduced from baseline values in each dietary intervention group. Although the decline in both FG and HbA1c was more pronounced in the IP group than in the LCLF group, the between group differences did not reach traditional levels of statistical significance at 3 months, with between group p values of 0.09 for FG, and 0.13 for HbA1c, respectively favoring the IP diet. Likewise, both systolic and diastolic BP declined significantly from baseline in both diet groups, however he between group differences were not statistically significant at 3 months, with between group p values of 0.06 and 0.08, respectively, favoring the IP diet group.
Sensitivity analyses with missing values imputed using multiple imputation techniques found similar results, specifically that the participants assigned to the IP group lost significantly more weight than the LCLF group. There were no serious adverse events reported during the study intervention or follow‐up period.
4. DISCUSSION
In this 3‐month randomized controlled trial of the IP system as compared to a guideline‐based LCLF dietary behavioral intervention, the IP system resulted in significantly greater weight loss among men and women with obesity and additional risk factors for CVD. While both diets resulted in improvements from baseline in a number of cardiometabolic risk factors, compared to the LCLF diet group, the IP group experienced greater improvements in waist and hip circumference, total cholesterol and triglycerides. Given that CVD is the leading cause of death in the United States, understanding the impact of dietary weight loss strategies on cardiometabolic risk factors is critical for prevention, particularly among men and women with obesity and at high risk of CVD due to the presence of co‐morbid conditions. Evidence from this study suggests that the IP system is both efficacious and safe for weight loss among individuals with obesity and additional risk factors for CVD.
More than half of American adults have at least one chronic condition and approximately at nearly a third have two or more chronic conditions, with some of the most common among them being risk factors for heart disease like hypertension and hyperlipidemia. 16 , 17 In 2017, the term adiposity‐based chronic disease (ABCD) was introduced jointly by the American Association of Clinical Endocrinologists and the American College of Endocrinology, 18 in part to focus attention on the paradigm of obesity as a chronic disease state which then leads to specific and predictable complications, including for example, Type 2 diabetes. Changes in lifestyle focused on dietary calorie reduction and increases in energy expenditure via physical activity are the first line strategy to reduce obesity and its complications. Therefore, evidence of efficacy and safety of readily available commercial programs for weight loss is important, and specifically called for in clinical practice guidelines. 5
These study results are consistent with other studies that have examined dietary behavioral programs which include reductions in carbohydrate consumption and a focus on high quality protein intake. 19 , 20 In the current study, great variability was observed in the response of participants to the control dietary behavioral intervention, with some participants experiencing more weight loss in the LCLF group than others. In contrast, the IP group had a less variable, more consistent response in terms of the magnitude of weight lost. A number of factors may have contributed to the variability of weight loss in the guideline based LCLF group. This may have been influenced by the timing of dietary behavioral counselling which occurred weekly in 15‐min sessions for those in the IP group, whereas those in the LCLF group had individual weekly counselling for 1 h in the first month, then met in group sessions for 1 h of counseling every 2 weeks thereafter. Although supplemental foods were provided to both groups to support dietary adherence, foods provided to the IP group were formulated and portioned specifically for the more prescriptive intervention, whereas those provided to the LCLF group were typical of foods purchased off the shelf in a commercial supermarket. The latter foods are not always provided in single serving portions (e.g., whole grain pasta) and may require additional effort on the part of the individual to ensure that only a single serving is consumed. They may also require additional preparatory steps, on average compared to those formulated specifically for the IP diet. Indeed, studies comparing commercial weight loss programs to dietary behavioral counselling in health care provider settings have identified superior weight loss and cardiometabolic benefit from the use of commercial programs. 21 , 22
This study has a number of strengths. These include a large sample size, low attrition rate, the provision of foods to each group to increase adherence to the dietary intervention, a standardized guideline based LCLF control arm which used materials that were successful for weight loss in a previous study, 13 and a substantial proportion of minority participants which may improve generalizability. In addition, all data were collected by trained and certified staff using rigorous quality control protocols. There are also some limitations such as a short study duration, self‐report measures of physical activity and dietary intake which are subject to issues of memory and recall, and study dieticians who were not blinded to the hypothesis. Observers who conducted anthropometric measures and blood pressure were blinded to study group assignment. In addition, a number of statistical tests were performed in primary analysis so statical significance levels should be interpreted with caution.
In conclusion, this 3‐month randomized, parallel group trial showed that the IP system resulted in greater weight loss and reduction in several CVD risk factors than a guideline‐based LCLF dietary behavioral intervention among black and white adults with obesity and additional CVD risk factors. Thus, the IP system appears to be a safe and efficacious way to lose weight and reduce CVD risk factors among men and women with obesity and additional CVD risk factors. Further research is warranted to examine outcomes over the longer term.
CONFLICT OF INTERESTS
Dr. Fernandez and Ms. Potts have nothing to disclose. Dr. Bazzano has served in a consulting capacity for Glanbia Nutrition and Jazz Pharmaceuticals, and has received an honorarium from Sabra Dipping Co. LLC.
Supporting information
Supporting Information S1
ACKNOWLEDGMENTS
Funding was provided by a grant from Laboratories COP Inc, Quebec, Canada to Tulane University, School of Public Health and Tropical Medicine. The study authors do not have a consulting relationship or other financial relationship with Laboratories COP Inc. or Ideal Protein. The study protocol and statistical analysis plan are available from the authors by request.
Fernandez CA, Potts K, Bazzano LA. Effect of ideal protein versus low‐fat diet for weight loss: a randomized controlled trial. Obes Sci Pract. 2022;8(3):299‐307. 10.1002/osp4.567
REFERENCES
- 1. Kochanek KD, Xu JQ, Arias E. Mortality in the United States, 2019. In: NCHS Data Brief, no 395. National Center for Health Statistics; 2020. [PubMed] [Google Scholar]
- 2. National Heart, Lung, Blood Institute, National Institute of Diabetes, Digestive, Kidney Diseases (US) . Clinical Guidelines on the Identification, Evaluation, and Treatment of Overweight and Obesity in Adults: The Evidence Report. National Heart, Lung, and Blood Institute; 1998. [Google Scholar]
- 3. Nordmann AJ, Nordmann A, Briel M, et al. Effects of low‐carbohydrate vs low‐fat diets on weight loss and cardiovascular risk factors: a meta‐analysis of randomized controlled trials. Arch Intern Med. 2006;166:285‐293. [DOI] [PubMed] [Google Scholar]
- 4. McCombie L, Lean ME, Haslam D, Counterweight Research Group . Effective UK weight management services for adults. Clin Obes. 2012;2:96‐102. [DOI] [PubMed] [Google Scholar]
- 5. Jensen MD, Ryan DH, Apovian CM, et al. 2013 AHA/ACC/TOS guideline for the management of overweight and obesity in adults: a report of the American College of Cardiology/American Heart Association Task Force on practice guidelines and the obesity society. J Am Coll Cardiol. 2014;63:2985‐3023. [DOI] [PubMed] [Google Scholar]
- 6. Schaefer EJ, Lichtenstein AH, Lamon‐Fava S, et al. Efficacy of a National Cholesterol Education Program Step 2 diet in normolipidemic and hypercholesterolemic middle‐aged and elderly men and women. Arterioscler Thromb Vasc Biol. 1995;15:1079‐1085. [DOI] [PubMed] [Google Scholar]
- 7. Fuller N, Williams K, Shrestha R, et al. Changes in physical activity during a weight loss intervention and follow‐up: a randomized controlled trial. Clin Obes. 2014;4:127‐135. [DOI] [PMC free article] [PubMed] [Google Scholar]
- 8. Xu Z, Geng J, Zhang S, et al. A mobile‐based intervention for dietary behavior and physical activity change in individuals at high risk for type 2 diabetes mellitus: randomized controlled trial. JMIR MHealth UHealth. 2020;8:e19869. [DOI] [PMC free article] [PubMed] [Google Scholar]
- 9. Tapsell LC, Lonergan M, Batterham MJ, et al. Effect of interdisciplinary care on weight loss: a randomised controlled trial. BMJ Open. 2017;7:e014533. [DOI] [PMC free article] [PubMed] [Google Scholar]
- 10. Pickering TG, Hall JE, Appel LJ, et al. Recommendations for blood pressure measurement in humans and experimental animals: part 1: blood pressure measurement in humans: a statement for professionals from the Subcommittee of Professional and Public Education of the American Heart Association Council on High Blood Pressure Research. Circulation. 2005;111:697‐716. [DOI] [PubMed] [Google Scholar]
- 11. Allain CC, Poon LS, Chan CS, Richmond W, Fu PC. Enzymatic determination of total serum cholesterol. Clin Chem. 1974;20:470‐475. [PubMed] [Google Scholar]
- 12. Friedewald WT, Levy RI, Fredrickson DS. Estimation of the concentration of low‐density lipoprotein cholesterol in plasma, without use of the preparative ultracentrifuge. Clin Chem. 1972;18:499‐502. [PubMed] [Google Scholar]
- 13. Bazzano LA, Hu T, Reynolds K, et al. Effects of low‐carbohydrate and low‐fat diets: a randomized trial. Ann Intern Med. 2014;161:309‐318. [DOI] [PMC free article] [PubMed] [Google Scholar]
- 14. Samaha FF, Iqbal N, Seshadri P, et al. A low‐carbohydrate as compared with a low‐fat diet in severe obesity. N Engl J Med. 2003;2003:2074‐2081. [DOI] [PubMed] [Google Scholar]
- 15. Willems AE, Sura‐de Jong M, van Beek AP, Nederhof E, van Dijk G. Effects of macronutrient intake in obesity: a meta‐analysis of low‐carbohydrate and low‐fat diets on markers of the metabolic syndrome. Nutr Rev. 2021;79:429‐444. [DOI] [PMC free article] [PubMed] [Google Scholar]
- 16. Boersma P, Black LI, Ward BW. Prevalence of multiple chronic conditions among US adults. Prev Chronic Dis. 2018;17:E106. [DOI] [PMC free article] [PubMed] [Google Scholar]
- 17. Waters H, Graf M. The Costs of Chronic Disease in the US. The Milken Institute; 2018. [Google Scholar]
- 18. Mechanick JI, Hurley DL, Garvey WT. Adiposity‐based chronic disease as a new diagnostic term: the American Association of Clinical Endocrinologists and American College of Endocrinology position statement. Endocr Pract. 2017;23:372‐378. [DOI] [PubMed] [Google Scholar]
- 19. Gardner CD, Kiazand A, Alhassan S, et al. Comparison of the Atkins, Zone, Ornish, and LEARN diets for change in weight and related risk factors among overweight premenopausal women: the A TO Z Weight Loss Study: a randomized trial. J Am Med Assoc. 2007;297:969‐977. [DOI] [PubMed] [Google Scholar]
- 20. Johnstone AM. Safety and efficacy of high‐protein diets for weight loss. Proc Nutr Soc. 2012;71:339‐349. [DOI] [PubMed] [Google Scholar]
- 21. Jebb SA, Ahern AL, Olson AD, et al. Primary care referral to a commercial provider for weight loss treatment versus standard care: a randomised controlled trial. Lancet. 2011;378:1485‐1492. [DOI] [PMC free article] [PubMed] [Google Scholar]
- 22. Foster GD, Borradaile KE, Vander Veur SS, et al. The effects of a commercially available weight loss program among obese patients with type 2 diabetes: a randomized study. Postgrad Med. 2009;121:113‐118. [DOI] [PubMed] [Google Scholar]
Associated Data
This section collects any data citations, data availability statements, or supplementary materials included in this article.
Supplementary Materials
Supporting Information S1