

Abstract
Electronic cigarette (ECIG) nicotine delivery and other effects can be influenced by device and/or liquid characteristics as well as user puffing behavior. One class of ECIG models includes “sub-ohm” devices that incorporate heating coils with resistance <1 ohm (Ω), lower than that observed in conventional devices (e.g., ≥1.5Ω). Relative to conventional ECIGs that operate at ≤10W, low resistance coils can be used to increase device power (e.g., 40–300W). However, little is known about the individual and combined effects of ECIG power, manipulated by coil resistance, and liquid nicotine concentration on ECIG acute effects. Thirty-two experienced ECIG users completed four sessions that differed by ECIG power/coil resistance (40.5W; 0.5Ω or 13.5W;1.5Ω), and liquid nicotine concentration (3 or 8 mg/ml). In each session, participants used a 4.5V “Kanger SUBOX” in a 10-puff directed (30 sec IPI) and 60-minute ad libitum bout. Nicotine delivery, heart rate, subjective effects, puff topography, and liquid consumption were measured. Nicotine delivery was greatest in the 8 mg/ml+0.5Ω condition and lowest in the 3 mg/ml+1.5Ω condition. The greatest reduction in abstinence symptoms were observed in the 8 mg/ml+0.5Ω condition although the highest ratings for pleasantness, satisfaction, and liking were reported in the 3 mg/ml+0.5Ω condition. Overall, use of ECIGs containing 3 mg/ml nicotine liquid resulted in longer/larger puffs and increased puff frequency though high power/low resistance ECIGs resulted in greater consumption of ECIG liquid. ECIG power/coil resistance, liquid nicotine concentration and user puff topography should be considered simultaneously when making regulatory decisions aimed at protecting public health.
Keywords: electronic cigarettes, e-cig nicotine delivery, heating coil resistance, sub-ohm
Electronic cigarettes (ECIGs) are an increasingly popular and diverse category of tobacco products (Gentzke et al., 2019; Wang et al., 2018). ECIGs generally contain a power source such as a battery, an electrical heating coil, and a reservoir that contains a liquid solution typically composed of solvents (propylene glycol [PG] and vegetable glycerin [VG]), flavorants, and nicotine (Breland et al., 2017; Etter, 2012). Despite common features, ECIG device and liquid characteristics vary widely, which contributes to variability in nicotine delivery, subjective experience, and abuse potential across devices (e.g., Harvanko, Kryscio, Martin, and Kelly, 2019; Hiler et al., 2017; Spindle et al., 2018; Wagener et al., 2017). Therefore, further evaluation of ECIG device and liquid characteristics that can influence nicotine delivery and mediate the development of nicotine dependence will be important for informing regulatory decisions.
ECIG associated nicotine delivery and subjective effects are influenced by ECIG liquid constituents, user puffing behavior and device characteristics. Importantly, many of these factors are user controlled, particularly in open-system ECIG models that allow users to manipulate liquid constituents and device characteristics. Higher concentration nicotine liquids correspond with greater nicotine delivery to users (Dawkins et al., 2016; Hiler et al., 2017) and more pronounced reductions in nicotine abstinence symptoms (Hiler et al., 2017). Also, higher proportions of PG in ECIG liquids result in greater nicotine delivery to users (Spindle et al., 2018) and PG:VG ratio can influence sensory experience (Harvanko et al., 2019). Further, the larger and longer puffs taken by experienced ECIG users correspond with greater nicotine delivery relative to the shorter and smaller puffs taken by ECIG-naïve cigarette smokers (Farsalinos et al., 2015; Hiler et al., 2017). ECIG device power (measured in watts; W) also influences nicotine delivery. Recent data from a small sample of experienced ECIG users, who provided their own device and liquid, indicate that high power ECIGs (~71W) deliver significantly more nicotine to users relative to low power ECIGs (~9W), even when paired with low nicotine concentration liquids (~ 4 mg/ml; Wagener et al., 2017). ECIG power (P) is a function of voltage (V) and heating coil resistance (ohms or Ω) such that P=V2/R. Notably, a common method for users to increase device power involves decreasing the resistance of the heating coil (Etter, 2016; Soar, Kimber, McRobbie, & Dawkins, 2019; Yingst, Foulds, Veldheer & Du, 2018; Wagener et al., 2017).
Many ECIG models use heating coils with resistance that is ≥ 1.5Ω but one category of ECIG models includes “sub-ohm” devices that use heating coils < 1Ω. Due to the inverse relationship between device power and coil resistance, these “sub-ohm” devices can operate at high power (e.g., 40–300W) relative to conventional devices that typically operate at less than 10W (Breland et al., 2017; Krielgel, 2015; Talih et al., 2017a; Wagener et al., 2017). Anecdotal reports suggest that low resistance, “sub-ohm” ECIGs can influence user subjective experience by producing a warmer “vapor” (i.e., aerosol), larger “cloud” (i.e., more aerosol), greater “throat-hit”, and more intense flavor relative to ECIGs with higher resistance coils (Wang, 2016). Despite the reported use of these low resistance/high power ECIGs (i.e., “sub-ohm” devices; Etter, 2016; Soar et al., 2019; Yingst et al., 2018; Wagener et al., 2017), few studies have investigated systematically how manipulations of device power, via coil resistance, can influence outcomes predictive of dependence (i.e., user plasma nicotine concentration and subjective experience) and no published studies have examined user puff topography when using low resistance/high power ECIGs. In addition, the interactive effects of device characteristics and liquid nicotine concentration have not been examined in a systematic manner, even though these features commonly are manipulated simultaneously by users. Therefore, the aim of this clinical laboratory study was to examine systematically, using a 2 × 2 factorial study design, the individual and combined effects of ECIG power, manipulated by coil resistance (0.5Ω; 40.5W or 1.5Ω; 13.5W) and liquid nicotine concentration (3 or 8 mg/ml) on nicotine delivery, heart rate (HR), subjective effects, puff topography, and ECIG liquid consumption.
METHOD
Participants.
This study was approved by Virginia Commonwealth University’s (VCU) Institutional Review Board. Community volunteers were eligible to participate if they were healthy, 18–55 years of age, weighed ≥ 110 pounds (to maximize participant safety during blood sampling; VCU IRB: HHS 45 CFR§ 46.110; FDA 21 CFR§ 56.110) if they reported currently using < 5 tobacco cigarettes daily and other tobacco products ≤ 3 times per week (as in Vansickel & Eissenberg, 2013) and if they were experienced ECIG users meaning: they reported use of ≥ 1 ml of ECIG liquid daily, use of an ECIG liquid nicotine concentration ≥ 3 mg/ml, and had been using their ECIG for ≥ 3 months (similar to Spindle et al., 2018). Participants were excluded if they reported: history of chronic disease or psychiatric condition, regular use of a prescription medication (aside from birth control and/or vitamins), marijuana use > 10 and alcohol use > 25 days in the past 30, or past 30 day use of any illicit drugs. Also, to control for flavor novelty, individuals who listed the specific study ECIG liquid flavor as one of their top five preferred flavors were excluded (similar to Buchhalter et al., 2005). During screening individuals were eligible if they provided a semi-quantitative urine cotinine test result ≥ 3, thereby verifying recent nicotine use (see Acosta et al., 2004). For women, a positive pregnancy test (by urinalysis) at screening was exclusionary.
Of the 38 individuals who provided informed consent for this study, data from six were not included in the final analyses: two were ineligible during in-person screening (one for prescription medication use and one for urinary cotinine test indicating no regular nicotine use) and the remaining four were discontinued prior to study completion (two failed to attend study sessions and two lacked venous access). Therefore, 32 experienced ECIG users (8 women; 19 White/Caucasian) completed the study and their demographic and ECIG/tobacco use characteristics are included in Table 1.
Table 1.
Demographic characteristics for 32 experienced ECIG users.
| Mean or N | SD or % | |
|---|---|---|
| Number Female | 8 | 25.0 % |
| Number Caucasian | 19 | 59.4 % |
| Age (years) | 25.6 | 7.1 |
| CO at screening | 2.2 | 1.8 |
| Duration ECIG use (years) | 2.6 | 1.5 |
| Volume ECIG liquid used/day (ml) | 4.8 | 5.4 |
| Liquid nicotine concentration (mg/ml)a | 27.3 | 25.5 |
| Number indicating current use of a ‘sub-ohm’ device | 17 | 53.1 % |
| Number indicating ever use of a ‘sub-ohm’ device | 21 | 65.6 % |
| Current cigarettes/dayb | 0.1 | 0.3 |
| Number of former smokers | 27 | 84.4 % |
| Past number of cigarettes/dayc | 9.1 | 8.7 |
| Months abstinent from cigarettesc | 22.9 | 20.5 |
| E-cigarette Dependence Scaled | 1.9 | 0.8 |
| Fagerström TNDe | 4.6 | 2.0 |
Mean (SD) liquid nicotine concentration for 32 experienced ECIG users. Of these individuals, 12 reported current, exclusive use of “sub-ohm” ECIGs with a mean liquid nicotine concentration of 8.5 mg/ml (SD=8.0); 10 reported current, exclusive use of pod-style ECIGs (e.g., Juul, Suorin) with a mean liquid nicotine concentration of 55.2 mg/ml (SD=8.8); 10 reported current use of multiple ECIGs with a mean liquid nicotine concentration of 27.1 mg/ml (SD=26.6).
Data from two participants who reported current cigarette smoking and reported smoking one cigarette daily.
Data from 25 participants who are former cigarette smokers but are not current smokers.
The E-cigarette Dependence scale (4-item version) with scores ranging from 0-lowest to 4-highest (Morean et al., 2018).
The Fagerström Test for Nicotine Dependence (FTND) was modified to include the word e-cigarette. FTND scores range from 0–10 and the mean scores of 4.6 (SD=2.0) reported in the present study indicate low to moderate dependence (Heatherton et al., 1991).
Materials
In each experimental session, participants used a “Kangertech SUBOX” ECIG battery attached to a “Subtank mini” tank (Kangertech, Shenzhen, China, purchased March 9, 2018). The SUBOX was selected based on recommendation by a local ECIG vendor (AVAIL Vapor, Richmond, VA) and after preliminary testing revealed that, under some conditions, the nicotine emissions of the device approached that of a tobacco cigarette. Across conditions, the ECIG differed by the resistance of the coil attached: 0.5Ω or 1.5Ω. By manipulating ECIG coil resistance, device power varied across conditions: 40.5W in the 0.5Ω condition and 13.5W in the 1.5Ω condition. Notably, the wattages used (13.5 and 40.5W) were within the optimal operating ranges suggested by the manufacturer (i.e., Kangertech) for each respective coil resistance (1.5Ω and 0.5Ω). All coils (stainless steel organic cotton) were verified using a Coil Master 521 TAB v2 ohm meter and coils were included if they were within ± 0.1Ω of the labeled resistance (an allowable deviation reflecting reading measurement error of the ohm meter; as in Spindle et al., 2018).
The “Subtank mini” tank was pre-filled with 3.5 ml of ECIG liquid comprised of 30% PG: 70% VG in Honeydew Pear flavor; flavor and PG:VG ratio were identical across sessions. The 30% PG: 70% VG ratio was chosen as ECIG liquids containing high proportion VG are preferred among ECIG users (Yingst et al., 2018; Harvanko et al., 2018; Li et al., 2016), and are recommended by manufacturers for use with “sub-ohm” devices (Misthub, 2015; Freeman Vape Juice, 2018). Honeydew Pear flavor was selected because fruit is a commonly preferred liquid flavor (e.g., Farsalinos et al., 2013; Soneji et al., 2019) and Honeydew pear was uncommon enough to be a novel flavor for participants in the study. Depending on the study condition, liquid nicotine concentration was either 3 mg/ml or 8 mg/ml free-base nicotine liquid (AVAIL Vapor, Richmond, VA, Batch # 18100141A-1, purchased March 9, 2018) and nicotine concentrations were verified prior to administration at VCU (as in Hiler et al., 2017; Lopez et al., 2016; Maloney et al., 2019; Spindle et al., 2018). Finally, prior to the start of each study session, the cotton wick contained within each coil was saturated with ECIG liquid, as recommended by the product manufacturer (i.e., Kangertech) and online ECIG vendors (Spring, 2016).
Procedure.
Participants completed four, approximately ~3.5-hour laboratory sessions that were separated by a minimum of 48 hours. Sessions were ordered by Latin square and participants were blinded to study condition. Participants were instructed to abstain from nicotine/tobacco/ECIG use for ≥ 12 hours prior to each session. Abstinence from combustible tobacco was confirmed via participants’ expired air CO (≤ 7 ppm), and abstinence from ECIGs was confirmed retrospectively using a criterion of plasma nicotine concentration ≤ 5 ng/ml at baseline (as in Hiler et al., 2017; Spindle et al., 2017, 2018). Due to previously documented non-compliance with pre-session ECIG/nicotine abstinence among experienced ECIG users (Hiler et al., 2017; Spindle et al., 2018), the present study also included a one-hour, pre-session observation period during which nicotine/tobacco use was prohibited (as in Spindle et al., 2018) and a bogus pipeline saliva test was administered (as in Donny & Jones, 2009; Rose & Behm, 1991) in an effort to improve participant compliance with abstinence requirements. Upon study completion, inspection of baseline plasma nicotine concentrations indicated that three study completers were considered to not have abstained prior to at least one experimental session (one participant did not abstain prior to one of four sessions, one did not abstain prior to two study sessions and the remaining participant did not abstain prior to three of four sessions); data from these three participants were included in final analysis as study results were unaffected by their exclusion and their inclusion in analysis improved statistical power.
In each experimental session, participants first completed a 10-puff directed ECIG-use bout (with 30-sec inter-puff interval [IPI]) and then a 60 minute ad libitum (i.e., unrestricted ECIG use) bout. The two bouts were separated by 60 minutes. An intravenous catheter was used to sample 7 ml of blood six times per session: 5 min before and 5 min after the onset of the directed bout and 5 min before and 20, 40, and 60 min after the onset of the ad libitum bout. Subjective questionnaires were administered immediately after each blood sample was taken. Physiological recording of HR and blood pressure occurred throughout each session.
Outcome Measures
Physiological Measures.
All blood samples were centrifuged and the plasma stored at - 80°C, and analyzed for nicotine concentration at VCU using LC-MS/MS (limit of quantitation; LOQ = 2 ng/ml; see Breland et al., 2006). HR was monitored continuously in each session using Criticare Systems model 507 (Waukesha, WI).
Subjective effects.
Six questionnaires were administered at various timepoints during the study. Nicotine/tobacco abstinence symptoms were assessed using the Hughes-Hatsukami withdrawal scale (11 items, see Table 2; Hughes and Hatsukami, 1986) and the Questionnaire of Vaping Craving. Nicotine-related effects were examined using the Direct Effects of Nicotine scale (see Table 2; omitting “Dizzy” from the original to reduce redundancy with other scales). ECIG-specific effects were assessed using a modified version of the Direct Effects of ECIG-Use scale (see Table 2; adapted from Pickworth et al., 1994; Foulds et al., 1992). In addition to the original 10 items, four additional items were included to assess aerosol/cloud production (Farsalinos et al., 2017) smell of aerosol (Morean et al., 2019) and similarity of puffs to participants’ own brand ECIG. The intensity of ECIG-related sensations (e.g., harshness/irritancy) was assessed using the general Labeled Magnitude Scale (gLMS, see Table 2; Rosbrook and Green, 2016) and hedonic ratings indicating liking/disliking of ECIG-related sensations were assessed using the Labeled Hedonic Scale (LHS; Lim et al., 2009).
Table 2.
Statistical Analyses Results for Physiological and Subjective Measures.
| Outcome measures | Nicotine (N) | Resistance (R) | Time (T) | N × R | N × T | R × T | N × R × T | ||||||||||||||
|---|---|---|---|---|---|---|---|---|---|---|---|---|---|---|---|---|---|---|---|---|---|
| F | p | η2p | F | p | η2p | F | p | η2p | F | p | η2p | F | p | η2p | F | p | η2p | F | p | η2p | |
| Plasma Nicotine a | 17.7 | <.001 | 0.36 | 14.5 | <.01 | 0.32 | 41.6 | <.001 | 0.57 | 0.18 | ns | 0.01 | 3.09 | ns | 0.10 | 5.55 | <.01 | 0.15 | 0.50 | ns | 0.02 |
| Heart Rate a | 0.23 | ns | 0.01 | 5.12 | <.05 | 0.14 | 55.0 | <.001 | 0.64 | 1.06 | ns | 0.03 | 1.32 | ns | 0.04 | 2.88 | <.05 | 0.09 | 1.36 | ns | 0.04 |
| Subjective Measures | |||||||||||||||||||||
| Hughes-Hatsukamia | |||||||||||||||||||||
| Anxious | 1.03 | ns | 0.32 | 0.10 | ns | 0.00 | 28.3 | <.001 | 0.50 | 1.28 | ns | 0.04 | 0.42 | ns | 0.01 | 0.38 | ns | 0.12 | 1.53 | ns | 0.05 |
| Craving | 6.53 | <.05 | 0.17 | 1.25 | ns | 0.39 | 26.7 | <.001 | 0.46 | 2.34 | ns | 0.07 | 0.43 | ns | 0.01 | 0.53 | ns | 0.02 | 2.19 | ns | 0.07 |
| Depression | 5.55 | <.05 | 0.15 | 1.45 | ns | 0.05 | 6.30 | <.01 | 0.17 | 0.54 | ns | 0.02 | 1.10 | ns | 0.03 | 1.06 | ns | 0.03 | 0.14 | ns | 0.00 |
| Difficult Concentrating | 0.00 | ns | 0.00 | 1.01 | ns | 0.03 | 11.1 | <.001 | 0.26 | 1.00 | ns | 0.03 | 1.00 | ns | 0.03 | 0.83 | ns | 0.03 | 0.86 | ns | 0.03 |
| Drowsy | 0.31 | ns | 0.01 | 0.93 | ns | 0.03 | 10.7 | <.001 | 0.26 | 5.34 | <.05 | 0.15 | 1.40 | ns | 0.04 | 0.36 | ns | 0.01 | 1.63 | ns | 0.05 |
| Hunger | 3.04 | ns | 0.09 | 1.14 | ns | 0.04 | 7.30 | <.001 | 0.20 | 3.90 | ns | 0.11 | 0.70 | ns | 0.02 | 3.20 | <.01 | 0.09 | 0.50 | ns | 0.02 |
| Impatient | 0.14 | ns | 0.01 | 0.22 | ns | 0.01 | 11.3 | <.001 | 0.27 | 1.10 | ns | 0.03 | 0.40 | ns | 0.01 | 1.00 | ns | 0.03 | 0.70 | ns | 0.02 |
| Irritable | 0.06 | ns | 0.00 | 0.00 | ns | 0.00 | 20.4 | <.001 | 0.40 | 0.69 | ns | 0.02 | 0.60 | ns | 0.02 | 2.70 | ns | 0.08 | 1.16 | ns | 0.04 |
| Restless | 1.34 | ns | 0.04 | 1.62 | ns | 0.05 | 6.75 | <.001 | 0.18 | 1.34 | ns | 0.04 | 1.24 | ns | 0.04 | 0.90 | ns | 0.03 | 1.13 | ns | 0.04 |
| Sweets | 0.41 | ns | 0.01 | 2.1 | ns | 0.06 | 6.20 | <.001 | 0.17 | 0.22 | ns | 0.01 | 0.72 | ns | 0.02 | 0.76 | ns | 0.02 | 1.00 | ns | 0.03 |
| Urges | 8.92 | <.01 | 0.22 | 2.31 | ns | 0.07 | 31.2 | <.001 | 0.50 | 1.03 | ns | 0.32 | 0.71 | ns | 0.02 | 1.01 | ns | 0.03 | 2.50 | ns | 0.07 |
| Vaping Cravinga | |||||||||||||||||||||
| Craving Score | 4.57 | <.05 | 0.13 | 7.17 | <.05 | 0.19 | 36.4 | <.001 | 0.54 | 1.33 | ns | 0.04 | 1.76 | ns | 0.05 | 1.86 | ns | 0.06 | 1.26 | ns | 0.04 |
| Direct Effects of Nicotinea | |||||||||||||||||||||
| Confused | 0.30 | ns | 0.01 | 0.20 | ns | 0.01 | 1.78 | ns | 0.05 | 0.48 | ns | 0.02 | 0.74 | ns | 0.02 | 0.84 | ns | 0.03 | 0.09 | ns | 0.00 |
| Headache | 2.26 | ns | 0.07 | 0.02 | ns | 0.00 | 0.18 | ns | 0.00 | 1.87 | ns | 0.06 | 1.10 | ns | 0.03 | 1.40 | ns | 0.04 | 0.40 | ns | 0.01 |
| Heart Pound | 5.68 | <.05 | 0.16 | 0.91 | ns | 0.03 | 1.38 | ns | 0.04 | 0.46 | ns | 0.02 | 0.26 | ns | 0.01 | 1.87 | ns | 0.06 | 0.79 | ns | 0.03 |
| Lightheaded | 5.21 | <.05 | 0.14 | 3.22 | ns | 0.09 | 7.78 | <.001 | 0.20 | 0.01 | ns | 0.00 | 0.85 | ns | 0.03 | 4.58 | <.01 | 0.13 | 1.40 | ns | 0.04 |
| Nauseous | 1.58 | ns | 0.05 | 0.09 | ns | 0.00 | 1.76 | ns | 0.05 | 0.01 | ns | 0.00 | 0.23 | ns | 0.01 | 1.47 | ns | 0.05 | 0.26 | ns | 0.01 |
| Nervous | 1.28 | ns | 0.04 | 0.06 | ns | 0.00 | 8.23 | <.01 | 0.21 | 0.07 | ns | 0.00 | 0.42 | ns | 0.01 | 0.60 | ns | 0.02 | 0.59 | ns | 0.02 |
| Salivation | 1.25 | ns | 0.04 | 0.26 | ns | 0.01 | 1.71 | ns | 0.05 | 0.01 | ns | 0.00 | 0.15 | ns | 0.00 | 0.70 | ns | 0.02 | 0.60 | ns | 0.02 |
| Sweaty | 0.13 | ns | 0.00 | 0.26 | ns | 0.01 | 1.60 | ns | 0.05 | 1.41 | ns | 0.04 | 2.46 | <.05 | 0.07 | 0.51 | ns | 0.02 | 1.02 | ns | 0.03 |
| Weak | 1.70 | ns | 0.05 | 0.23 | ns | 0.01 | 0.51 | ns | 0.02 | 0.75 | ns | 0.02 | 0.33 | ns | 0.01 | 0.66 | ns | 0.02 | 1.56 | ns | 0.05 |
| Direct Effects of ECIG useb | |||||||||||||||||||||
| Awake | 0.31 | ns | 0.01 | 4.0 | ns | 0.10 | 3.13 | <.05 | 0.09 | 0.11 | ns | 0.00 | 0.03 | ns | 0.00 | 0.11 | ns | 0.00 | 1.75 | ns | 0.05 |
| Calm | 1.00 | ns | 0.03 | 2.84 | ns | 0.08 | 9.58 | <.001 | 0.24 | 0.00 | ns | 0.00 | 0.08 | ns | 0.00 | 0.03 | ns | 0.00 | 0.67 | ns | 0.02 |
| Concentrate | 0.40 | ns | 0.01 | 2.95 | ns | 0.09 | 2.79 | <.05 | 0.08 | 0.05 | ns | 0.00 | 0.28 | ns | 0.01 | 0.37 | ns | 0.01 | 0.60 | ns | 0.02 |
| Dizzy | 1.90 | ns | 0.06 | 5.00 | <.05 | 0.14 | 20.1 | <.001 | 0.40 | 0.12 | ns | 0.00 | 2.77 | ns | 0.08 | 3.79 | <.05 | 0.11 | 0.77 | ns | 0.02 |
| Pleasant | 16.7 | <.001 | 0.35 | 1.05 | ns | 0.03 | 0.48 | ns | 0.02 | 0.30 | ns | 0.01 | 0.51 | ns | 0.02 | 1.84 | ns | 0.06 | 1.11 | ns | 0.04 |
| Reduce Hunger | 0.02 | ns | 0.00 | 2.03 | ns | 0.06 | 0.55 | ns | 0.02 | 0.50 | ns | 0.02 | 1.83 | ns | 0.06 | 0.23 | ns | 0.01 | 0.41 | ns | 0.01 |
| Right Now | 9.41 | <.01 | 0.23 | 6.76 | <.05 | 0.18 | 14.4 | <.001 | 0.32 | 0.51 | ns | 0.02 | 0.38 | ns | 0.01 | 1.22 | ns | 0.04 | 1.29 | ns | 0.04 |
| Satisfying | 4.64 | <.05 | 0.13 | 4.63 | <.05 | 0.13 | 0.35 | ns | 0.01 | 1.62 | ns | 0.05 | 0.33 | ns | 0.01 | 0.74 | ns | 0.02 | 1.32 | ns | 0.04 |
| Sick | 0.40 | ns | 0.02 | 0.40 | ns | 0.01 | 2.40 | ns | 0.07 | 0.40 | ns | 0.01 | 1.10 | ns | 0.03 | 2.40 | ns | 0.07 | 0.43 | ns | 0.01 |
| Taste Good | 11.7 | <.01 | 0.28 | 0.90 | ns | 0.03 | 0.57 | ns | 0.02 | 0.15 | ns | 0.01 | 0.40 | ns | 0.01 | 2.77 | <.05 | 0.08 | 1.40 | ns | 0.04 |
| Smell of e-cigarette | 4.10 | ns | 0.14 | 3.50 | ns | 0.10 | 0.83 | ns | 0.03 | 0.22 | ns | 0.01 | 0.52 | ns | 0.02 | 0.50 | ns | 0.02 | 0.90 | ns | 0.03 |
| Puffs Similar | 8.07 | <.01 | 0.21 | 1.30 | ns | 0.04 | 2.27 | ns | 0.10 | 1.62 | ns | 0.05 | 0.66 | ns | 0.02 | 1.28 | ns | 0.04 | 0.23 | ns | 0.01 |
| Visible Vapor/Cloud | 4.10 | ns | 0.12 | 12.2 | <.01 | 0.28 | 2.69 | ns | 0.08 | 2.46 | ns | 0.07 | 3.02 | ns | 0.09 | 1.04 | ns | 0.03 | 2.79 | <.05 | 0.08 |
| Importance Vapor/Cloud | 2.80 | ns | 0.13 | 0.25 | ns | 0.01 | 0.31 | ns | 0.01 | 0.70 | ns | 0.02 | 0.77 | ns | 0.02 | 0.94 | ns | 0.03 | 1.63 | ns | 0.05 |
| Gen. Labeled Magnitudec | |||||||||||||||||||||
| Flavor | 0.08 | ns | 0.00 | 16.5 | <.001 | 0.36 | 2.13 | ns | 0.07 | 0.68 | ns | 0.02 | 0.40 | ns | 0.01 | 0.81 | ns | 0.03 | 0.30 | ns | 0.01 |
| Harshness/Irritancy | 43.8 | <.001 | 0.59 | 1.20 | ns | 0.04 | 0.14 | ns | 0.01 | 0.19 | ns | 0.00 | 6.56 | <.05 | 0.20 | 0.64 | ns | 0.02 | 1.93 | ns | 0.06 |
| Throat Hit | 61.9 | <.001 | 0.67 | 10.4 | <.01 | 0.25 | 1.40 | ns | 0.04 | 0.23 | ns | 0.01 | 6.53 | <.05 | 0.17 | 1.02 | ns | 0.03 | 0.31 | ns | 0.01 |
| Warmth | 11.1 | <.01 | 0.30 | 29.3 | <.001 | 0.49 | 1.09 | ns | 0.03 | 0.01 | ns | 0.00 | 0.81 | ns | 0.03 | 0.56 | ns | 0.02 | 5.00 | <.05 | 0.14 |
| Labeled Hedonic Scalec | |||||||||||||||||||||
| Flavor | 6.66 | <.05 | 0.20 | 0.76 | ns | 0.02 | 0.09 | ns | 0.00 | 0.02 | ns | 0.00 | 0.21 | ns | 0.01 | 2.44 | ns | 0.07 | 0.00 | ns | 0.00 |
| Harshness/Irritancy | 13.2 | <.01 | 0.30 | 0.42 | ns | 0.01 | 0.81 | ns | 0.03 | 0.18 | ns | 0.01 | 3.50 | ns | 0.10 | 1.10 | ns | 0.03 | 1.00 | ns | 0.03 |
| Throat Hit | 6.39 | <.05 | 0.17 | 1.38 | ns | 0.04 | 0.00 | ns | 0.00 | 0.86 | ns | 0.03 | 12.5 | <.01 | 0.29 | 0.16 | ns | 0.01 | 1.20 | ns | 0.03 |
| Warmth | 6.63 | ns | 0.11 | 3.12 | ns | 0.10 | 0.38 | ns | 0.01 | 1.88 | ns | 0.06 | 0.05 | ns | 0.00 | 0.43 | ns | 0.01 | 4.44 | <.05 | 0.13 |
Note: Significant items are presented in bold; ns = not significant.
df N = (1, 31); df R = (1, 31); df T (5,155); df N × R (1, 31); df N × T (5,155); df R × T (5,155); df N × R × T (5,155).
df N = (1, 31); df R = (1, 31); df T (4,124); df N × R (1, 31); df N × T (4,124); df R × T (4,124); df N × R × T (4,124).
df N = (1, 31); df R = (1, 31); df T (1, 31); df N × R (1, 31); df N × T (1, 31); df R × T (1, 31); df N × R × T (1, 31).
Three questionnaires, the Hughes and Hatsukami, Direct Effects of Nicotine, and Direct Effects of ECIG-Use, were administered using a computerized visual analog scale (VAS) that consisted of a word or phrase centered on a horizontal line with “not at all” on the left and “extremely” on the right. Participants recorded their responses by clicking a mouse cursor onto any point on the horizontal line, and scores were expressed as a percentage of total line length (0–100). Items from the Questionnaire of Vaping Craving were presented on a 7-point Likert scale (0-Strongly disagree to 7-Strongly agree) and averaged for a single craving score (Dowd, Courtney, Motschman, & Tiffany, 2018). The gLMS was administered using a category-ratio scale containing seven semantic labels ranging from 0 (no sensation) to 100 (strongest imaginable sensation of any kind). Similarly, the LHS was administered using a category-ratio scale containing ten semantic labels ranging from 0 (most disliked sensation imaginable) to 100 (most liked sensation imaginable). All participants received training in the use of the questionnaires and scales prior to the first study session.
Puff topography.
Puff topography was measured during each ECIG use bout using a mouthpiece-based topography recording device, developed and manufactured for use with ECIGs at the American University of Beirut (see Spindle et al., 2015, 2017). Puff topography variables included: puff duration, volume, flow rate, and number, as well as IPI. Prior to each study session, the topography device was calibrated using an automatic digital flow calibrator.
Amount of ECIG liquid consumed.
ECIG liquid consumption was recorded by weighing the ECIG pre and post each ECIG-use bout. The difference between the pre and post ECIG mass represented the mass of liquid consumed (grams) for each bout. The volume of liquid consumed (milliliters) per bout was computed by dividing the mass consumed by the liquid density.
Data Preparation and Analysis
Plasma nicotine values below the LOQ were replaced with the LOQ of 2 ng/ml as this is a more conservative approach compared to identifying each value below LOQ as zero (as in Lopez et al., 2016; Maloney et al., 2019; Spindle et al., 2018;; Vansickel et al., 2010). Prior to analysis, HR data were averaged for the five minutes during the directed bout and for the five minutes prior to every blood sampling episode. For puff topography, two or more puffs separated by ≤ 100 ms were combined into a single puff and any puffs ≤ 300 ms were deleted. Data for each puff topography variable were averaged for each participant to produce a single value for each bout. A malfunction of the topography recording device resulted in incomplete data for one participant out of the 32 completers who were included in all other analyses.
Three-factor repeated measures analysis of variance (ANOVA) with resistance/power (0.5Ω; 40.5W or 1.5Ω; 13.5W), nicotine (3 or 8 mg/ml) and time as within subjects factors were conducted for plasma nicotine (6 levels of time), HR (6 levels of time), topography and liquid consumed (2 levels of time). Subjective data also had 6 levels of time except for the Direct Effects of ECIG-Use scale (5 levels of time; omitting the baseline timepoint as participants had not sampled the ECIG at baseline) and the gLMS and LHS (2 levels of time; immediately at the conclusion of each bout). Separate ANOVAs were conducted to examine each subjective item individually (except for the Questionnaire of Vaping Craving). Huynh-Feldt corrections were used to adjust for potential violations of sphericity (Huynh & Feldt, 1976). For all outcome measures, within-subject comparisons from baseline and across conditions were made using Tukey’s Honestly Significant Difference (HSD) test to compare all possible pairs of means (Tukey, 1949). For comparisons across conditions, mean values for each outcome were compared across conditions at the timepoints immediately after bout 1 (timepoint 2) and the timepoints during the ad libitum bout (e.g., timepoints 4, 5, and 6). Statistical analyses were performed using IBM SPSS (Version 24.0).
RESULTS
Results from all outcome measures are described below. Table 2 displays results from the statistical analyses (main effects and interactions) for plasma nicotine, HR, and subjective measures.
Plasma Nicotine
A significant resistance by time interaction was observed for plasma nicotine, in addition to main effects of nicotine, resistance, and time. Figure 1 depicts mean plasma nicotine results for each condition and timepoint. Post-hoc testing (Tukey’s HSD) indicated that mean plasma nicotine concentrations increased significantly from baseline following the 10-puff bout and at the conclusion of the ad libitum bout for all conditions, except 3 mg/ml+1.5Ω. For the 8 mg/ml+0.5Ω condition, mean (SD) plasma nicotine concentrations increased from 2.7 ng/ml (2.6) at baseline to 10.2 ng/ml (8.2) following the 10-puff bout and to 15.4 ng/ml (11.7) at the conclusion of the ad libitum bout. For the 3 mg/ml+0.5Ω condition, mean (SD) plasma nicotine concentrations increased from 2.5 ng/ml (1.5) at baseline to 7.0 ng/ml (5.0) following the 10-puff bout and to 13.2 ng/ml (11.0) at the conclusion of the ad libitum bout. For the 8 mg/ml+1.5Ω condition, mean (SD) plasma nicotine concentration increased from 2.5 ng/ml (1.9) at baseline to 7.1 ng/ml (8.7) following the 10-puff bout and to 11.4 ng/ml (8.5) at the conclusion of the ad libitum bout (Tukey’s HSD, ps < .05). For the 3mg/ml+1.5Ω condition, there were no significant increases in plasma nicotine concentration immediately following the 10-puff bout, though plasma nicotine concentrations increased significantly from 2.5 ng/ml (1.5) at baseline to 7.7 ng/ml (6.0) at the conclusion of the ad libitum bout (Tukey’s HSD, ps < .05).
Figure 1.
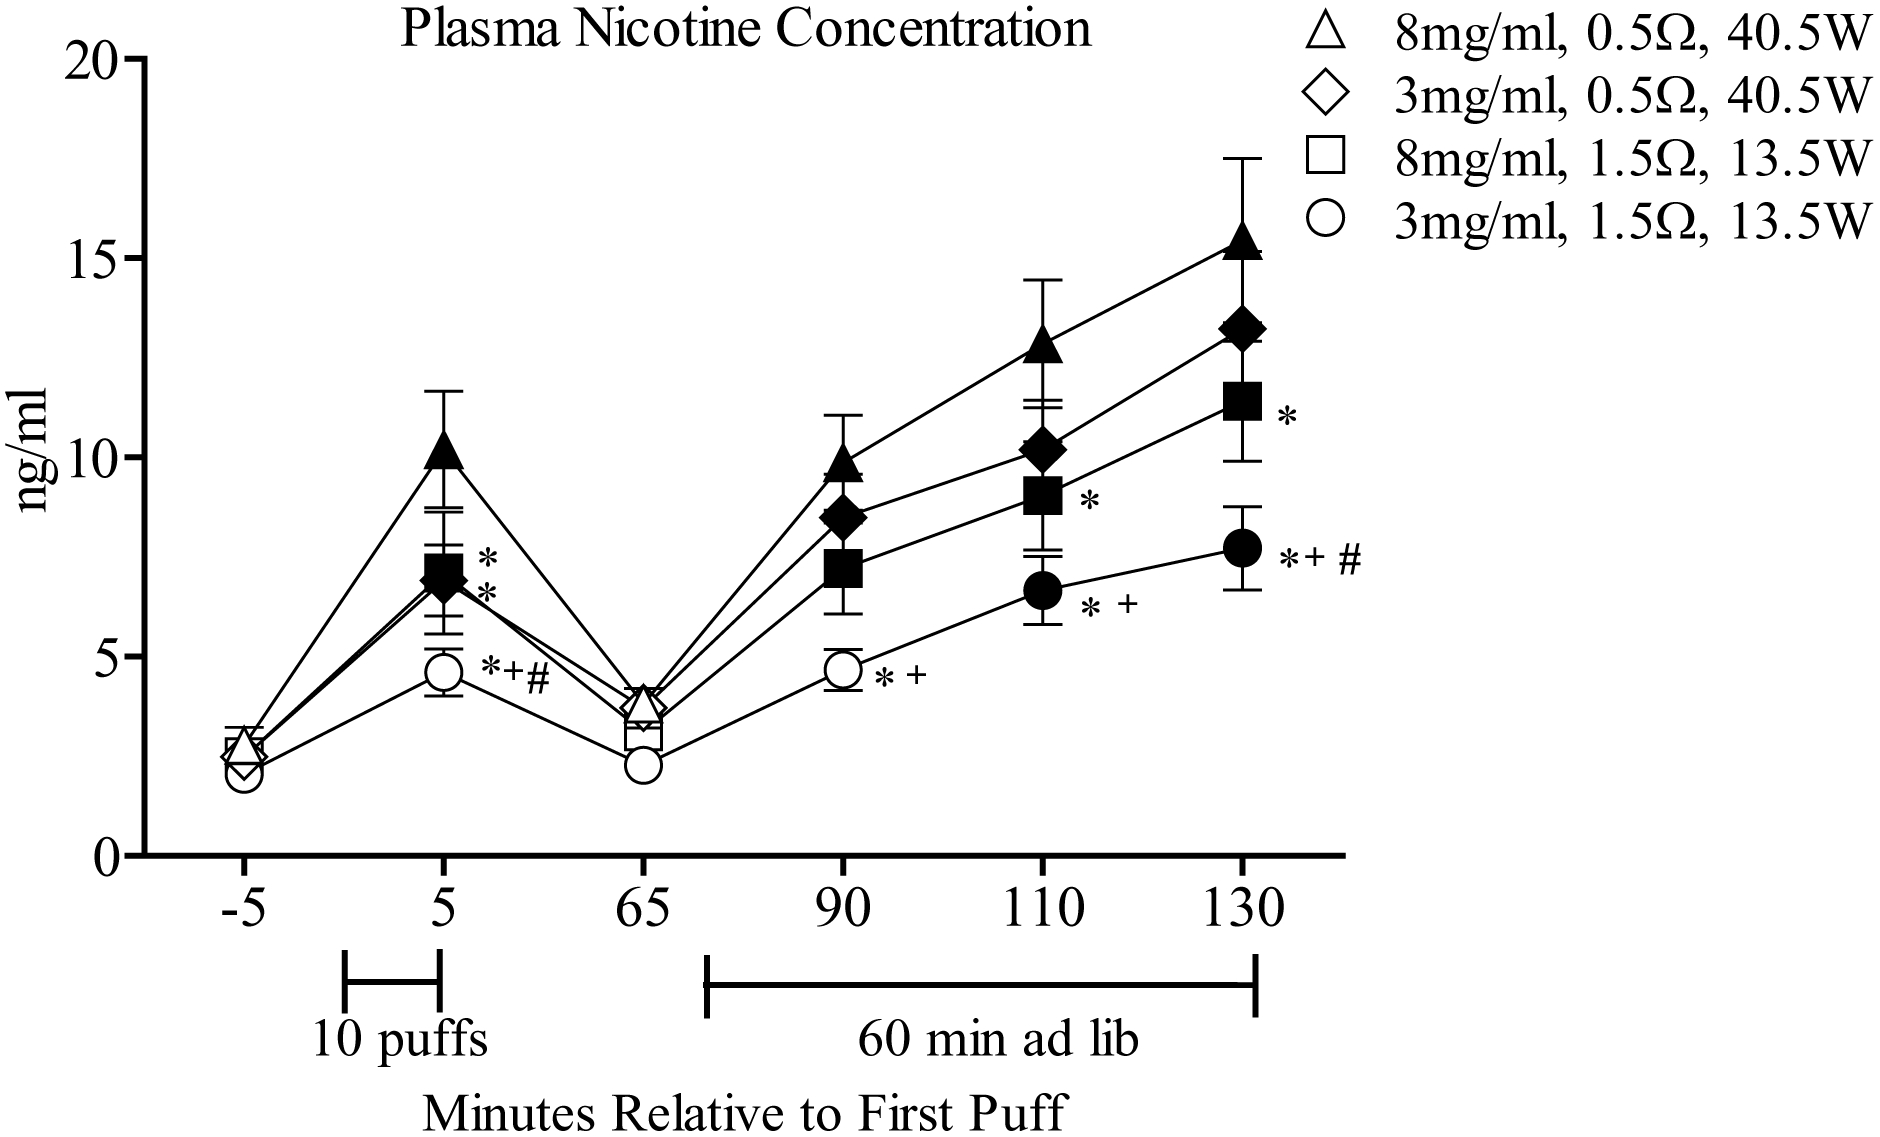
Mean (± SEM) plasma nicotine concentration from 32 experienced ECIG users across conditions that differed by coil resistance/power and liquid nicotine concentration. Brackets under the x-axis indicate the directed (10-puff) ECIG use bout and 60-minute ad libitum bout. Filled symbols indicate a significant difference from baseline (−5 timepoint), asterisks (*) denote significant differences from 8 mg/ml+0.5Ω condition at that timepoint, crosses (+) indicate significant differences between the 3 mg/ml+0.5Ω and 3 mg/ml+1.5Ω condition at that timepoint. Pound symbols (#) denote significant differences between the 3 mg/ml+1.5Ω and 8 mg/ml+1.5Ω condition at that timepoint. All ps < .05; Tukey’s HSD.
Post-hoc analyses revealed that following the 10-puff bout, mean plasma nicotine concentrations were significantly greater for the 8 mg/ml+0.5Ω condition relative to all others (Tukey’s HSD, ps < .05). Following ad libitum puffing, plasma nicotine concentrations for the 8 mg/ml+0.5Ω condition were significantly higher relative to all other conditions, except 3 mg/ml+0.5Ω. Overall, plasma nicotine concentrations were greater for the two 0.5Ω (40.5 W) conditions relative to the 1.5Ω (13.5 W) conditions, regardless of liquid nicotine concentration.
Heart Rate
A significant resistance by time interaction was observed for HR and significant main effects of resistance and time also were observed. Mean HR increased significantly from baseline following the 10-puff bout and at the conclusion of the ad libitum bout. For the 8 mg/ml+0.5Ω condition, mean (SD) HR increased from 66.7 bpm (6.4) at baseline to 75.5 bpm (9.3) after the 10-puff bout and to 77.0 bpm (9.1) after the ad libitum bout. For the 3 mg/ml+0.5Ω condition, mean (SD) HR increased from 68.8 bpm (9.1) at baseline to 75.8 bpm (10.2) after the 10-puff bout and to 78.3 bpm (9.6) after the ad libitum bout. For the 8 mg/ml+1.5Ω condition, mean (SD) HR increased from 68.0 bpm (6.3) at baseline to 72.6 bpm (8.2) after the 10-puff bout and to 76.7 bpm (8.5) after the ad libitum bout. Finally, for the 3 mg/ml+1.5Ω condition, mean (SD) HR increased from 67.3 bpm (7.0) at baseline to 72.3 bpm (6.6) following the 10-puff bout and to 74.0 bpm (8.0) at the conclusion of the ad libitum bout (Tukey’s HSD, all ps < .05). Post-hoc testing revealed that, at the conclusion of the ad libitum bout, mean HR for the 3 mg/ml+0.5Ω condition was significantly higher relative to the HR 3 mg/ml+1.5Ω condition (Tukey’s HSD, p < .05).
Subjective Measures
Hughes-Hatsukami Withdrawal Scale.
As indicated in Table 2, a significant nicotine by resistance interaction was observed for the item “Drowsiness” and a resistance by time interaction was observed for the item “Hunger.” In addition, significant main effects of nicotine were for the items “Craving an e-cigarette,” “Depression,” and “Urges to use an e-cigarette” and significant main effects of time were observed for all 11 subjective items: “Anxious,” “Craving an e-cigarette,” “Depression,” “Difficulty concentrating,” “Drowsiness,” “Hunger,” “Impatient,” “Irritable,” “Restlessness,” “Desire for sweets” and “Urges to use an e-cigarette.” Figure 2A and C show results for “Urges to use an e-cigarette” and “Anxious” (the two items with the largest F values for the main effect of time). Generally, scores for the items “Anxious,” “Craving an e-cigarette,” “Irritable,” and “Urges to use an e-cigarette” showed significant reductions from baseline following the 10-puff bout and at the conclusion of the ad libitum bout (Tukey’s HSD, ps < .05). Collapsed across condition, mean (SD) VAS score for the item “Anxious” decreased from 28.0 (26.2) at baseline to 12.9 (15.4) following the 10-puff bout and to 10.1 (14.2) at the conclusion of the ad libitum bout (Tukey’s HSD, ps < .05). In addition, for the item “Urges to use an e-cigarette,” reductions in VAS scores were dependent upon condition. For example, immediately following the 10-puff bout mean (SD) score for “Urges to use an e-cigarette” was 28.9 (4.4) for the 8 mg/ml+0.5Ω condition and was significantly lower relative to the score of 43.8 (4.1) for the 3 mg/ml+1.5Ω condition (Tukey’s HSD, ps < .05). Finally, with regard to significant interactions for “Drowsiness” and “Hunger,” post-hoc analyses did not detect any significant differences from baseline or significant differences across conditions for either item.
Figure 2.
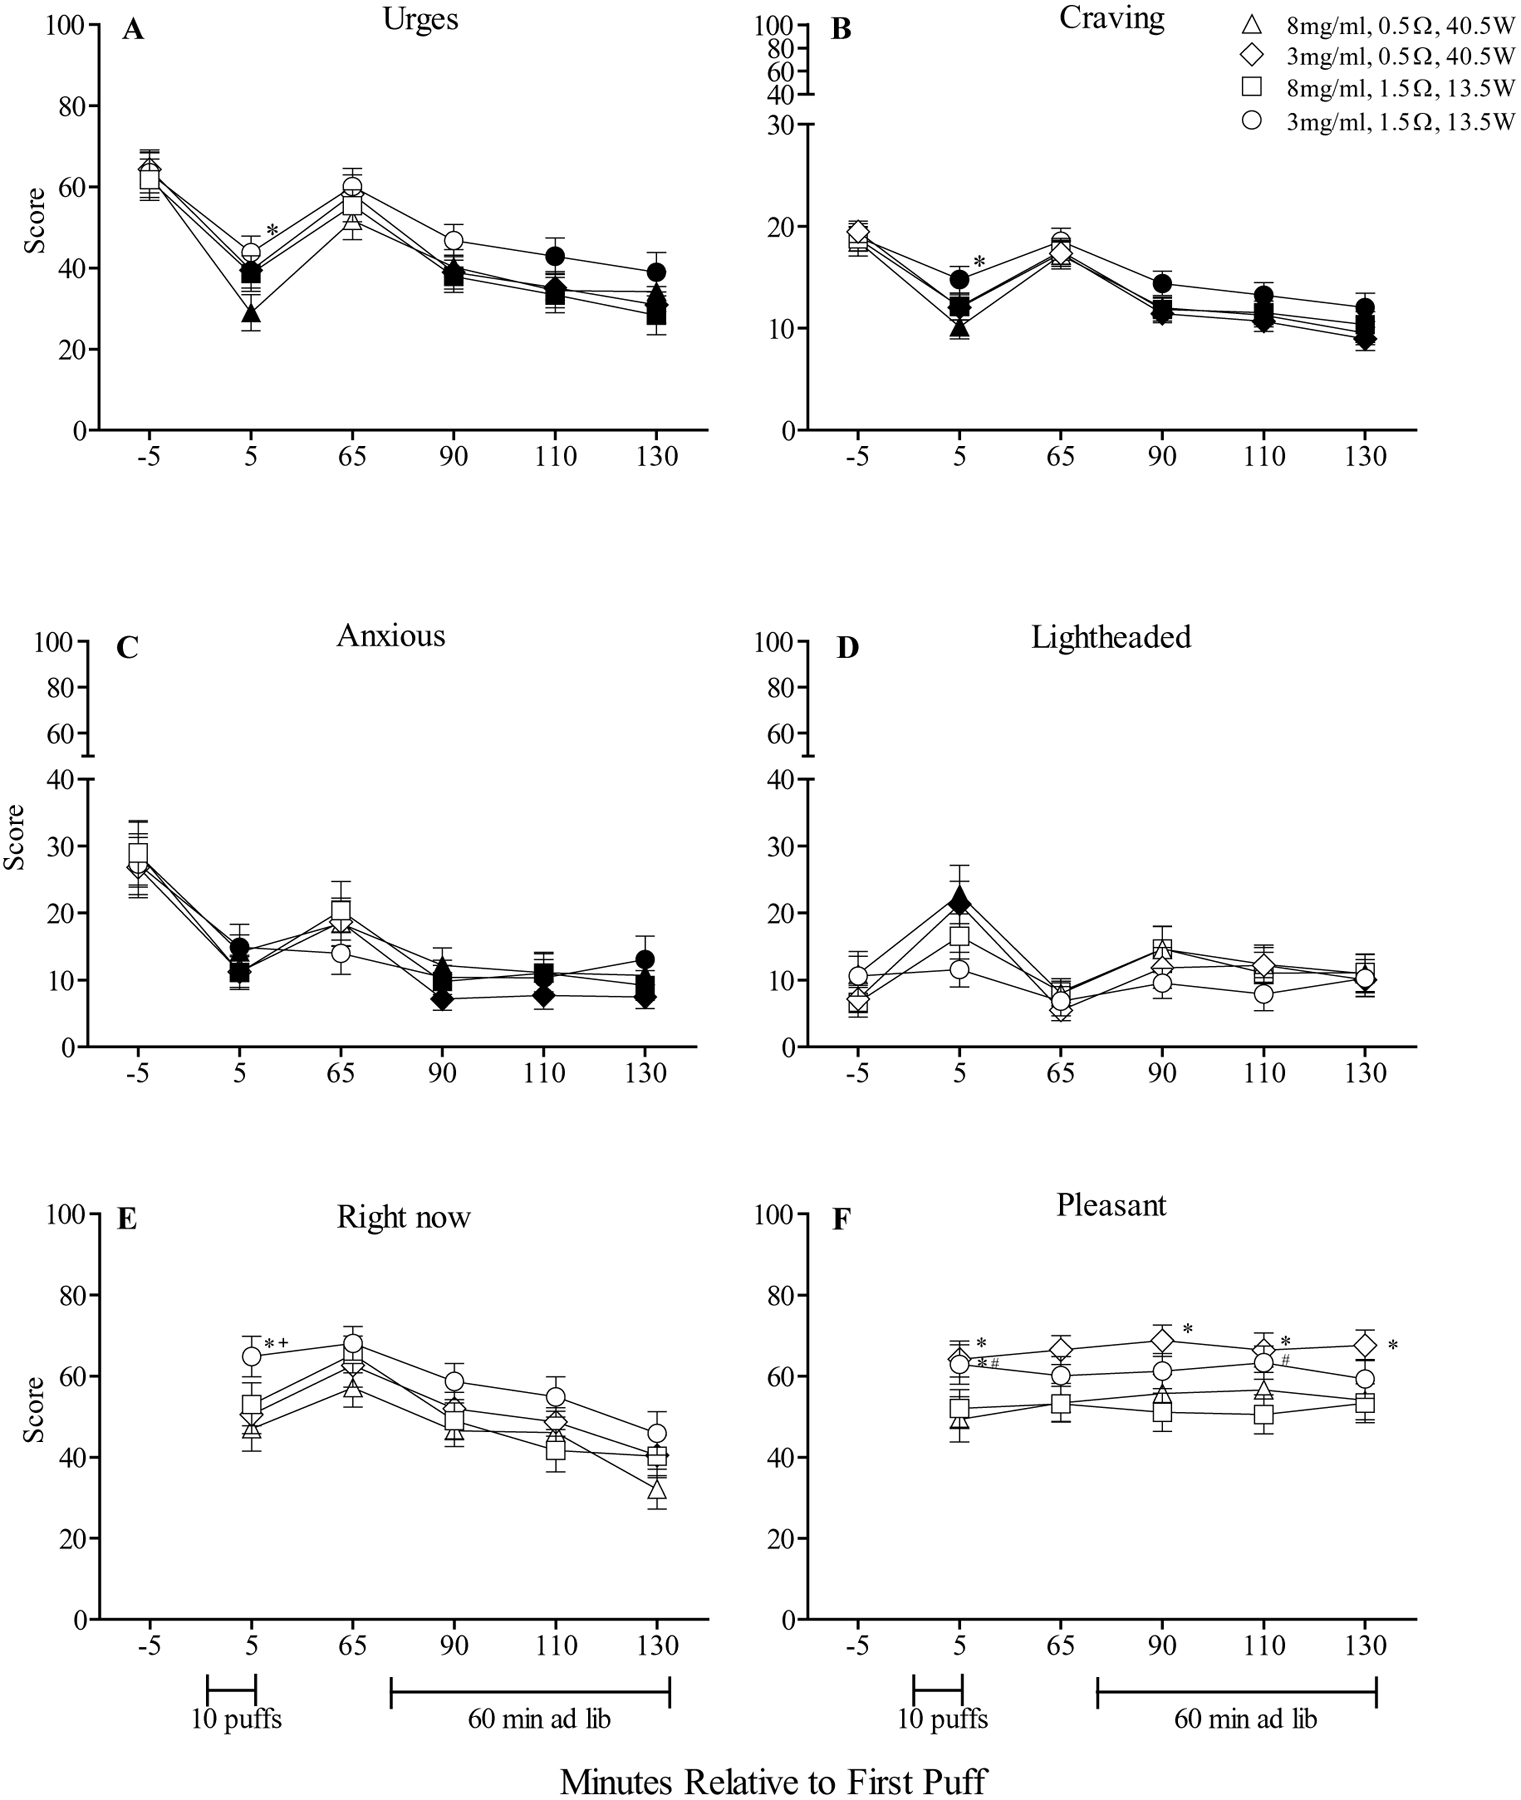
A and C: Mean (± SEM) rating for the visual analog scale (VAS) items “Urges to use an e-cigarette” and “Anxious” from the Hughes-Hatsukami withdrawal scale. B: Mean (± SEM) score for the Questionnaire of Vaping Craving. D: Mean (± SEM) rating for the visual analog scale (VAS) item “Lightheaded” from the Direct Effects of Nicotine scale. E and F: Mean (± SEM) rating for two visual analog scale (VAS) items from the Direct Effects of ECIG-Use scale: “Would you like another e-cigarette right now?” and “Was the e-cigarette pleasant?” Baseline timepoints for these two items were omitted as participants had not yet sampled the ECIG at that time. In all other respects the figures are identical to Figure 1.
Questionnaire of Vaping Craving.
No significant interactions were observed on this measure; however, significant main effects of nicotine, resistance, and time were observed for mean craving score. As indicated by Figure 2B, significant reductions in craving were observed from baseline following the 10-puff bout and at the ad libitum bout for each condition (Tukey’s HSD, ps < .05). Notably, significantly greater reductions in craving score were observed for the 8 mg/ml+0.5Ω condition relative to the 3 mg/ml+1.5Ω condition, though only following the 10-puff bout. For example, for the 8 mg/ml+0.5Ω condition mean (SD) craving score decreased from 18.5 (8.1) at baseline to 10.1 (6.7) following the 10-puff bout and the 3 mg/ml+1.5Ω condition decreased from 18.9 (7.6) at baseline to 14.8 (7.4) following the 10-puff bout (Tukey’s HSD, ps < .05). A similar pattern was observed for Hughes-Hatsukami item “Urges to use an e-cigarette” (see Figure 2A).
Direct Effects of Nicotine.
A significant resistance by time interaction was observed for “Lightheaded,” a nicotine by time interaction was observed for “Sweaty,” and significant main effects of nicotine were detected for “Heart pound” and “Lightheaded.” In addition, significant main effects of time were observed for “Lightheaded” and “Nervous”.
Figure 2D shows results for “Lightheaded” indicating that mean scores for the 8 mg/ml+0.5Ω and 3 mg/ml+0.5Ω conditions increased significantly from baseline following the 10-puff bout, and not following the ad libitum bout. For example, for the 8 mg/ml+0.5Ω condition, mean (SD) scores for “Lightheaded” increased from 10.87 (19.2) at baseline to 22.8 (24.5) after the 10-puff bout (Tukey’s HSD, ps < .05) and decreased to 10.9 (16.1) at the conclusion of the ad libitum bout. Post-hoc testing did not detect any significant differences from baseline or across conditions for the items “Sweaty,” “Heart pound” or “Nervous”.
Direct Effects of ECIG Use.
A significant nicotine by resistance by time interaction was observed for the item “Did the e-cigarette produce visible vapor/cloud.” While no comparisons to baseline were possible for this questionnaire (see Method), post-hoc testing revealed that, independent of liquid nicotine concentration, higher ratings for “Did the e-cigarette produce visible vapor/cloud” were observed for the 0.5Ω (40.5W) conditions relative to the 1.5Ω (13.5W) conditions. For example, immediately after the 10-puff bout, mean (SD) score for “Did the e-cigarette produce visible visible vapor/cloud” of 70.0 (22.4) for the 8 mg/ml+0.5Ω condition was significantly higher than the mean score of 55.6 (26.0) for the 8 mg/ml+1.5Ω condition (Tukey’s HSD, ps < .05). Also, significant resistance by time interactions were observed for the items “Did the e-cigarette make you dizzy?” and “Did the e-cigarette taste good?” For “Did the e-cigarette make you dizzy,” significantly higher mean scores for were observed for the 8 mg/ml+0.5Ω relative to the 8 mg/ml+1.5Ω and 3 mg/ml+1.5Ω conditions, though only following the 10-puff bout (Tukey’s HSD, ps < .05). Overall, for “Did the e-cigarette taste good,” higher scores were observed for the 3 mg/ml+0.5Ω condition relative to the 8 mg/ml+0.5Ω and 3 mg/ml+1.5Ω conditions (Tukey’s HSD, ps < .05).
Significant main effects of nicotine, resistance and time were observed for several items and are presented in Table 2. Two items, “Would you like to use another e-cigarette right now” and “Was the e-cigarette pleasant,” (the two items with the largest F values for the main effect of time) are presented in Figure 2E and F. For the item “Would you like to use another e-cigarette right now,” immediately after the 10-puff bout, mean (SD) scores of 47.0 (31.3) for the 8 mg/ml+0.5Ω condition and 50.5 (26.4) for the 3 mg/ml+0.5Ω condition were significantly lower relative to scores of 65.0 (28.0) for the 3 mg/ml+1.5Ω condition (Tukey’s HSD, ps < .05). For “Was the e-cigarette pleasant,” overall scores were greater for the 3 mg/ml+0.5Ω condition relative to the 8 mg/ml+0.5Ω condition. For example, following the 10-puff bout, mean (SD) score of 64.2 (25.1) for the 3 mg/ml+0.5Ω condition was significantly higher relative to the score of 49.3 (31.5) for the 8 mg/ml+0.5Ω condition (Tukey’s HSD, ps < .05). A similar pattern was observed for “Was the e-cigarette satisfying.”
General Labeled Magnitude Scale.
A significant nicotine by resistance by time interaction was observed for “Warmth” as were several main effects. As shown in Figure 3A, higher scores for “Warmth” were observed for the 0.5Ω (40.5W) conditions relative to the 1.5Ω (13.5W) conditions and, at times, higher scores were observed when liquid nicotine concentration was high (8 mg/ml) relative to low (3 mg/ml; Tukey’s HSD, ps < .05). Significant nicotine by time interactions were observed for “Harshness/Irritancy” and “Throat hit” (see Figure 3B and 3C). Post-hoc analyses revealed significantly higher scores for “Harshness” when liquid nicotine concentration was high relative to low, independent of coil resistance. For example, following the 10-puff bout, mean (SD) score of 59.9 (23.8) for the 8 mg/ml+0.5Ω condition was significantly higher relative to the score of 36.1 (17.9) for the 3 mg/ml+0.5Ω condition (Tukey’s HSD, ps < .05). For “Throat hit,” post-hoc testing revealed an interactive effect between coil resistance and liquid nicotine concentration: greater “Throat hit” scores were observed for 0.5Ω (40.5W) relative to the 1.5Ω (13.5W) conditions and also when liquid nicotine concentration was high (8 mg/ml). Finally, main effects of resistance were observed for “Flavor” with significantly higher “Flavor” scores observed for the 0.5Ω (40.5W) conditions relative to the 1.5Ω (13.5W) conditions. Collapsed across time, mean (SD) score for “Flavor” was 54.3 (20.7) for the 3 mg/ml+0.5Ω condition and was significantly higher relative to mean score of 41.7 (19.0) for the 3 mg/ml+1.5Ω condition (Tukey’s HSD, ps < .05).
Figure 3.
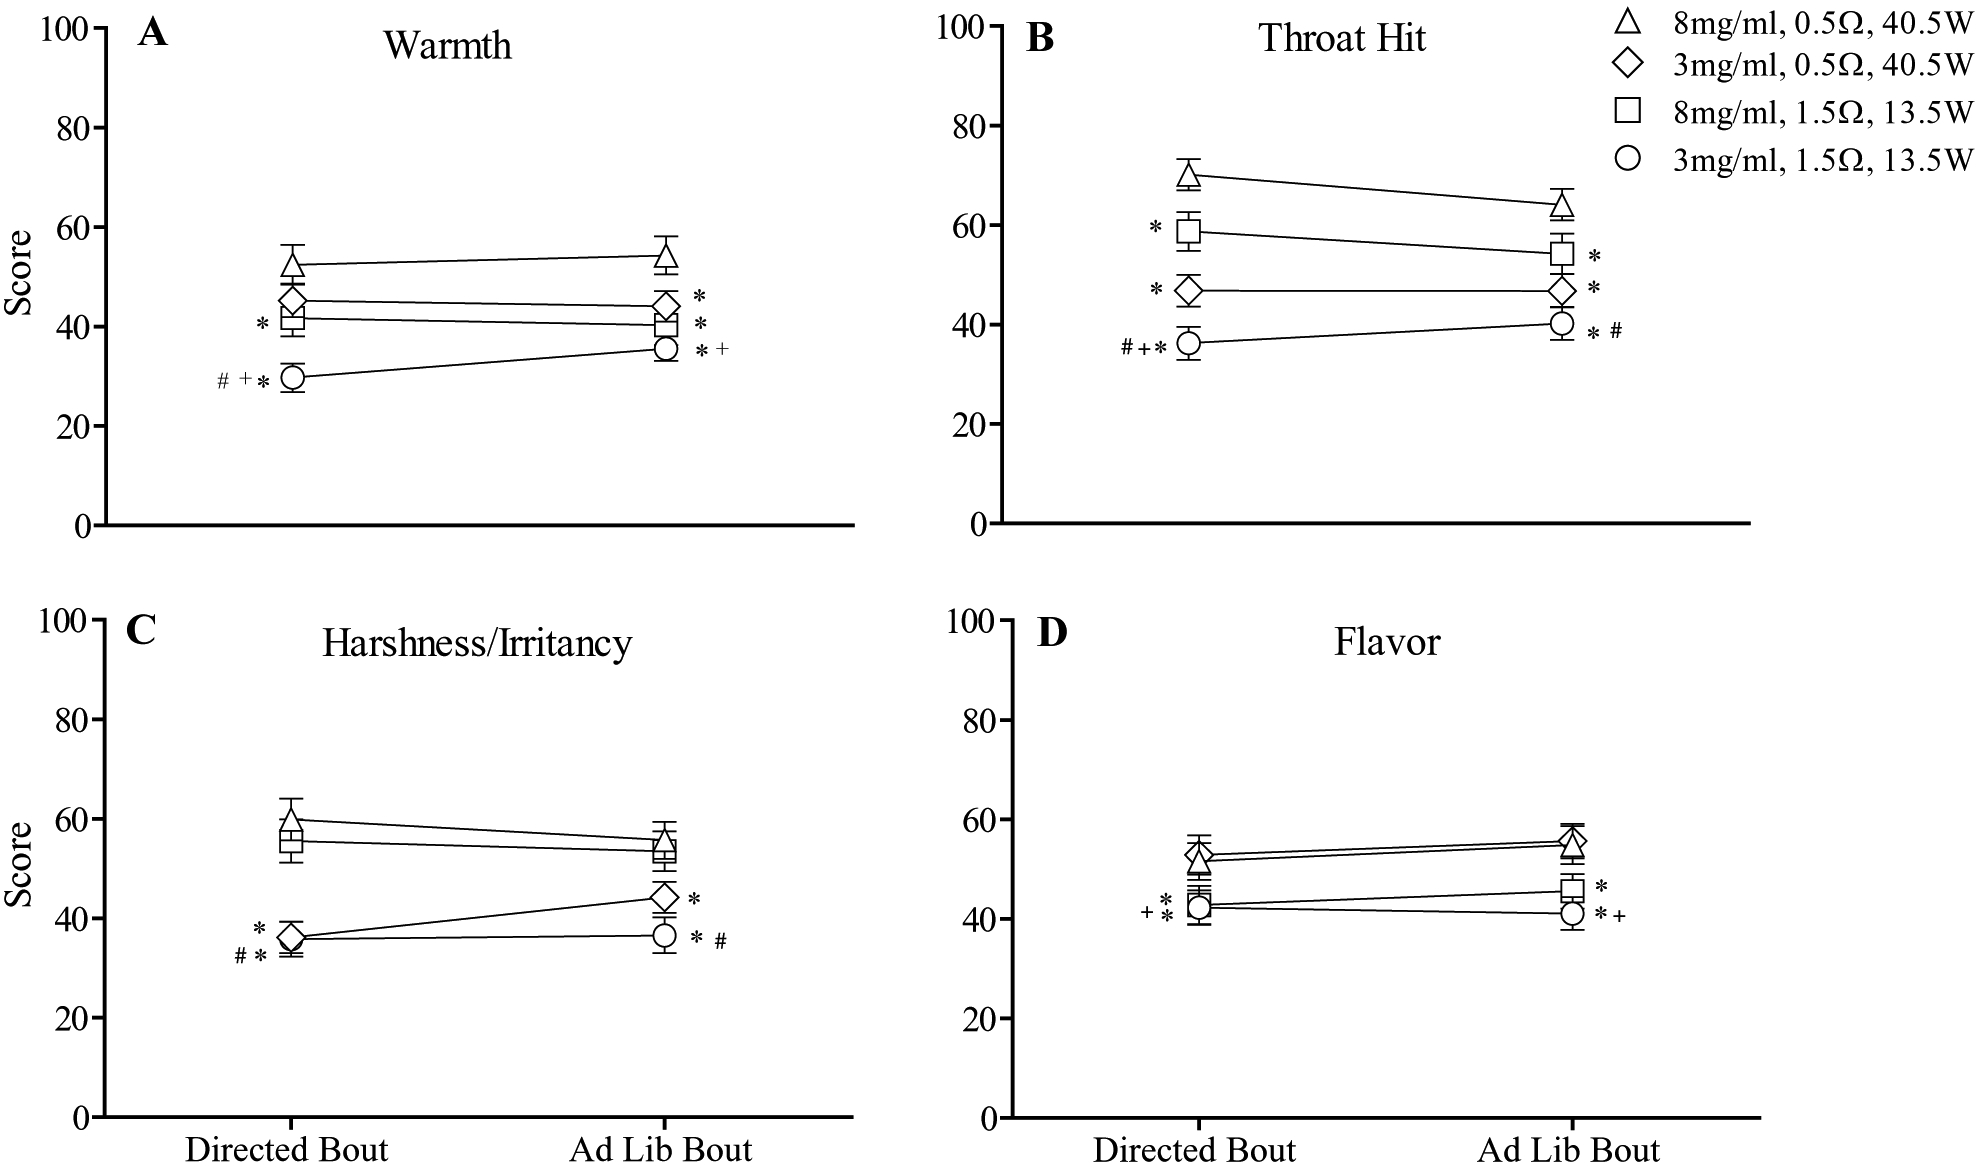
Mean (± SEM) subjective ratings for four items from the general Labeled Magnitude Scale (gLMS) which assesses the perceived intensity of ECIG-related sensations. Note that these items were administered immediately following the 10-puff bout and at the conclusion of the ad libitum bout. In all other respects the figure is identical to Figure 1.
Labeled Hedonic Scale.
A significant nicotine by resistance by time interaction was observed for hedonic ratings of liking/disliking of “Warmth” sensations. Post-hoc testing revealed that hedonic ratings of 59.0 (17.4) for the 3 mg/ml+0.5Ω condition were significantly higher relative to hedonic ratings of 48.5 (17.6) for the 8 mg/ml+0.5Ω condition, but only following the 10-puff bout (Tukey’s HSD, ps < .05). A significant nicotine by time interaction was observed for hedonic ratings of “Throat hit” sensations. Overall, significantly higher hedonic ratings of “Throat hit” sensations were observed when liquid nicotine concentration was 3 mg/ml relative to 8 mg/ml, though only following the 10-puff bout. In addition to significant interactions, significant main effects of nicotine, resistance and time were observed and are presented in Table 2.
Puff Topography
Mean (SD) puffing parameters across conditions are displayed in Table 3. For puff duration, significant main effects of nicotine [F (1, 30) = 22.3, p < .001] and resistance [F (1, 30) = 49.6, p < .001] were observed but no significant interactions were detected. During both ECIG-use bouts, participants took significantly shorter duration puffs when using the 8 mg/ml+0.5Ω condition relative to all others (Tukey’s HSD, ps < .05). Independent of coil resistance/power, significantly longer duration puffs were observed with liquid nicotine concentration was low (3 mg/ml; Tukey’s HSD, ps < .05).
Table 3.
Mean (SD) puff parameters for experienced ECIG users (N = 31) for a 10-puff directed ECIG use bout (30 sec IPI) and 60-minute ad libitum bout. A malfunction of the topography recording device resulted in incomplete data for one participant out of the 32 completers who were included in all other analyses. Note, IPI (30 s) and puff number (10) were controlled experimentally during the 10-puff directed bout as described in the method and data are included here to demonstrate that control. Asterisks (*) indicate significant differences between the 8mg/ml+0.5Ω condition and all other conditions during that bout; crosses (+) indicate significant differences between the 3 mg/ml+0.5Ω and 3 mg/ml+1.5Ω conditions and pound symbols (#) indicate significant differences between the 3 mg/ml+1.5Ω and 8 mg/ml+1.5Ω condition (Tukeys HSD; ps < .05).
| ECIG Resistance, Power and Liquid Nicotine Concentration | ||||
|---|---|---|---|---|
| 8 mg/ml 0.5Ω, 40.5W | 3 mg/ml 0.5Ω, 40.5W | 8 mg/ml 1.5Ω, 13.5W | 3 mg/ml 1.5Ω, 13.5W | |
| Puff Duration (sec) | ||||
| Directed | 2.3 (0.8) | 3.0 (1.0)* | 3.3 (1.1)* | 4.0 (1.6)*+# |
| Ad libitum | 2.2 (0.9) | 2.7 (0.7)* | 3.3 (1.1)* | 3.8 (1.5)*+# |
| Puff Volume (ml) | ||||
| Directed | 363.2 (147.3) | 519.6 (252.3)* | 384.4 (185.2) | 481.1 (275.4)*# |
| Ad libitum | 331.2 (153.3) | 463.9 (200.1)* | 362.9 (175.8) | 407.8 (204.9)* |
| Flow Rate (ml/sec) | ||||
| Directed | 160.2 (55.4) | 176.2 (60.1)* | 115.0 (42.2)* | 122.3 (52.7)*+ |
| Ad libitum | 154.6 (53.7) | 176.6 (62.2)* | 109.8 (36.7)* | 109.7 (40.0)*+ |
| IPI (sec) | ||||
| Directed | 27.7 (1.2) | 27.2 (1.6) | 25.8 (2.5) | 25.8 (2.7) |
| Ad libitum | 122.8 (88.6) | 85.5 (40.7)* | 107.1 (78.8) | 81.0 (39.8)* |
| Puff Number | ||||
| Directed | 10.0 (0.2) | 10.1 (0.5) | 10.0 (0.4) | 10.0 (0.4) |
| Ad libitum | 33.0 (16.4) | 45.2 (17.1)* | 35.4 (18.3) | 48.3 (29.7)*# |
For puff volume, a significant nicotine by resistance interaction was observed [F (1, 30) = 4.29, p < .05] as were significant main effects of nicotine [F (1, 30) = 22.04, p < .001] and time [F (1, 30) = 5.33, p < .05]. Overall, puff volumes were significantly larger when liquid nicotine concentration was 3 mg/ml, with the largest puff volumes observed for the 3 mg/ml+0.5Ω condition.
For flow rate, significant main effects of nicotine [F (1, 30) = 10.9, p < .01] and resistance [F (1, 30) = 73.5, p < .001] were detected though no significant interactions were observed. Significantly greater flow rate puffs were taken when using the two 0.5Ω (40.5W) conditions with the greatest flow rates observed for the 3 mg/ml+0.5Ω condition (Tukey’s HSD, ps < .05).
For puff number, a significant nicotine by resistance interaction was observed [F (1, 31) = 18.64, p < .001] as were significant main effects of nicotine [F (1, 30) = 19.10, p < .001] and time [F (1, 30) = 110.62, p < .001]. During the ad libitum bout, significantly more puffs were taken when using the 3 mg/ml+0.5Ω and 3 mg/ml+1.5Ω conditions relative to the 8 mg/ml+0.5Ω and 8 mg/ml+1.5Ω conditions (Tukey’s HSD, ps < .05).
Liquid Consumed
For liquid consumed, a significant nicotine by resistance by time interaction was detected [F (1, 31) = 4.5, p < .05] as were main effects of nicotine [F (1, 31) = 38.7, p < .001], resistance [F (1, 31) = 32.0, p < .001], and time [F (1, 31) = 74.2, p < .001]. For the 10-puff bout, mean (SD) liquid consumption (in ml) was 0.23 (0.19) for the 8 mg/ml+0.5Ω condition, 0.23 (0.19) for the 3 mg/ml+0.5Ω condition, 0.07 (0.06) for the 8 mg/ml+1.5Ω condition, and 0.10 (0.09) for the 3 mg/ml+1.5Ω condition. For the ad libitum bout, mean (SD) liquid consumption (in ml) was 0.50 (0.33) for the 8 mg/ml+0.5Ω condition, 1.00 (0.66) for the 3 mg/ml+0.5Ω condition, 0.30 (0.22) for the 8 mg/ml+1.5Ω condition, and 0.60 (0.45) for the 3 mg/ml+1.5Ω condition. Following 10 puffs, participants consumed significantly more liquid when using the two 0.5Ω (40.5W) conditions, independent of liquid nicotine concentration (Tukey’s HSD, ps < .05). However, during the ad libitum bout, significantly more liquid was consumed for the two 3 mg/ml nicotine conditions, with the greatest amount of liquid consumption observed for the 3 mg/ml+0.5Ω condition (Tukey’s HSD, ps < .05).
In an additional analysis to help clarify results, total nicotine exposure (in milligrams; mg) was calculated for each participant (i.e., by multiplying liquid nicotine concentration of 3 or 8 mg/ml by ml of liquid consumed) and values were averaged to produce a single value for each condition and each bout. For the 10-puff bout, mean (SD) total nicotine exposure (in mg) was 1.85 (1.5) for the 8 mg/ml+0.5Ω condition, 0.68 (0.56) for the 3 mg/ml+0.5Ω condition, 0.55 (0.51) for the 8 mg/ml+1.5Ω condition, and 0.33 (0.27) for the 3 mg/ml+1.5Ω condition. For the ad libitum bout, mean (SD) total nicotine exposure (in mg) was 3.95 (2.67) for the 8 mg/ml+0.5Ω condition, 2.96 (1.97) for the 3 mg/ml+0.5Ω condition, 2.38 (1.73) for the 8 mg/ml+1.5Ω condition, and 1.71 (1.35) for the 3 mg/ml+1.5Ω condition. The relationship between total nicotine exposure and user plasma nicotine concentration is demonstrated by significant positive correlations for total nicotine exposure and post-ad libitum bout plasma nicotine concentration for the 8 mg/ml+0.5Ω (r = .71), 3 mg/ml+0.5Ω (r = .70), and 8 mg/ml+1.5Ω conditions (r = .36) and 3 mg/ml+1.5Ω (r = .69) conditions (all ps < .05). A significant positive correlation between total nicotine exposure and post-directed bout plasma nicotine concentration was observed for the 3 mg/ml+0.5Ω (r = .47) condition only (p < .01).
DISCUSSION
One category of ECIGs models (i.e., “sub-ohm” devices) allow users to achieve high electrical power output (e.g., 40–300W) by reducing coil resistance (e.g., <1Ω). Importantly, these high power/low resistance ECIGs typically allow users to manipulate device and liquid characteristics as well as their puffing behavior simultaneously. This study was the first to evaluate systematically the individual and combined influence of ECIG device power, manipulated via coil resistance, and liquid nicotine concentration on several outcome measures. As described below, manipulation of ECIG power output (via coil resistance) and liquid nicotine concentration can influence nicotine delivery, HR, subjective effects, and alter puff topography and liquid consumption. Because power (manipulated via coil resistance) and liquid nicotine concentration influence outcomes predictive of dependence, they may warrant consideration by policymakers seeking to constrain ECIG-associated nicotine delivery and ECIG dependence potential.
ECIG-associated nicotine delivery is related to ECIG power (manipulated by coil resistance), and liquid nicotine concentration and is physiologically active as indexed by increases in HR. Overall, the study ECIG delivered higher concentrations of nicotine when power was high (40.5W) and coil resistance was low (0.5Ω) relative to when power was low (13.5W) and coil resistance was high (1.5Ω). As illustrated by Figure 1, the 8 mg/ml+0.5Ω condition resulted in the greatest nicotine delivery whereas the 3 mg/ml+1.5Ω condition resulted in the lowest. Because device power in the present study was manipulated by coil resistance, these results are consistent with pre-clinical and preliminary clinical laboratory studies demonstrating that increasing ECIG power increases the amount of nicotine in the resulting aerosol (Talih et al., 2015) and in users’ blood plasma (Wagener et al., 2017). Together, these results suggest that decreasing coil resistance to increase overall ECIG power is one method for increasing nicotine delivery to users. Further, ECIG-associated nicotine delivery was physiologically active for all study conditions as indicated by significant increases in HR following ECIG use. In every condition, HR increased significantly from baseline immediately after the 10-puff bout and at 20, 40 and 60 minutes of the ad libitum bout.
Generally, suppression of abstinence symptoms was observed for all study conditions but was most pronounced for the 8 mg/ml+0.5Ω condition which corresponded with the greatest nicotine delivery. However, the highest ratings of pleasantness, satisfaction, and taste were reported for the 3 mg/ml+0.5Ω condition (i.e., high ECIG power and low nicotine concentration). In addition, several sensory stimuli were influenced by power/resistance and liquid nicotine concentration. As suggested by anecdotal reports (Wang, 2016), use of the ECIG with high power/low resistance (40.5W;0.5Ω) resulted in more “Visible vapor/cloud” and higher sensations of aerosol “Warmth” and “Flavor” relative to the low power/high resistance (13.5W; 0.5Ω) ECIG. Power/coil resistance and liquid nicotine concentration had interactive effects on “Throat Hit” sensations with the greatest “Throat Hit” observed when using the high power/low resistance (40.5W;0.5Ω) ECIG with high nicotine (8 mg/ml). However, hedonic ratings for “Throat Hit” indicated a preference for the lower throat hit sensations produced by the 3 mg/ml+0.5Ω condition relative to the 8 mg/ml+0.5Ω condition. Finally, sensations of “Harshness/Irritancy” were contingent on liquid nicotine concentration rather than power/coil resistance with the lower sensations of “Harshness/Irritancy” produced by lower nicotine concentration liquids (3 mg/ml) being preferable to users as indicated by higher hedonic ratings. Taken together, these results suggest that ECIG device/liquid combinations that deliver the most nicotine and suppress abstinence symptoms do not necessarily coincide with most pleasurable/sensory effects. Importantly, factors aside from nicotine delivery and abstinence symptom suppression may reinforce ECIG use (e.g., aerosol visibility, warmth, and flavor) for nicotine-naïve individuals and those who are nicotine/tobacco dependent.
In addition, this study is among first to characterize the puff topography of high power/low resistance, “sub-ohm” ECIGs in experienced ECIG users. In general, shorter and smaller puffs were taken when using the 8 mg/ml+0.5Ω condition relative to all others with the longest and largest puffs taken in the 3 mg/ml+1.5Ω condition. During ad libitum puffing, participants increased puff frequency when liquid nicotine concentration was low (3 mg/ml), independent of power and coil resistance. Previous studies also indicate that experienced ECIG users take longer and larger puffs and increase puff frequency when using low concentration nicotine liquids (Dawkins et al., 2016, 2018; Hiler et al., 2017). These longer/larger and more frequent puffs may be in in an attempt, by experienced users, to obtain more nicotine from the low concentration nicotine liquid (3 mg/ml). Alternatively, the shorter/smaller puffs observed for the 8 mg/ml+0.5Ω condition may have been in response to perceptions of harshness/irritancy and throat hit produced by the higher concentration nicotine liquids.
ECIG liquid consumption differed as a result of power/coil resistance and liquid nicotine concentration. Under controlled puffing conditions (i.e., the 10-puff bout described here), participants consumed almost twice as much liquid when using the high power/low resistance ECIG (40.5W;0.5Ω) relative to the low power/high resistance ECIG (13.5W;1.5Ω). During ad libitum puffing, significantly more liquid was consumed when liquid nicotine concentration was low (3 mg/ml) with the greatest amount of liquid when using the 3 mg/ml+0.5Ω condition. These results are consistent with previous reports that indicate that users of high power ECIGs report using almost 3 times as much ECIG liquid daily relative to individuals using conventional ECIGs (Wagener et al., 2017). To the extent that inhalation of ECIG aerosol is associated with health risk, use of higher power devices may increase those risks because they allow users to inhale more potentially toxicant-laden aerosol with each puff (see Talih et al., 2017a) relative to lower power devices.
This study had several limitations. Puff duration and volume were not controlled experimentally during the 10-puff bout resulting in significant differences in these variables across study conditions. Namely, shorter/smaller puffs were taken during use of the 8 mg/ml+0.5Ω condition which may have resulted in less pronounced nicotine delivery for that condition. Future studies seeking to evaluate the influence of ECIG device and liquid characteristics on ECIG acute effects may benefit from more controlled puffing regimens that standardize puff duration and volume (e.g., Zacny & Stitzer, 1988). Also, while all 32 participants who completed the study were experienced ECIG users, 14 reported no prior experience with low resistance ‘sub-ohm’ ECIGs (see Table 1). Consequently, the novelty of the low resistance/high power ECIG may have influenced nicotine delivery, puff topography and subjective experience for those inexperienced individuals. Therefore, the results of the 14 participants with no prior experience with low resistance ‘sub-ohm’ ECIGs may not generalize completely to that of more experienced ECIG users. Therefore, future studies seeking to characterize nicotine delivery and puff topography of a particular ECIG may benefit from inclusion criteria that specify familiarity with that device. Finally, because this study did not include an own brand ECIG condition, direct comparison to participants’ usual nicotine delivery and topography was not possible.
Regulatory implications
The results from this study have several important implications for ECIG regulation. Previous systematic evaluations of ECIGs demonstrate that several ECIG liquid constituents (liquid nicotine concentration, PG:VG ratio) and user puffing behavior directly influence ECIG nicotine delivery (e.g., Hiler et al., 2017; Spindle et al., 2018) and the present results demonstrate that device power, manipulated here via heating coil resistance, also influences nicotine delivery. Therefore, regulatory action that limits one of these factors in an attempt to control nicotine delivery profile (e.g., European Union Directive, 2014/40/EU that limits ECIG liquid nicotine concentration to ≤ 20 mg/ml) are unlikely to succeed: rather, they likely will encourage users to seek out and manufacturers to produce higher power devices. Effective evidence-based policy regarding ECIG nicotine delivery profile (and likely other effects, such as toxicant exposure) must account for all relevant factors simultaneously (e.g., regulating nicotine “flux”; see Eissenberg and Shihadeh, 2015). In this regard, mathematical models that predict nicotine emissions (e.g., Talih et al., 2017b) may be a particularly useful tool. Taken together, results from the present study are relevant for policymakers concerned with ECIG device and liquid characteristics that influence ECIG nicotine delivery and may promote maintained use of these devices.
Public Significance Statement:
The present study examined the interactive effects of ECIG device characteristics and liquid nicotine concentration on several outcomes. Results indicate that, increasing ECIG power output, manipulated here via heating coil resistance, can increase nicotine delivery even when ECIGs are paired with low nicotine concentration liquids. Also, ECIG device/liquid combinations that deliver the most nicotine do not necessarily correspond with the most pleasurable/sensory effects, suggesting that factors aside from nicotine delivery may reinforce ECIG use.
Acknowledgements:
This manuscript is based on research performed for a doctoral dissertation that was conducted, completed, and defended at Virginia Commonwealth University (VCU). The dissertation is published in its entirety on VCU’s Scholars Compass website. Portions of this work were presented at the 24th annual meeting of the Society for Research on Nicotine and Tobacco. We would like to thank Barbara Kilgalen, Janet Austin, Melanie Crabtree, and Lauren Ratliff for their contribution to the study.
Funding: Research reported in this publication was supported by the National Institute on Drug Abuse of the National Institutes of Health under Award Number U54/P50DA036105 and F31DA040319 and the Center for Tobacco Products of the U.S. Food and Drug Administration. The content is solely the responsibility of the authors and does not necessarily represent the official views of the National Institutes of Health or the Food and Drug Administration.
Footnotes
Declaration of Interests: Drs. Eissenberg and Shihadeh are paid consultants in litigation against the tobacco industry and are named on a patent application for a device that measures the puffing behavior of electronic cigarette users. All other authors have no conflicts to report.
REFERENCES
- Acosta MC, Buchhalter AR, Breland AB, Hamilton DC, & Eissenberg T (2004). Urine cotinine as an index of smoking status in smokers during 96-hr abstinence: comparison between gas chromatography/mass spectrometry and immunoassay test strips. Nicotine & tobacco research, 6(4), 615–620. [DOI] [PubMed] [Google Scholar]
- Benowitz NL (2008). Neurobiology of nicotine addiction: implications for smoking cessation treatment. The American Journal of Medicine, 121, S3–S10. [DOI] [PubMed] [Google Scholar]
- Breland A, Soule E, Lopez A, Ramôa C, El Hellani A, & Eissenberg T (2017). Electronic cigarettes: what are they and what do they do? Annals of the New York Academy of Sciences, 1394(1), 5–30. [DOI] [PMC free article] [PubMed] [Google Scholar]
- Breland AB, Kleykamp BA, & Eissenberg T (2006). Clinical laboratory evaluation of potential reduced exposure products for smokers. Nicotine & Tobacco Research, 8, 727–38 [DOI] [PubMed] [Google Scholar]
- Buchhalter AR, Acosta MC, Evans SE, Breland AB, & Eissenberg T (2005). Tobacco abstinence symptom suppression: the role played by the smoking related stimuli that are delivered by denicotinized cigarettes. Addiction, 100, 550–559. [DOI] [PubMed] [Google Scholar]
- Dawkins LE, Kimber CF, Doig M, Feyerabend C, & Corcoran O (2016). Self-titration by experienced e-cigarette users: blood nicotine delivery and subjective effects. Psychopharmacology, 233, 2933–2941. doi: 10.1007/s00213-016-4338-2. [DOI] [PubMed] [Google Scholar]
- Deeming Tobacco Products To Be Subject to the Federal Food, Drug, and Cosmetic Act, as Amended by the Family Smoking Prevention and Tobacco Control Act, 2016. 81 FR 28974 (May 10, 2016). Docket No. FDA-2014-N-0189. [PubMed]
- Donny EC, & Jones M (2009). Prolonged exposure to denicotinized cigarettes with or without transdermal nicotine. Drug and Alcohol Dependence, 104(1–2), 23–33. 10.1016/j.drugalcdep.2009.01.021 [DOI] [PMC free article] [PubMed] [Google Scholar]
- Dowd AN, Motschman CA, & Tiffany ST (2018). Development and validation of the Questionnaire of Vaping Craving. Nicotine & Tobacco Research, 21(1), 63–70. [DOI] [PubMed] [Google Scholar]
- Etter JF (2016). Throat hit in users of the electronic cigarette: An exploratory study. Psychology of Addictive Behaviors, 30(1), 93–100. [DOI] [PubMed] [Google Scholar]
- Etter JF (2012). The electronic cigarette: An alternative to tobacco? Geneva, Switzerland: Jean-François Etter. [Google Scholar]
- Farsalinos K, Poulas K, & Voudris V (2017). Changes in puffing topography and nicotine consumption depending on the power setting of electronic cigarettes. Nicotine & Tobacco Research, 20(8), 993–997. [DOI] [PubMed] [Google Scholar]
- Farsalinos K, Spyrou A, Stefopoulos C, Tsimopoulou K, Kourkoveli P, Tsiapras D, Kyrzopoulos S, Poulas K, & Voudris V (2015). Nicotine absorption from electronic cigarette use: comparison between experienced consumers (vapers) and naïve users (smokers). Scientific Reports, 5. doi: 10.1038/srep11269. [DOI] [PMC free article] [PubMed] [Google Scholar]
- Farsalinos KE, Romagna G, Tsiapras D, Kyrzopoulos S, Spyrou A, & Voudris V (2013). Impact of flavour variability on electronic cigarette use experience: an internet survey. International Journal of Environmental Research and Public Health, 10(12), 7272–7282. [DOI] [PMC free article] [PubMed] [Google Scholar]
- Foulds J, Stapleton J, Feyerabend C, Vesey C, Jarvis M, & Russell MA (1992). Effect of transdermal nicotine patches on cigarette smoking: a double blind crossover study. Psychopharmacology, 106, 421–427. [DOI] [PubMed] [Google Scholar]
- Freeman Vape Juice. Sub ohm vaping guide. Retrieved from: https://www.freemanvapejuice.com/blogs/vape-news-and-reviews/sub-ohm-vaping-guide.
- Gentzke AS, Creamer M, Cullen KA, et al. (2019). Vital Signs: Tobacco Product Use Among Middle and High School Students — United States, 2011–2018. MMWR Morb Mortal Wkly Rep 2019, 68, 157–164. doi: 10.15585/mmwr.mm6806e1 [DOI] [PMC free article] [PubMed] [Google Scholar]
- Harvanko A, Kryscio R, Martin C, & Kelly T (2019). Stimulus effects of propylene glycol and vegetable glycerin in electronic cigarette liquids. Drug and Alcohol Dependence, 194, 326–329. [DOI] [PMC free article] [PubMed] [Google Scholar]
- Hiler M, Breland A, Spindle T, Maloney S, Lipato T, Karaoghlanian N, Shihadeh A, Lopez A, Ramôa C, Eissenberg T (2017). Electronic cigarette user plasma nicotine concentration, puff topography, heart rate, and subjective effects: Influence of liquid nicotine concentration and user experience. Experimental and Clinical Psychopharmacology, 25(5), 380–392. [DOI] [PMC free article] [PubMed] [Google Scholar]
- Huynh H, & Feldt LS (1976). Estimation of the Box correction for degrees of freedom from sample data in randomised block and split-plot designs. Journal of Educational Statistics, 1, 69–82. [Google Scholar]
- Jamal A, Gentzke A, Hu SS, Cullen KA, Apelberg BJ, Homa DM, & King BA (2017). Tobacco use among middle and high school students-United States, 2011–2016. Morbidity and Mortality Weekly Report, 66(23), 597–603. doi: 10.15585/mmwr.mm6623a1. [DOI] [PMC free article] [PubMed] [Google Scholar]
- Kriegel D (2015). What is Sub Ohm Vaping? Our Sub Ohm Vaping Guide & Tips, vaping360. Retrieved from: https://vaping360.com/vaping-101/cloud-chasing-sub-ohm-vaping/ [Google Scholar]
- Lim J, Wood A, Green BG (2009). Derivation and evaluation of a labeled hedonic scale. Chemical Senses, 34(9), 739–751. [DOI] [PMC free article] [PubMed] [Google Scholar]
- Lopez A, Hiler M, Maloney S, Eissenberg T, & Breland A (2016b). Expanding clinical laboratory tobacco product evaluation methods to loose-leaf tobacco vaporizers. Drug and Alcohol Dependence, 169, 33–40. doi: 10.1016/j.drugalcdep.2016.10.005. [DOI] [PMC free article] [PubMed] [Google Scholar]
- Maloney SF, Breland A, Soule EK, Hiler M, Ramôa C, Lipato T, & Eissenberg T (2019). Abuse liability assessment of an electronic cigarette in combustible cigarette smokers. Experimental and clinical psychopharmacology. doi: 10.1037/pha0000261. [Epub ahead of print] [DOI] [PMC free article] [PubMed] [Google Scholar]
- Misthub. Tutorial: Guide to Sub-Ohm Vaping. Retrieved from: https://www.misthub.com/blogs/vape-tutorials/76789189-tutorial-guide-to-sub-ohm-vaping
- Morean M, Krishnan-Sarin S, Sussman S, Foulds J, Fishbein H, Grana R, and O’Malley S Psychometric evaluation of the patient-reported outcomes measurement information system (PROMIS) nicotine dependence item bank for use with electronic cigarettes. Nicotine & Tobacco Research. (2018). doi: 10.1093/ntr/ntx271. [Epub ahead of print] [DOI] [PMC free article] [PubMed] [Google Scholar]
- Pickworth WB, Bunker EB, & Henningfield JE (1994). Transdermal nicotine: reduction of smoking with minimal abuse liability. Psychopharmacology, 115, 9–14. [DOI] [PubMed] [Google Scholar]
- Rosbrook K, & Green BG (2016). Sensory effects of menthol and nicotine in an E-cigarette. Nicotine & Tobacco Research, 18(7), 1588–1595. [DOI] [PMC free article] [PubMed] [Google Scholar]
- Rose JE, & Behm FM (1991). Physiological interactions between caffeine and nicotine. Pharmacology Biochemistry & Behavior, 38, 333–337. [DOI] [PubMed] [Google Scholar]
- Eissenberg T, & Shihadeh A (2015). Nicotine flux: a potentially important tool for regulating electronic cigarettes. Nicotine & Tobacco Research, 17(2), 165–170. [DOI] [PMC free article] [PubMed] [Google Scholar]
- Soar K, Kimber C, McRobbie H, & Dawkins LE. (2019). Nicotine absorption from e-cigarettes over 12 months. Addictive Behaviors, 91, 102–105. doi: 10.1016/j.addbeh.2018.07.019 [DOI] [PubMed] [Google Scholar]
- Soneji SS, Knutzen KE, & Villanti AC (2019). Use of Flavored E-Cigarettes Among Adolescents, Young Adults, and Older Adults: Findings From the Population Assessment for Tobacco and Health Study. Public Health Reports, 0033354919830967. [DOI] [PMC free article] [PubMed] [Google Scholar]
- Spindle TR, Talih S, Hiler MM, Karaoghlanian N, Halquist MS, Breland AB, … & Eissenberg T (2018). Effects of electronic cigarette liquid solvents propylene glycol and vegetable glycerin on user nicotine delivery, heart rate, subjective effects, and puff topography. Drug and Alcohol Dependence, 188, 193–199. [DOI] [PMC free article] [PubMed] [Google Scholar]
- Spindle T, Hiler M, Breland A, Karaoghlanian N, Shihadeh A, & Eissenberg T (2017). The influence of a mouthpiece-based topography measurement device on electronic cigarette user’s plasma nicotine concentration, heart rate, and subjective effects under directed and ad libitum use conditions. Nicotine & Tobacco Research, 19(4), 469–476. doi: 10.1093/ntr/ntw174. [DOI] [PMC free article] [PubMed] [Google Scholar]
- Spindle T, Breland A, Karaoghlanian N, Shihadeh A, & Eissenberg T (2015). Preliminary results of an examination of electronic cigarette user puff topography: the effect of a mouthpiece-based topography measurement device on plasma nicotine and subjective effects. Nicotine & Tobacco Research, 17(2), 142–149. doi: 10.1093/ntr/ntu186. [DOI] [PMC free article] [PubMed] [Google Scholar]
- Spring J (2016). How to properly prime your atomizer coil. Retrieved from: https://www.vaporauthority.com/blogs/news/113416517-how-to-properly-prime-your-atomizer-coil
- Talih S, Salman R, Karaoghlanian N, El-Hellani A, Saliba NA, Eissenberg T, & Shihadeh A (2017a). “Juice monsters”: sub-ohm vaping and toxic volatile aldehyde emissions. Chemical Research in Toxicology, 30(10), 1791–1793. [DOI] [PubMed] [Google Scholar]
- Talih S, Balhas Z, Salman R, El-Hage R, Karaoghlanian N, El-Hellani A, Baassiri M, Jaroudi E, Eissenberg T, Saliba N and Shihadeh A (2017b). Transport phenomena governing nicotine emissions from electronic cigarettes: Model formulation and experimental investigation. Aerosol Science and Technology, 51(1), 1–11. [DOI] [PMC free article] [PubMed] [Google Scholar]
- Talih S, Balhas Z, Eissenberg T, Salman R, Karaoghlanian N, El Hellani A, Baalbaki R, Saliba N, & Shihadeh A (2015). Effects of user puff topography, device voltage, and liquid nicotine concentration on electronic cigarette nicotine yield: measurements and model predictions. Nicotine & Tobacco Research, 17(2), 150–157. doi: 10.1093/ntr/ntu174. [DOI] [PMC free article] [PubMed] [Google Scholar]
- Vansickel AR, Cobb CO, Weaver MF, & Eissenberg TE (2010). A clinical laboratory model for evaluating the acute effects of electronic “cigarettes”: nicotine delivery profile and cardiovascular and subjective effects. Cancer Epidemiology Biomarkers & Prevention, 19, 1945–1953. [DOI] [PMC free article] [PubMed] [Google Scholar]
- Vansickel AR, & Eissenberg T (2013). Electronic cigarettes: effective nicotine delivery after acute administration. Nicotine & Tobacco Research, 15, 267–270. [DOI] [PMC free article] [PubMed] [Google Scholar]
- Wang E (2016). The benefits of Sub ohm vaping. Retrieved from: https://www.vaporesso.com/blog/the-benefits-of-sub-ohm-vaping
- Wagener TL, Floyd EL, Stepanov I, Driskill LM, Frank SG, Meier E, … & Queimado L (2017). Have combustible cigarettes met their match? The nicotine delivery profiles and harmful constituent exposures of second-generation and third-generation electronic cigarette users. Tobacco Control, 26(e1), e23–e28. [DOI] [PMC free article] [PubMed] [Google Scholar]
- Yingst J, Foulds J, Veldheer S, & Du P (2018). Device characteristics of long term electronic cigarette users: A follow up study. Addictive Behaviors, 91, 238–243. doi: 10.1016/j.addbeh.2018.08.001. [DOI] [PMC free article] [PubMed] [Google Scholar]
- Zacny JP & Stitzer ML (1988). Cigarette brand-switching: effects on smoke exposure and smoking behavior. Journal of Pharmacology and Experimental Therapeutics, 246, 619–627. [PubMed] [Google Scholar]