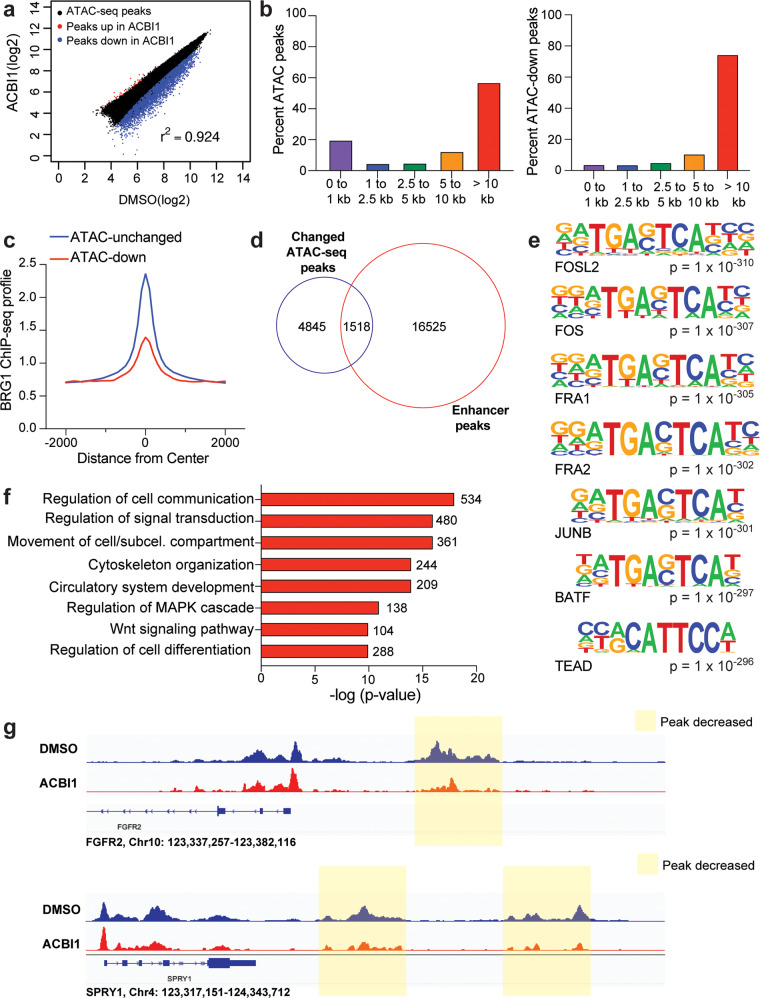
Fig. 5. BRG1 regulates chromatin accessibility of genes associated with cancer hallmarks.
a Scatterplot showing log2-fold changes of ATAC-peaks across DMSO vs. ACBI1. ATAC-peaks that are decreased upon ACBI1 treatment are shown in blue, while those increased are shown in red. b All ATAC-peaks (left) or ATAC-peaks that were significantly decreased (right, FDR < 0.05) were annotated to determine the distance of peak to the nearest transcription start site (TSS). Percent of ATAC-peaks falling into each bin are shown as bars within each graph. c Average normalized BRG1 ChIP-seq signal [4] at ATAC-sites which were unchanged in peak intensity or those with a decrease in ATAC-peak intensity are shown. d Venn diagram showing overlap between significantly changed ATAC-peaks (FDR < 0.05) and enhancer peaks in G401 cells. Enhancer peaks were identified as previously described [15]. e Top seven known motifs identified for decreased ATAC-peaks. f Decreased ATAC-peaks (FDR < 0.05, fold change < −1.5) were annotated to their nearest gene and GO analysis performed on all unique genes. Representative categories are shown, number of genes in each term are shown next to the bar. g IGV screenshot example of ATAC-sites that showed decreased peak intensity upon ACBI1 treatment. Nearest gene that sites were annotated to is shown to compare promotor-proximal peaks to promoter-distal sites. Peaks shaded in yellow are also identified as enhancers in d.

