Abstract
Inositol monophosphatase (I-1-Pase) catalyzes the dephosphorylation step in the de novo biosynthetic pathway of inositol and is crucial for all inositol-dependent processes. An extremely heat-stable tetrameric form of I-1-Pase from the hyperthermophilic bacterium Thermotoga maritima was overexpressed in Escherichia coli. In addition to its different quaternary structure (all other known I-1-Pases are dimers), this enzyme displayed a 20-fold higher rate of hydrolysis of d-inositol 1-phosphate than of the l isomer. The homogeneous recombinant T. maritima I-1-Pase (containing 256 amino acids with a subunit molecular mass of 28 kDa) possessed an unusually high Vmax (442 μmol min−1 mg−1) that was much higher than the Vmax of the same enzyme from another hyperthermophile, Methanococcus jannaschii. Although T. maritima is a eubacterium, its I-1-Pase is more similar to archaeal I-1-Pases than to the other known bacterial or mammalian I-1-Pases with respect to substrate specificity, Li+ inhibition, inhibition by high Mg2+ concentrations, metal ion activation, heat stability, and activation energy. Possible reasons for the observed kinetic differences are discussed based on an active site sequence alignment of the human and T. maritima I-1-Pases.
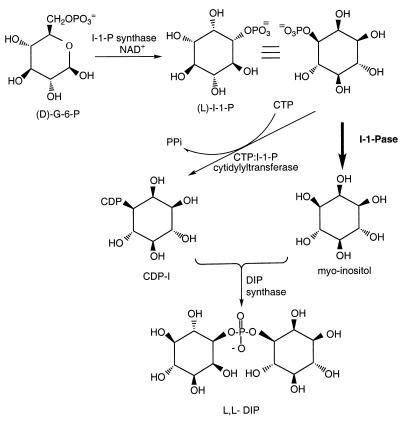
Inositol monophosphatase (I-1-Pase) (EC 3.1.3.25) catalyzes the dephosphorylation of d-inositol 1-phosphate (d-I-1-P) or l-I-1-P and sometimes d-I-4-P. The sole pathway for myo-inositol biosynthesis is cyclization of glucose 6-phosphate to l-I-1-P by I-1-P synthase (EC 5.5.1.4) and dephosphorylation of l-I-1-P by I-1-Pase (9, 18, 22, 28). This de novo pathway (Fig. 1) is the ultimate source of free inositol for cells and is essential for all inositol-related processes. During phosphoinositide signaling (3, 31, 43), I-1-Pase recycles the water-soluble phospholipase C phospholipid degradation products, inositol phosphates, to myo-inositol and helps maintain a moderate inositol pool. Brain cells lack an efficient uptake system for inositol, and resynthesis of inositol phospholipids depends solely on the dephosphorylation of inositol phosphate by inositol phosphatase. Inhibition of I-1-Pase by millimolar concentrations of lithium ions (22) has made this enzyme the putative target of lithium therapy for manic depression (41).
FIG. 1.
Proposed pathway for biosynthesis of DIP from d-glucose 6-phosphate. The boldface arrow indicates the I-1-Pase which provides myo-inositol for the reaction with CDP-inositol to form the final product, DIP. (D)-G-6-P, d-glucose 6-phosphate.
Although the existence of I-1-Pase in yeast and mammalian cells has been known for more than 30 years (10, 17), only recently has there been interest in bacterial and archaeal I-1-Pases. Part of this interest is driven by the possible role of mutants of this protein as extragenic suppressors (8, 34, 45, 51) in bacteria (Escherichia coli), as well as its involvement in the biosynthesis of di-myo-inositol-1,1′-phosphate (DIP) (11, 12), a novel inositol phosphate solute found in hyperthermophilic organisms, including the archaea Pyrococcus woesei (49), Pyrococcus furiosus (33), and Methanococcus igneus (14) and the bacterium Thermotoga maritima (42). The I-1-Pase involved in the proposed biosynthesis of DIP (12) plays a key role in generating myo-inositol for interaction with the activated I-1-P (cytidine diphosphoinositol) in the final step to form DIP (Fig. 1). These hyperthermophilic microorganisms, which have optimum growth temperatures of 80°C or higher, accumulate DIP for osmotic balance at high growth temperatures and high external salt concentrations. T. maritima is the only known bacterium that accumulates DIP as an osmolyte (42), although the DIP produced in this organism occurs in different chiralities (32) than the DIP produced in methanogens. Recently (11), we cloned and characterized the I-1-Pase activity of Methanococcus jannaschii. This enzyme exhibited significant sequence homology with the mammalian enzyme. However, it exhibited several strikingly different kinetic characteristics than the well-characterized eukaryotic and eubacterial enzymes. T. maritima, an organism in the eubacterial domain (50), inhabits an environment that is very similar to the environment inhabited by many archaea. Since it also synthesizes DIP, one might expect there to be similarities between the T. maritima I-1-Pase and methanogen I-1-Pases.
In this study, we cloned the T. maritima IMP gene, overexpressed the enzyme in E. coli, purified the recombinant I-1-Pase to homogeneity, and confirmed that it has the same kinetic characteristics as the I-1-Pase partially purified from T. maritima. As expected, T. maritima I-1-Pase had kinetic properties more like those of the methanogen I-1-Pase than those of the I-1-Pases isolated from eukaryotes and other bacteria. However, we identified the following three unique features of the T. maritima I-1-Pase: (i) it is a tetramer of 29-kDa subunits rather than a dimer; (ii) its catalytic efficiency (kcat/Km) is about 7 to 42 times higher than the catalytic efficiency of any previously described I-1-Pase; and (iii) it exhibits a dramatic preference for d-I-1-P compared to l-I-1-P.
MATERIALS AND METHODS
Chemicals.
dl-I-1-P, d-I-1-P, I-2-P, 2′-AMP, 5′-AMP, p-nitrophenylphosphate (pNPP), β-glycerophosphate, α-d-glucose 1-phosphate, glucose 6-phosphate, fructose 1-phosphate, NAD+, sodium dodecyl sulfate (SDS)-polyacrylamide gel electrophoresis (PAGE) molecular mass markers, gel filtration molecular mass markers, Sephadex G-150, and Coomassie brilliant blue 250 were obtained from Sigma. l-I-1-P was synthesized enzymatically by using recombinant yeast inositol-1-phosphate synthase (13). Q-Sepharose fast flow and phenyl-Sepharose were obtained from Pharmacia; Bio-Gel HTP and Bio-Gel A 0.5 m were obtained from Bio-Rad. Restriction enzymes were obtained from New England BioLabs. A ligation kit and E. coli strains were purchased from Novagen. A PCR kit was obtained from Perkin-Elmer. DNA polymerase pfu and a DNA isolation kit were purchased from Stratagene. A frozen T. maritima cell pellet was a gift from Michael Adams of the University of Georgia. The molecular mass standards obtained from Sigma included cytochrome c (molecular mass, 12.4 kDa), carbonic anhydrase (29 kDa), bovine serum albumin (66 kDa), alcohol dehydrogenase (150 kDa), β-amylase (200 kDa), and apoferritin (442 kDa). The other standards (used for the native molecular mass determination) included M. jannaschii I-1-Pase (56 kDa) (11) and Archaeoglobus fulgidus I-1-P synthase (174 kDa) (13a), as well as yeast I-1-P synthase (240 kDa) (16), which were cloned and purified in our laboratory. The aspartate transcarbamylase (ATCase) catalytic subunit (99 kDa) and holoenzyme (300 kDa), obtained from Evan Kantrowitz, Chemistry Department, Boston College, were also used to calibrate sizing techniques. Oligonucleotide primers were purchased from Operon.
I-1-Pase assay.
Enzyme activity was measured by colorimetrically determining the amount of released Pi (24). To monitoring the I-1-Pase activity of column fractions, each reaction mixture contained approximately 1 to 2 μl of 10 mM d-I-1-P (in 50 mM Tris buffer [pH 8.0]), approximately 1 to 2 μl of 200 mM MgCl2 (in 50 mM Tris buffer [pH 8.0]), and 2 to 10 μl of a fraction. The amount of enzyme used was adjusted to give an absorbance at 660 nm (A660) of approximately 0.3 to 0.4 within approximately 1 to 2 min. For more detailed kinetic studies, the total volume of the assay mixture was increased to 200 μl in order to reduce pipetting errors, and the final concentrations of substrate and Mg2+ were 2 and 20 mM, respectively, in most assay mixtures. To determine the Vmax and Km, the sensitivity range of the colorimetric Pi assay and the lower substrate concentrations necessary for the assay required increasing the total volume to 0.5 ml. After incubation at 95°C (most assays were done at 95°C rather than 100°C in order to avoid evaporation) for ∼2 min, the mixtures were quickly chilled on ice. All of the substrates were quite stable (i.e., no detectable Pi was released) for at least 5 min at 100°C, as shown by the lack of Pi in controls that did not contain the enzyme (data not shown). The liberated Pi was measured by performing a colorimetric phosphate assay with the ammonium molybdate Malachite Green reagent (24). The A660 of an enzyme sample compared to the A660 of standard Pi concentrations was used to calculate Pi production (expressed in micromoles per minute); enzyme specific activity was estimated by normalizing data to protein concentrations determined by the Bradford method (7) by using bovine serum albumin (Bio-Rad) as the standard. For very dilute protein fractions, the relative band intensities on the SDS gel were used to calibrate the enzyme concentrations. An extinction coefficient (ɛ280) of 28,200 mol-cm based on the composition of the protein (as predicted on the basis of the gene sequence) was used to determine the concentration of the homogeneous recombinant protein (30).
Partial purification of I-1-Pase from T. maritima.
Frozen cells (∼24 g) of T. maritima were thawed, resuspended in 50 ml of buffer A (20 mM Tris-HCl, 1.0 mM EDTA; pH 8.0), and incubated at room temperature for 30 min. The cells were broken by sonication 10 times for 30 s on ice, and the supernatant was separated from the cell debris by centrifugation (12,400 × g, 30 min). The supernatant was dialyzed twice against 2 liters of buffer A. The dialyzed crude extract was then heated at 85°C for 30 min. Precipitated material was removed by centrifugation (31,000 × g, 30 min), and the supernatant was loaded onto a Q-Sepharose fast flow column (1.6 by 20 cm) and eluted with a linear 0 to 0.5 M KCl gradient in buffer A (total volume, 250 ml). The I-1-Pase fractions, as detected by activity, were pooled, and solid KCl was added to a final salt concentration of about 1.5 M. The sample was loaded onto a Phenyl-Sepharose column (1.0 by 12 cm) that had been preequilibrated with buffer B (1.5 M KCl in 20 mM Tris buffer–1 mM EDTA [pH 8.0]). The column was then washed with the same buffer and eluted with a linear gradient of buffer B and buffer A (total volume, ∼200 ml). The fractions with I-1-Pase activity were combined (volume, ∼32 ml), dialyzed against buffer A, and then concentrated about eightfold by ultrafiltration by using an Amicon Centre-Plus concentrator. A 1-ml concentrated enzyme sample was mixed with equal volume of native gel sample buffer and loaded onto a preparative acrylamide gel electrophoresis cell (15). Active fractions were pooled, concentrated 10-fold, and applied to the gel filtration column. Protein purity was monitored by using SDS gels (26). The yields and I-1-Pase specific activities obtained in each step are summarized in Table 1.
TABLE 1.
Partial purification of I-1-Pase from T. maritima
| Prepn | Total protein (mg) | Sp act (μmol/ min-mg) | Total activity (U)a | Yield (%) | Purification (fold) |
|---|---|---|---|---|---|
| Crude extract | 1,440 | 0.17 | 240 | 100 | 1 |
| Heat treatment | 648 | 0.42 | 273 | 114 | 2.5 |
| Q-Sepharose fast flow | 153 | 1.20 | 184 | 77 | 7.2 |
| Phenyl-Sepharose | 48 | 3.47 | 163 | 68 | 21 |
| Prep cell | 3 | 13.6 | 41 | 17 | 82 |
| Gel filtration | 0.6 | 45.0 | 27 | 11 | 271 |
One unit was defined as 1 μmol of Pi produced per min at 95°C.
Nondenaturing acrylamide gel electrophoresis.
Nondenaturing acrylamide gel electrophoresis was used to determine the native molecular weight of T. maritima I-1-Pase by the method of Hedrick and Smith, with slight modifications (23). Standards and T. maritima I-1-Pase (∼10 μg of each) were electrophoresed on 7 to 12% polyacrylamide mini slab gels, and the Ornstein-Davis buffer system was used (15). The gels were stained with Coomassie brilliant blue. Negative slopes, obtained from plots of the relative mobilities of standards and T. maritima I-1-Pase versus the gel concentration, varied linearly with molecular masses.
Ultracentrifugation for molecular mass determination.
A linear density gradient was generated with 2 ml each of 25 and 6% sucrose (in 50 mM Tris-HCl [pH 8.0]) by using a two-mixing-chamber gradient former. Samples containing 2 to 3 mg of protein each in 0.1 ml were applied to the top of the gradient and centrifuged at 32,000 rpm for 14 h in a Beckman SW Ti 55 rotor. The centrifuged samples were collected with a BRANDEL fractionator (model 184; Biomedical Research Development Laboratories, Inc.). A 40% sucrose solution containing 1 mg of bovine serum albumin per ml was injected (at a rate of 0.8 ml/min) with a well-regulated pump into the bottom of the tube. The injected sucrose raised the contents of the tube upward through the tube holder and tubing connected to a UV absorbance detector. A small sharp peak (the front meniscus) and the broad bovine serum albumin peak marked the start and end of the gradient, respectively. The elution time was the time between the protein elution peak and the front meniscus peak. The positions of the protein in the tube were linearly proportional to the elution time and thus could be calculated accurately. The sample position varied linearly with the log of the molecular mass.
Activity staining.
A small analytical native gel was prepared by using the same conditions as the conditions used for the preparative gel in a Bio-Rad mini gel apparatus. The gel was prerun at 15 mA for 10 min. Samples (approximately 15 to 20 μl) of concentrated protein mixed with equal volumes of dye sample buffer were loaded and electrophoresed (at 20 mA) for approximately 3 to 4 h in a cold room. The gel was then washed in 50 mM Tris-HCl (pH 8.0) for 10 min and soaked in a developing solution (which contained 4 mM fresh pNPP and 20 mM MgCl2 in buffer A) until a bright yellow band, indicating that cleavage of pNPP to p-nitrophenol occurred, appeared. If the enzyme concentration was too high, the band appeared after 10 min without heating. Otherwise the sample was heated at 85°C for approximately 5 to 10 min.
Gel filtration.
A column (1.6 by 70 cm) of Sephadex G-150 equilibrated with buffer A was used to determine the native molecular masses of both native (both before and after electrophoresis) and recombinant T. maritima I-1-Pases. The void volume was measured with Blue Dextran, and the column was calibrated with β-amylase (molecular weight, 200,000), alcohol dehydrogenase (150,000), bovine serum albumin (66,000), carbonic anhydrase (29,000), and cytochrome c (12,400). Samples (0.5-ml portions of solutions with A280 values of approximately 2 to 3) were applied to the column and eluted at a flow rate of 0.5 ml/min. Two-milliliter fractions were collected and assayed for I-1-Pase activity.
Chromatography on a column (1.6 by 72 cm) of Bio-Gel A 0.5 m equilibrated with buffer C was also used to estimate the native molecular mass of the T. maritima I-1-Pase. Buffer C was composed of 0.5 M NH4Cl in 50 mM Tris-HCl (pH 7.8). The void volume was determined with Blue Dextran, and the column was calibrated with apoferritin (molecular weight, 442,000), yeast I-1-P synthase (240,000), β-amylase (200,000), A. fulgidus I-1-P synthase (174,000), alcohol dehydrogenase (150,000), bovine serum albumin (66,000), carbonic anhydrase (29,000), and cytochrome c (12,400). Pure I-1-Pase (∼4 mg) in 0.5 ml of buffer C was loaded onto the column and eluted at a flow rate of 0.4 ml/min. Two-milliliter fractions were collected. The A280 of each fraction was measured, and each fraction was assayed for I-1-P synthase activity.
Cloning of the IMP gene from genomic DNA and overexpression and purification of the recombinant protein.
A search of the protein database sequences (in which the human I-1-Pase sequence was used as the query sequence) tentatively identified a 256-amino-acid (28.6-kDa) hypothetical protein from T. maritima as the likely I-1-Pase in this organism. Based on its DNA sequence, the IMP gene was cloned, and the enzyme was overexpressed in E. coli. T. maritima genomic DNA was isolated from cell pellets by pronase (Stratagene kit) lysis, and the proteins were salted out by using a standard sodium chloride solution. The genomic DNA was recovered by ethanol precipitation and was resuspended in 10 mM Tris buffer (pH 8.0). The total amount of DNA at this stage was ∼5 mg (the amount obtained from a 0.65-g frozen cell pellet), and the A260/A280 ratio was about 1.9, which indicated that contaminating proteins were effectively removed. Two oligonucleotides, 5′-GGGAGGGATCCATATGGACAGACTGGAC-3′ (the NdeI site is underlined) and 5′-GCCCTTTTTCACTCTTAAGCCGAACTTG-3′ (the EcoRI site is underlined), were used to reconstruct and amplify the IMP gene from T. maritima genomic DNA. This modification also changed the translation-initiating codon of IMP gene from TTG to ATG for cloning into the pET23a(+) vector and effective expression in E. coli. The PCR products that were amplified by 30 cycles with the pfu DNA polymerase (a proofreading DNA polymerase isolated from P. furiosus that has the lowest error rate of the thermostable DNA polymerases that have been studied) were digested with NdeI and EcoRI, ligated to the NdeI-EcoRI-cut pET23a(+) vector, and transformed into Novablue competent cells for plasmid preparation. The positive clones were identified by restriction mapping. The recombinant clones were transformed into BL21(DE3)/pLysS competent cells for expression of the protein. A single colony of BL21(DE3)/pLysS containing the recombinant IMP gene-pET23a(+) plasmid was grown in 5 ml of Luria-Bertani medium supplemented with 100 μg of ampicillin per ml and 34 μg of chloroamphenicol per ml until the optical density at 600 nm reached approximately 0.6 to 1.0. Cell pellets from the 5-ml cultures were used to inoculate 2 liters of fresh Luria-Bertani medium containing 100 μg of ampicillin per ml and 34 μg of chloroamphenicol per ml. These cultures were grown to A600 of ∼0.9 with rapid shaking (200 rpm) at 37°C. Production of recombinant protein in the cultures was induced by adding 100 mM isopropyl-β-d-thiogalactopyranoside (IPTG) to a final concentration of 0.2 mM and growing the organisms for another 4 h (after which the A660 was ∼1.1). Cells were harvested by centrifugation and stored at −70°C until they were needed. The time course for expression of protein was monitored by SDS-PAGE (the band corresponding to a molecular mass of 28.6 kDa was the subunit of I-1-Pase). Dialyzed cell extract had very high I-1-Pase activity, whereas the control BL21(DE3)/pET23a(+) cell extract did not produce the corresponding 28.6-kDa band on an SDS-PAGE gel and exhibited no detectable I-1-Pase activity (data not shown). The enzyme was purified to homogeneity by the following three steps: heat treatment at 85°C for 30 min, Q-Sepharose fast flow column chromatography, and Phenyl-Sepharose chromatography as described for purification of the M. jannaschii enzyme (11). A summary of the purification procedure used is shown in Table 2.
TABLE 2.
Purification of recombinant T. maritima I-1-Pase from E. coli
| Prepn | Total protein (mg) | Sp act (μmol/ min-mg) | Total activity (U)a | Yield (%) | Purification (fold) |
|---|---|---|---|---|---|
| Crude extract | 435 | 39.5 | 17,200 | 100 | 1 |
| Heat treatment | 86 | 194 | 16,684 | 97 | 4.9 |
| Q-Sepharose fast flow | 33.1 | 363 | 12,015 | 70 | 9.2 |
| Phenyl-Sepharose | 18.1 | 421 | 7,620 | 44 | 10.6 |
One unit was defined as 1 μmol of Pi produced per mg of protein per min at 95°C.
RESULTS
I-1-Pase activity in T. maritima. T. maritima is unusual in that it is a DIP-accumulating bacterium. Our previous study of the DIP biosynthetic pathway in M. igneus showed that I-1-P synthase and I-1-Pase are the first two enzymes involved in the proposed four-step DIP biosynthesis pathway. Initially, we tried to assay a crude T. maritima cell protein extract for I-1-P synthase activity, as was done with M. igneus.
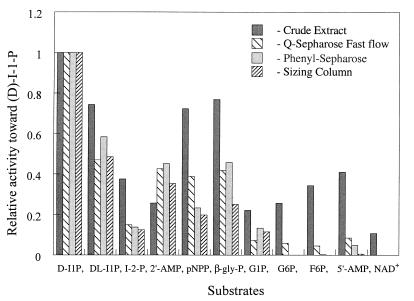
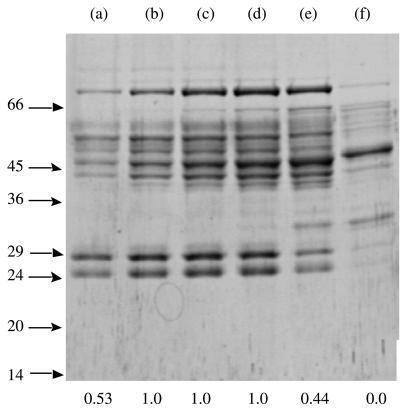
However, we detected unusually high phosphatase activity that converted everything to Pi (no I-1-P was detected by 31P nuclear magnetic resonance). Given these preliminary results, the goal of this work was to answer the following questions. (i) Is there really a specific I-1-Pase in T. maritima? (ii) Is the observed high specific activity in the crude extract caused by the abundance of the I-1-Pase (i.e., is I-1-Pase somehow overexpressed in T. maritima) or an intrinsic high specific activity? (iii) What are the subunit weight, native molecular mass, substrate specificity, specific activity, metal ion dependence, and Li+ inhibition characteristics of the T. maritima I-1-Pase? Phosphatases, both nonspecific and substrate-specific phosphatases, are abundant in crude T. maritima extracts and made initial attempts at identifying the I-1-Pase problematic. To isolate specific activities from nonspecific activities, a variety of substrates (I-1-P as the specific substrate, glucose 6-phosphate and 5′-AMP as nonspecific substrates) were examined after each purification step. The yields obtained from each step are summarized in Table 1. Nearly complete removal of nonspecific phosphatase activity was achieved after the Phenyl-Sepharose column chromatography step (Fig. 2). The additional chromatographic steps used to identify the subunit(s) responsible for the I-1-Pase activity included analytical nondenaturing gel electrophoresis (>90% of the I-1-Pase activity eluted right after the tracking dye) coupled with an activity staining procedure in which pNPP was used to identify I-1-Pase and gel filtration. Figure 3 shows the results of an SDS-PAGE analysis of column fractions obtained from the sizing column along with the relative activities of the fractions. Previously described known I-1-Pases have subunit molecular masses of ∼29 kDa, and a band at this molecular mass was detected (although it represented at most 10% of the total protein). Perhaps more interestingly, the protein mixture after gel filtration had an I-1-Pase specific activity of 45 μmol min−1 mg−1 (this activity was measured at 95°C, which was above the optimum growth temperature of the organism [80°C]). This value was approximately four to five times higher than the values reported for previously described pure I-1-Pases (including the I-1-Pase from another thermophile, M. jannaschii, assayed at its optimum growth temperature, 85°C [11]). Since the I-1-Pase probably accounted for only 10% of the total protein added to the assay mixture, the specific activity of the pure protein would be expected to be ∼450 μmol min−1 mg−1. Even more surprisingly, gel filtration on a Sephadex G-150 gel resulted in an estimated native molecular mass for native and recombinant T. maritima I-1-Pase of approximately 118 to 120 kDa. This suggested that the T. maritima I-1-Pase, unlike all previously described I-1-Pases (which are all dimers), is a tetramer.
FIG. 2.
Substrate specificity of T. maritima I-1-Pase activity during early steps in partial purification of the enzyme. The assay mixtures, which contained 2.0 mM substrate, 20 mM MgCl2, 50 mM Tris-HCl (pH 8.0), and enzyme fractions in a total volume of 20 μl, were incubated at 95°C for 2 min. The activities were normalized to the value obtained for d-I-1-P. The errors in enzyme activity were 3 to 5%. β-gly-P, β-glycerophosphate; G1P, glucose 1-phosphate; G6P, glucose 6-phosphate; F6P, fractose 6-phosphate.
FIG. 3.
SDS-PAGE analysis of the gel filtration step during partial purification of T. maritima I-1-Pase: fractions 26 (lane a), 27 (lane b), 28 (lane c), 29 (lane d), 31 (lane e), and 35 (lane f) from the sizing column. The positions of molecular mass standards (in kilodaltons) are indicated on the left. The numbers at the bottom are the relative activities of the fractions normalized to the value for the fraction with the highest level of activity.
Expression and purification of recombinant T. maritima I-1-Pase.
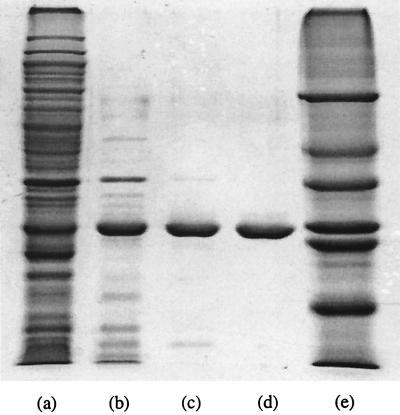
Although a complete T. maritima genome database was not available, there were some individually deposited sequences in the GenBank and protein databases. We used the human I-1-Pase amino acid sequence to search (with Blastp) the available protein database, and we found a 256-amino-acid hypothetical protein (PID g2330897) of T. maritima that appeared to be a good candidate for I-1-Pase. Sequences homologous to the I-1-Pase sequence have been found in virtually all of the microbial genomes that have been sequenced. Although some of the hypothetical proteins were putatively identified as extragenic suppressors, the recombinant proteins that have been produced (11, 34) have kinetic parameters (Km, Vmax) similar to those of previously described I-1-Pases. The calculated subunit molecular mass of the candidate molecule in T. maritima is 28.6 kDa, and sequence alignment with human I-1-Pase clearly showed that this hypothetical protein had all of the necessary I-1-Pase signature residues in corresponding positions. The optimized expression conditions in a culture tube (5 ml of medium) and a 250-ml flask (50 ml of culture) induced expression of I-1-Pase at high cell densities (A600, >0.9) in the presence of 0.2 mM IPTG. The amount of target protein that accumulated accounted for more than 20% of the total cellular protein, as estimated from intensities on the SDS gel. When the preparation was scaled up to a 2-liter culture in a 4-liter flask, the level of overexpression (5 to 10% of the total cell protein) was not as high as the levels observed with small culture volumes (see lane a in Fig. 4). Purification of the I-1-Pase was achieved by using heat treatment followed by chromatography on Q-Sepharose fast flow and phenyl-Sepharose columns (Fig. 4). The yield and specific activity at each stage are shown in Table 2. About 18 mg of homogeneous I-1-Pase could be obtained in this way.
FIG. 4.
Optimized T. maritima I-1-Pase expression and purification with a 12% SDS–PAGE gel stained with Coomassie brilliant blue. Lane a, crude extract; lane b, heat-treated supernatant; lane c, pooled fractions obtained from the Q-Sepharose fast flow column; lane d, I-1-Pase obtained from the Phenyl-Sepharose column; lane 3, molecular mass standards (66, 45, 36, 29, 24, 21.4, and 14 kDa).
Native molecular mass of the T. maritima I-1-Pase.
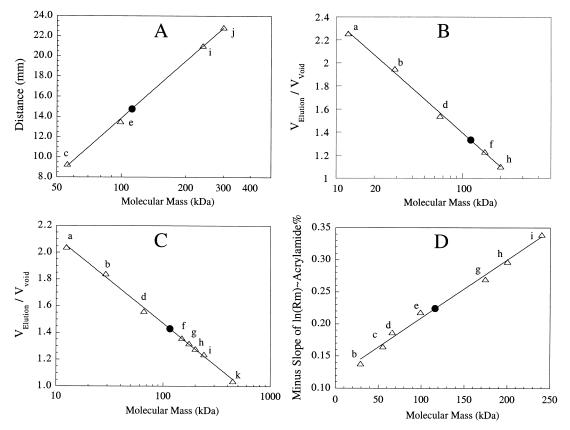
A molecular mass of 114 to 119 kDa for the pure recombinant I-1-Pase was determined by several methods. Sucrose (6 to 25%) density gradient sedimentation (Fig. 5A) gave a native molecular mass of 114 kDa. Gel filtration chromatography on Sephadex G-150 with 20 mM Tris-HCl (Fig. 5B) resulted in an estimated molecular mass of 119 kDa. Chromatography with a different sizing gel (a Bio-Gel A 0.5 m gel) and 0.50 M NH4Cl in 50 mM Tris-HCl (Fig. 5C) indicated that the native I-1-Pase molecular mass was 116 kDa; lowering the ionic strength to 50 mM Tris-HCl resulted in the same molecular mass (data not shown). Native gel electrophoresis performed with a 7 to 16% acrylamide gel (Fig. 5D) also confirmed that the molecular mass of I-1-Pase was 116 kDa. All of these different sizing techniques indicated that the heterologously expressed I-1-Pase from T. maritima is a tetramer. Furthermore, the tetrameric association remained stable, at least in the presence of buffer components at concentrations of 0.05 to 0.55 M and at pH 7.8 to 10.5 (the actual pH values during native gel electrophoresis). The T. maritima enzyme is the only I-1-Pase that has been reported to be a tetramer.
FIG. 5.
Native molecular mass of recombinant I-1-Pase from T. maritima. (A) Calibration curve (▵) and position of T. maritima I-1-Pase (●) obtained after centrifugation in a 6 to 25% linear sucrose density gradient. (B and C) Gel filtration with Sephadex G-150 (B) and Bio-Gel A 0.5 m resin (C). (D) Negative slopes, obtained from plots of relative mobilities of standards and T. maritima I-1-Pase versus gel concentration (7 to 12% polyacrylamide gels). The molecular mass standards used were cytochrome c (12.4 kDa) (a), carbonic anhydrase (29 kDa) (b), M. jannaschii I-1-Pase (56 kDa) (c), bovine serum albumin (66 kDa) (d), ATCase catalytic subunit (99 kDa) (e), alcohol dehydrogenase (150 kDa) (f), A. fulgidus I-1-P synthase (174 kDa) (g), β-amylase (200 kDa) (h), yeast I-1-P synthase (240 kDa) (i), ATCase holoenzyme (300 kDa) (j), and apoferritin (442 kDa) (k).
Kinetic characterization of the T. maritima I-1-Pase.
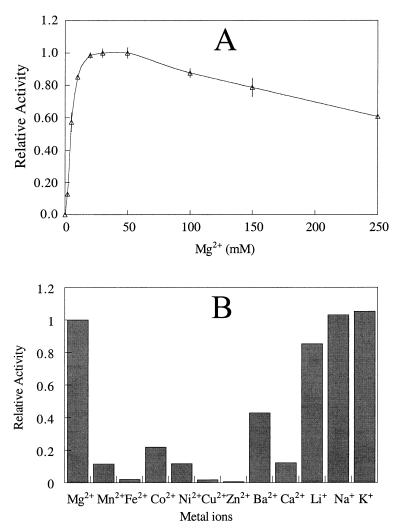
Like all other I-1-Pases, T. maritima I-1-Pase has an absolute requirement for Mg2+ for activity. About 20 mM Mg2+ was needed for optimal activity (Fig. 6A). This concentration of Mg2+ is much higher than the concentrations required by mammalian enzymes (1 to 3 mM) but is comparable to the concentrations required by the E. coli (34) and methanogen (11, 12) enzymes. The KD for Mg2+ was 6.6 mM, as estimated from the data shown in Fig. 5A (by using specific activities at Mg2+ concentrations less than 20 mM). At high Mg2+ concentrations, T. maritima I-1-Pase behaved differently than both mammalian and methanogen enzymes. There was no inhibition at a Mg2+ concentration of 50 mM, but there was slight inhibition in the presence of 100 mM Mg2+. Inhibition of mammalian enzymes occurred at much lower Mg2+ concentrations (approximately 3 to 5 mM), while the M. jannaschii enzyme was slightly activated in the presence of 100 mM Mg2+. Of all the other metal ions tested (Mn2+, Fe2+, Co2+, Ni2+, Cu2+, Zn2+, Ba2+, Ca2+, Li+, Na+, and K+), only Mn2+ and Co2+ (at a concentration of 20 mM) could slightly activate the enzyme in the absence of Mg2+. However, the levels of activation observed with Mn2+ and Co2+ were only 5% ± 0.7% and 9% ± 1.2% of the level of the activation observed with Mg2+. All of the divalent cations (at a concentration of 20 mM) inhibited I-1-Pase activity assayed with 20 mM Mg2+, while the three alkaline metal ions had relatively little effect at this low concentration (Fig. 6B).
FIG. 6.
(A) Dependence of T. maritima I-1-Pase activity (with 2.0 mM I-1-P in 50 mM Tris-HCl [pH 8.0] at 95°C) on Mg2+ concentration. Activities were normalized to the value obtained with 50 mM MgCl2. (B) Abilities of other metal ions (at a concentration of 20 mM) to inhibit T. maritima I-1-Pase in the presence of 20 mM Mg2+. Activities were normalized to the value obtained with 20 mM MgCl2.
In the presence of 25 mM Mg2+, T. maritima I-1-Pase specific activity exhibited a hyperbolic dependence on substrate concentration when d-I-1-P, dl-I-1-P, and I-2-P were used as substrates. The Vmax and Km values obtained with these substrates are shown in Table 3. The Vmax values were first estimated by using the partially purified protein extract (in which I-1-Pase represented only ∼10% of the total protein) and later were confirmed by using the recombinant I-1-Pase.
TABLE 3.
Kinetic parameters for T. maritima I-1-Pase hydrolysis of inositol phosphate substrates
| Substrate | Km (mM) |
Vmax (μmol of Pi min−1 mg of protein−1)
|
|
|---|---|---|---|
| Partially purified enzyme | Recombinant enzyme | ||
| dl-I-1-P | 0.145 ± 0.016a | 21.3 ± 0.6a | |
| d-I-1-P | 0.148 ± 0.013a | 44.6 ± 1.1a | |
| 0.126 ± 0.010b | 443 ± 10b | ||
| l-I-1-P | 23c | ||
| I-2-P | 0.460 ± 0.05a | 5.8 ± 0.3a | |
The Km and Vmax values were determined with partially purified I-1-Pase (although the same relative specificities were observed with the recombinant enzyme).
Determined with homogeneous recombinant enzyme.
Estimated from the relative rates of the recombinant enzyme with pure d-I-1-P and with l-I-1-P.
Substrate specificity.
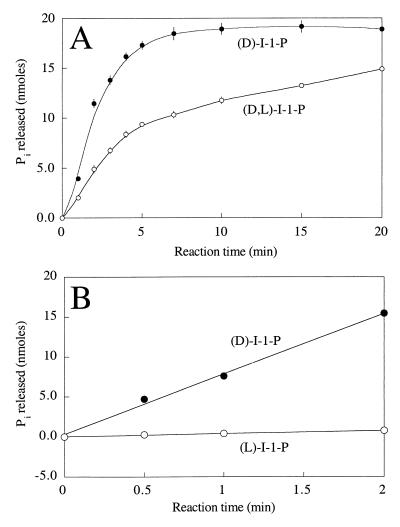
The substrate preferences of the T. maritima I-1-Pase were similar to the substrate preferences of the enzymes obtained from methanogen (11, 12), mammalian (2, 47), and plant (28, 29) sources. However, the enzyme exhibited the greatest activity with d-myo-I-1-P (Fig. 2 and Table 3). The enzyme activity with commercially available dl-myo-I-1-P (a mixture of d and l isomers with ∼27% I-2-P) was only about one-half the enzyme activity with the pure d isomer and was clearly biphasic (Fig. 7A). With d-I-1-P, the initial rate was ∼4.9 nmol/min; hydrolysis quickly leveled off after about 5 min. For the racemic mixture incubated with the same amount of enzyme, the reaction profile had two distinct phases, an initial rapid phase (2.3 nmol/min for the first 3 min) and then a slower phase (0.34 nmol/min between 7 and 20 min). The first phase represented rapid hydrolysis of d-I-1-P (which accounted for 36% of the mixture) and slow hydrolysis of both l-I-1-P (36%) and I-2-P (28%). After 5 to 7 min, it is likely that the d-I-1-P was almost completely depleted, and the slope represented the slow hydrolysis of l-I-1-P and I-2-P. To obtain a more accurate measurement of the specificity of the enzyme for d-I-1-P, enzymatically synthesized l-I-1-P (13) was used as a substrate for T. maritima I-1-Pase. As shown in Fig. 7B, the enzyme had a much higher reaction rate with the pure d isomer (7.59 nmol/min) than with pure l-I-1-P (0.39 nmol/min). On the basis of this initial rate data, it appeared that the enzyme had a 20-fold preference for d-I-1-P. T. maritima I-1-Pase is the first member of this class of enzymes to exhibit a significant preference during hydrolysis of d- and l-I-1-P substrates.
FIG. 7.
(A) Time course of Pi release from d-I-1-P (●) and dl-I-1-P (○) (20 nmol) after incubation at 90°C with 0.17 μg of enzyme. (B) Time course of Pi release from pure d-I-1-P (●) and l-I-1-P (○) after incubation at 90°C with T. maritima I-1-Pase. The released Pi was quantified by a colorimetric phosphate assay.
I-2-P was also a substrate for the T. maritima I-1-Pase, but the enzyme specific activity was much lower for this substrate than for I-1-P. As observed with the mammalian, plant, and methanogen I-1-Pases, both β-glycerophosphate and 2′-AMP were also substrates for this enzyme. pNPP was also a better substrate for T. maritima I-1-Pase than it was for most mammalian and plant I-1-Pases; however, pNPP was not as effective a substrate for the T. maritima enzyme as it was for M. jannaschii I-1-Pase.
Li+ inhibition.
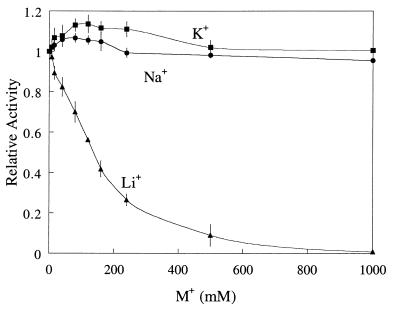
Li+ is a potent noncompetitive inhibitor of mammalian, plant, and E. coli I-1-Pases (the Ki values are 0.95, 0.30, and 0.35 mM for bovine [19, 27], human [35], and E. coli [34] I-1-Pases, respectively), while M. jannaschii I-1-Pase is slightly activated in the presence of 100 mM Li+ and is inhibited only at Li+ concentrations above 250 mM (11). The inhibition of T. maritima I-1-Pase by Li+ was between these extremes (Fig. 8). The estimated 50% inhibitory concentration for Li+ was ∼100 mM, and the Li+ concentration required to totally abolish I-1-Pase activity was 1 M. This finding is similar to what was observed with partially purified M. igneus I-1-Pase; ∼160 mM LiCl was required to inhibit M. igneus I-1-Pase by 50% (12). To determine if the Li+ effect on T. maritima I-1-Pase was specific or nonspecific, LiCl was replaced by NaCl and KCl. Compared to Na+ and K+, Li+ was the strongest inhibitor of T. maritima I-1-Pase (Fig. 8), although it was much less potent with this enzyme than it was with mammalian and plant enzymes.
FIG. 8.
Effects of Li+, Na+, and K+ on the activity of T. maritima I-1-Pase with 2.0 mM I-1-P in 50 mM Tris-HCl (pH 8.0) in the presence of 20 mM MgCl2 at 95°C for 1 min. Activities were normalized to the value obtained in the assay without the monovalent cation salt added.
Heat stability.
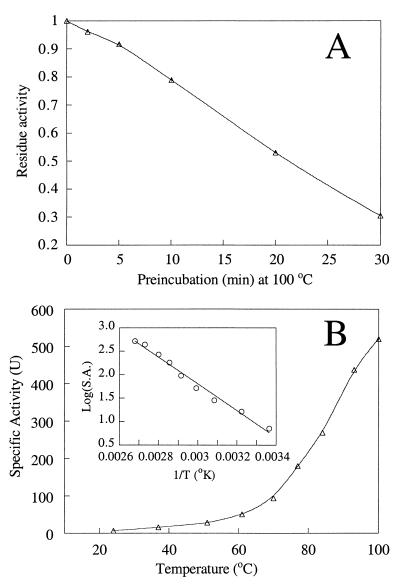
Although most plant and mammalian I-1-Pases exhibit maximum activity at temperatures around 37°C, they are very heat stable and can survive long periods of incubation at 60 to 70°C (21, 36). This observation led to a critical step in the purification to homogeneity of nonrecombinant (25, 37) and recombinant (35) mammalian and M. jannaschii (11) I-1-Pases. T. maritima is a thermophile with an optimum growth temperature of 80°C; hence, the I-1-Pase of this organism is expected to have unusual heat stability, as was observed for the M. jannaschii I-1-Pase. After incubation of the protein (0.3 mg/ml) at 85°C for 30 min, no loss of T. maritima I-1-Pase activity was detected. Heating at 100°C for 10 min resulted in a loss of about 20 to 25% of the activity; 30 min at this temperature inactivated about 70% of the activity (Fig. 9A), behavior almost identical to the behavior of M. jannaschii I-1-Pase (11). If shorter incubation times (1 to 10 min) were used, the protein could be assayed at 100°C, and at this temperature it exhibited higher activity than it exhibited at 85°C; however to avoid vigorous evaporation, most assays were done at 95°C. An Arrhenius analysis of I-1-Pase Vmax values at temperatures between 25 and 100°C yielded an activation energy of ∼54 kJ/mol (Fig. 9B). DIP accumulation in organisms is very temperature dependent (e.g., there was an approximately fourfold increase in the DIP level when the temperature was raised from 74 to 86.5°C in T. maritima [42]). The significant dependence on temperature probably results in part from one or more of the enzymes involved in DIP biosynthesis. However, given the rather modest activation energy (54 kJ/mol), I-1-Pase is probably not the temperature-sensitive enzyme. On the other end of the temperature scale, no I-1-Pase activity was lost during storage at 4°C for at least 1 month.
FIG. 9.
(A) Thermal stability of T. maritima I-1-Pase after preincubation at 100°C for various times. The enzyme activity was measured after preincubation by adding protein to the standard assay mixture and incubating the preparation at 95°C for 1 min. (B) Temperature dependence of T. maritima I-1-Pase Vmax. S.A., specific activity; T, temperature.
DISCUSSION
I-1-Pase was first detected in the pathway which converts glucose 6-phosphate to myo-inositol in yeast in 1966 (10). Two decades later, it was purified to homogeneity from rat brain by Takimoto et al. (47). Since then, it has been isolated or cloned from a variety of organisms. Although the T. maritima I-1-Pase is extremely similar to the M. jannaschii I-1-Pase in terms of Mg2+ activation, Li+ inhibition, substrate specificity, heat stability, and activation energy, there are many subtle differences between the two enzymes. Compared to the methanogen I-1-Pase, the requirement for Mg2+ is more stringent in T. maritima I-1-Pase. However, the three most striking characteristics of T. maritima I-1-Pase are (i) an unusually high catalytic efficiency (kcat/Km) that is 7 to 42 times greater than the catalytic efficiencies of I-1-Pases from other sources; (ii) a tetrameric quaternary structure, compared to the dimeric structure of all of the other known I-1-Pases; and (iii) the 20-fold kinetic discrimination between d- and l-I-1-P.
The extremely high activity of the T. maritima I-1-Pase is compared to the Vmax and kcat/Km values for other purified I-1-Pases in Table 4. Most of the other organisms are mesophiles (e.g., E. coli I-1-Pases were all assayed at 37°C, the E. coli growth temperature), which makes a direct comparison difficult, although thermophilic enzymes typically exhibit the highest levels of activity near the optimal growth temperature. If all of the activities are compared at the growth temperatures of the organisms, the T. maritima I-1-Pase has the highest catalytic efficiency. However, to make the point that the T. maritima I-1-Pase is unusually active, we compared it to the recombinant M. jannaschii I-1-Pase, which was assayed at 85°C. The specific activities of T. maritima I-1-Pase at 80 and 85°C are about 230 and 280 μmol min−1 mg−1, respectively (as extrapolated from Fig. 9). These values are much higher than the value for M. jannaschii I-1-Pase (9.3 μmol min−1 mg−1 at 85°C), another thermophilic enzyme.
TABLE 4.
Comparison of the kinetic characteristics of T. maritima I-1-Pase and I-1-Pases purified from other organisms
| I-1-Pase source | Km (mM) | Vmax (μmol min−1 mg−1) | kcat/Km (M−1 s−1) | Assay temp (°C) | Reference |
|---|---|---|---|---|---|
| T. maritima | 0.148 ± 0.013 | ∼450a | 1.45 × 10⁶ | 95 | |
| Recombinant T. maritima | 0.126 ± 0.010 | 443 ± 10 | 1.67 × 10⁶ | 95 | |
| Recombinant M. jannaschii | 0.091 ± 0.016 | 9.3 ± 0.45 | 4.87 × 10⁴ | 85 | 11 |
| Bovine | 0.16 ± 0.02 | 13.3 ± 0.9 | 3.96 × 10⁴ | 37 | 19 |
| Recombinant human | 0.075 ± 0.003 | 36.1 ± 1 | 2.29 × 10⁵ | 37 | 35 |
| 8.1 ± 0.19 | 5.15 × 10⁴ | 37 | 40 | ||
| Recombinant E. coli | 0.071 ± 0.008 | 13.3 ± 0.9 | 8.93 × 10⁴ | 37 | 34 |
Extrapolated by using the Vmax of the partially purified material and assuming that at most the 29-kDa band represented 10% of the total protein.
The difference in substrate specificity (i.e., a significant preference for d-I-1-P over l-I-1-P) is an intriguing characteristic that differentiates the T. maritima I-1-Pase from other enzymes of this type. Mammalian (39, 40), E. coli (34), and M. jannaschii (11) enzymes do not discriminate between the d- and l-I-1-P isomers, although M. igneus I-1-Pase has a slight preference for hydrolyzing a racemic mixture over pure d-I-1-P. The only other reported example of enantiomeric preference is the preference of pollen I-1-Pase, which hydrolyzed d-I-1-P at approximately 80 to 90% of the rate that it hydrolyzed the l isomer (29). The relevance of the 20-fold higher rate of d-I-1-P hydrolysis in T. maritima is unclear.
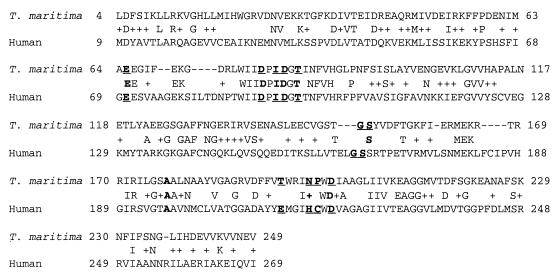
To compare sequence homologies and correlate possible active site residues with catalytic roles, the amino acid sequences of T. maritima and human I-1-Pases were aligned (Fig. 10). The alignment revealed an overall level of identity of 29%, a level of similarity of 52%, and a 5% gap. Many of the identical or conserved amino acid residues are located at the active site, as determined from the crystal structure of the human enzyme (4–6). Presumably, these residues play similar roles in the structures and catalytic mechanisms of the hyperthermophilic enzymes. The active site of the human enzyme, based on X-ray crystallographic data, includes the inositol binding site and two catalytic metal binding sites. Residues D-93, S-165, A-196, E-213, and D-220 form the inositol binding site in the human enzyme. The sequence alignment (Fig. 10) shows that the T. maritima I-1-Pase has D-82, G-151, A-177, T-194, and D-D201 at these positions. Three of five residues are conserved at this site. D-93, E-213, and D-220 use their side chains to form hydrogen bonds with the hydroxyl groups of the inositol ring in the human enzyme. The substitution of T-194 in T. maritima I-1-Pase should have a significant effect on substrate binding, which could alter substrate specificity. The interaction of human enzyme S-165 with the inositol ring is supposed to occur in the transition state, and mutation of this residue to alanine or isoleucine lowers the kcat approximately fivefold (5). In T. maritima I-1-Pase this residue is G-151. However, S-152 is quite close, and if G-151 and S-152 shifted to the left one residue in the alignment, they would match the human G-164 and S-165 residues at this site. The alignment of sequences indicates that the catalytic Mg2+ site is also conserved. T. maritima I-1-Pase has E-65, D-79, I-81, and T-84 at the catalytic metal (Mg2+) binding site; these amino acids align with E-70, D-90, I-92, and T-95 of the human enzyme.
FIG. 10.
Alignment of human and T. maritima I-1-Pase sequences. The active site residues, based on the human enzyme crystal structure, are underlined.
A second metal binding site of the human enzyme contains residues D-90, D-93, and D-220 and one oxygen of phosphate. Magnesium binding to this binding site is supposed to coordinate the ester oxygen and stabilize the intermediate as the phosphate ester is cleaved. This site may also be responsible for the noncompetitive inhibition by low concentrations of Li+ and high concentrations of Mg2+ (44). After phosphate ester hydrolysis, the second Mg2+ must subsequently dissociate to allow Pi to leave the active site. Therefore, high concentrations of magnesium prevent the phosphate from diffusing away from the active site. In the human enzyme, Li+ competes with Mg2+ for this site, forming an enzyme-Mg2+-phosphate-Li+ complex (27) which traps the enzyme in an unproductive state. D-79, D-82, and D-201 of the T. maritima I-1-Pase sequence align with the human residues, suggesting that the second metal binding site may also be conserved. However, inhibition of T. maritima I-1-Pase by Li+ and Mg2+ is significantly different than inhibition of the human enzyme and is very similar to inhibition of the methanogen enzyme. Residues close to the active site were also found to be crucial for the inhibition behavior observed with the human enzyme. Mutagenesis studies performed with the human enzyme (20) suggested that C-218 and H-217, which are close to D-220, are also key residues for Li+ inhibition and high-Mg2+-concentration inhibition. The sequence alignment showed that T. maritima I-1-Pase has P-199 in the position occupied by C-218 and that N-198 replaces H-217. These changes could contribute to the observed noninhibitory behavior of Li+ and high Mg2+ concentrations. Interestingly, M. jannaschii I-1-Pase, another I-1-Pase that is not sensitive to Li+ and Mg2+, also has altered residues at these positions (A-199 and R-198 replace C-218 and H-217).
T. maritima I-1-Pase is an extremozyme whose thermal characteristics are similar to those of the I-1-Pase of M. jannaschii. These two enzymes exhibited the highest level of activity at 100°C and had similar stabilities. The fact that one of these enzymes is a tetramer and the other is a dimer suggests that the quaternary structure may contribute less to the overall stability than the structure of the individual monomeric (or possibly dimeric) unit does. The mechanisms for stabilization of extremozymes are not fully understood, although some general mechanisms have been proposed (1, 38, 46). These mechanisms include increased numbers of ion pairs, salt bridges, and hydrogen bond interactions (48) and enhanced compactness and rigidity of the global structures. The available X-ray crystallography data (for a limited number of proteins) suggest there are no simple changes, such as one or several specific amino acid substitutions, which convert a mesophilic enzyme to an extremozyme. The increase in stability seemed to be caused by many concerted subtle interactions. In the case of the glyceraldehyde-3-phosphate dehydrogenases, only one-third of the 330 amino acids are conserved in the transition from mesophilic protein to thermophilic protein (1). This may also be the case for hyperthermophilic I-1-Pases. Only about 50% of the amino acids are conserved in the best-aligned region when a mesophilic I-1-Pase (human I-1-Pase [277 amino acids]) and thermophilic I-1-Pases (T. maritima I-1-Pase [256 amino acids] and M. jannaschii I-1-Pase [252 amino acids]) are compared. Presumably, many of the nonconserved residues contribute to the stability of the thermophilic enzymes.
ACKNOWLEDGMENTS
This work was supported by grant DE-FG02-91ER20025 (to M.F.R.) from the Department of Energy Biosciences Division and by grant GER-9023617 from the National Science Foundation.
We thank Mike Adams of the University of Georgia for providing the T. maritima cells.
REFERENCES
- 1.Adams M W W, Perler F B, Kelly R M. Extremozymes: expanding the limits of biocatalysis. Bio/Technology. 1995;13:662–668. doi: 10.1038/nbt0795-662. [DOI] [PubMed] [Google Scholar]
- 2.Attwood P V, Ducep J-B, Chanal M-C. Purification and properties of myo-inositol-1-phosphatase from bovine brain. Biochem J. 1988;253:387–394. doi: 10.1042/bj2530387. [DOI] [PMC free article] [PubMed] [Google Scholar]
- 3.Berridge M J, Irvine R F. Inositol phosphates and cell signaling. Nature. 1989;341:197–205. doi: 10.1038/341197a0. [DOI] [PubMed] [Google Scholar]
- 4.Bone R, Springer J P, Atack J R. Structure of inositol monophosphatase, the putative target of lithium therapy. Proc Natl Acad Sci USA. 1992;89:10031–10035. doi: 10.1073/pnas.89.21.10031. [DOI] [PMC free article] [PubMed] [Google Scholar]
- 5.Bone R, Frank L, Springer J P, Pollack S J, Osborn S, Atack J R, Knowles M R, McAllister G, Ragan C I, Broughton H B, Baker R, Fletcher S R. Structure analysis of inositol monophosphatase complexes with substrates. Biochemistry. 1994;33:9460–9467. doi: 10.1021/bi00198a011. [DOI] [PubMed] [Google Scholar]
- 6.Bone R, Frank L, Springer J P, Atack J R. Structural studies of metal binding by inositol monophosphatase: evidence for two metal ion catalysis. Biochemistry. 1994;33:9468–9476. doi: 10.1021/bi00198a012. [DOI] [PubMed] [Google Scholar]
- 7.Bradford M M. A rapid and sensitive method for the quantitation of microgram quantities of protein utilizing the principle of protein-dye binding. Anal Biochem. 1976;7:248–254. doi: 10.1016/0003-2697(76)90527-3. [DOI] [PubMed] [Google Scholar]
- 8.Chang S F, Ng D, Baird L, Georgopoulos C. Analysis of an Escherichia coli dnaB temperature-sensitive insertion mutation and its cold-sensitive extragenic suppressor. J Biol Chem. 1991;266:3654–3660. [PubMed] [Google Scholar]
- 9.Chen I-W, Charalompous F C. Biochemical studies on inositol. VIII. Purification and properties of the enzyme system which converts glucose-6-phosphate to inositol. J Biol Chem. 1965;240:3507–3512. [PubMed] [Google Scholar]
- 10.Chen I-W, Charalompous F C. Biochemical studies on inositol. IX. d-Inositol-1-phosphate as intermediate in the biosynthesis of inositol from glucose-6-phosphate and characteristics of two reactions in this biosynthesis. J Biol Chem. 1966;241:2194–2199. [PubMed] [Google Scholar]
- 11.Chen L, Roberts M F. Cloning and expression of inositol monophosphatase gene from Methanococcus jannaschii and characterization of the enzyme. Appl Environ Microbiol. 1998;64:2609–2615. doi: 10.1128/aem.64.7.2609-2615.1998. [DOI] [PMC free article] [PubMed] [Google Scholar]
- 12.Chen L, Spiliotis E, Roberts M F. Biosynthesis of di-myo-inositol-1,1′-phosphate, a novel osmolyte in hyperthermophilic archaea. J Bacteriol. 1998;180:3785–3792. doi: 10.1128/jb.180.15.3785-3792.1998. [DOI] [PMC free article] [PubMed] [Google Scholar]
- 13.Chen, L., C. Zhou, and M. F. Roberts. Cloning and overexpression of yeast myo-inositol-1-phosphate synthase gene in E. coli and purification of the enzyme to homogeneity. Submitted for publication.
- 13a.Chen, L., C. Zhou, and M. F. Roberts. Unpublished data.
- 14.Ciulla R A, Burggraf S, Stetter K O, Roberts M F. Occurrence and role of di-myo-inositol-1,1′-phosphate in Methanococcus igneus. Appl Environ Microbiol. 1994;60:3660–3664. doi: 10.1128/aem.60.10.3660-3664.1994. [DOI] [PMC free article] [PubMed] [Google Scholar]
- 15.Davis B. Disc electrophoresis. II. Methods and application to human serum proteins. Ann NY Acad Sci. 1963;121:404–427. doi: 10.1111/j.1749-6632.1964.tb14213.x. [DOI] [PubMed] [Google Scholar]
- 16.Donahue T F, Henry S A. myo-Inositol-1-phosphate synthase: characteristics of the enzyme and identification of its structural gene in yeast. J Biol Chem. 1981;256:7077–7085. [PubMed] [Google Scholar]
- 17.Eisenberg F, Jr, Bolden A H. d-myo-Inositol-1-phosphate, an intermediate in the biosynthesis of inositol in the mammal. Biochem Biophys Res Commun. 1965;21:100–105. doi: 10.1016/0006-291x(65)90093-8. [DOI] [PubMed] [Google Scholar]
- 18.Eisenberg F, Jr, Parthasarathy R. Measurement of biosynthesis of myo-inositol from glucose-6-phosphate. Methods Enzymol. 1987;141:127–143. doi: 10.1016/0076-6879(87)41061-6. [DOI] [PubMed] [Google Scholar]
- 19.Gee N S, Ragan C I, Watling K J, Aspley S, Jackson R G, Reid G G, Gani D, Shute J K. The purification and properties of myo-inositol monophosphatase from bovine brain. Biochem J. 1988;249:883–889. doi: 10.1042/bj2490883. [DOI] [PMC free article] [PubMed] [Google Scholar]
- 20.Gore M G, Greasley P, McAllister G, Ragan C I. Mammalian inositol monophosphatase: the identification of residues important for the binding of Mg2+ and Li+ ions using fluorescence spectroscopy and site-directed mutagenesis. Biochem J. 1993;296:811–815. doi: 10.1042/bj2960811. [DOI] [PMC free article] [PubMed] [Google Scholar]
- 21.Gumber S C, Loewus M W, Loewus F A. Further studies on myo-inositol-1-phosphatase from the pollen of Lilium longiflorum Thunb. Plant Physiol. 1984;76:40–44. doi: 10.1104/pp.76.1.40. [DOI] [PMC free article] [PubMed] [Google Scholar]
- 22.Hallcher L M, Sherman W R. The effects of lithium ion and other agents on the activity of myo-inositol-1-phosphatase from bovine brain. J Biol Chem. 1980;255:10896–10901. [PubMed] [Google Scholar]
- 23.Hendrick L, Smith A J. Size and charge isomer separation and estimation of molecular weights of proteins by disc gel electrophoresis. Arch Biochem Biophys. 1968;126:155–164. doi: 10.1016/0003-9861(68)90569-9. [DOI] [PubMed] [Google Scholar]
- 24.Itaya K, Ui M. A new micromethod for the colorimetric determination of inorganic phosphate. Clin Chim Acta. 1966;14:361–366. doi: 10.1016/0009-8981(66)90114-8. [DOI] [PubMed] [Google Scholar]
- 25.Kwon O, Lo S, Kwok F, Churchich J. Reversible unfolding of myo-inositol monophosphatase. J Biol Chem. 1993;268:7912–7916. [PubMed] [Google Scholar]
- 26.Laemmli U K. Cleavage of structural proteins during the assembly of the head of bacteriophage T4. Nature. 1970;227:680–685. doi: 10.1038/227680a0. [DOI] [PubMed] [Google Scholar]
- 27.Leech A P, Baker G R, Shute J K, Cohen M A, Gani D. Chemical and kinetic mechanism of the inositol monophosphatase reaction and its inhibition by Li+ Eur J Biochem. 1993;212:693–704. doi: 10.1111/j.1432-1033.1993.tb17707.x. [DOI] [PubMed] [Google Scholar]
- 28.Loewus F A. Inositol biosynthesis. In: Moore D J, Boss W F, Loewus F A, editors. Inositol metabolism in plants. New York, N.Y: Wiley-Liss, Inc.; 1990. pp. 13–19. [Google Scholar]
- 29.Loewus M W, Loewus F A. myo-Inositol-1-phosphatase from the pollen of Lilium longiflorum Thunb. Plant Physiol. 1980;70:765–770. doi: 10.1104/pp.70.3.765. [DOI] [PMC free article] [PubMed] [Google Scholar]
- 30.Mach H, Middaugh C R, Lewis R V. Statistical determination of the average values of the extinction coefficient of tryptophan and tyrosine in native proteins. Anal Biochem. 1992;200:74–80. doi: 10.1016/0003-2697(92)90279-g. [DOI] [PubMed] [Google Scholar]
- 31.Majerus P W. Inositol phosphate biochemistry. Annu Rev Biochem. 1992;61:225–250. doi: 10.1146/annurev.bi.61.070192.001301. [DOI] [PubMed] [Google Scholar]
- 32.Martins L O, Carreto L S, Da Costa M S, Santos H. New compatible solutes related to di-myo-inositol-phosphate in order Thermotogales. J Bacteriol. 1996;178:5644–5651. doi: 10.1128/jb.178.19.5644-5651.1996. [DOI] [PMC free article] [PubMed] [Google Scholar]
- 33.Martins L O, Santos H. Accumulation of mannosylglycerate and di-myo-inositol phosphate by Pyrococcus furiosus in response to salinity and temperature. Appl Environ Microbiol. 1995;61:3299–3303. doi: 10.1128/aem.61.9.3299-3303.1995. [DOI] [PMC free article] [PubMed] [Google Scholar]
- 34.Matsuhisa A, Suzuki N, Noda T, Shiba K. Inositol monophosphatase activity from the Escherichia coli suhB gene product. J Bacteriol. 1995;177:200–205. doi: 10.1128/jb.177.1.200-205.1995. [DOI] [PMC free article] [PubMed] [Google Scholar]
- 35.McAllister G, Whiting P, Hammond E A, Knowles M R, Atack J R, Bailey F J, Maigetter R, Ragan C I. cDNA cloning of human and rat brain myo-inositol monophosphatase: expression and characterization of the human recombinant enzyme. Biochem J. 1992;284:749–754. doi: 10.1042/bj2840749. [DOI] [PMC free article] [PubMed] [Google Scholar]
- 36.Meek J L, Rice T J, Anton E. Rapid purification of inositol monophosphate phosphatase from beef brain. Biochem Biophys Res Commun. 1988;156:143–148. doi: 10.1016/s0006-291x(88)80816-7. [DOI] [PubMed] [Google Scholar]
- 37.Moreno F, Corrales S, Garcia Blanco F, Gore M, Rees-Milton K, Churchich J E. Reversible denaturation of myo-inositol monophosphatase: the stability of metal binding loop. Eur J Biochem. 1996;240:435–442. doi: 10.1111/j.1432-1033.1996.0435h.x. [DOI] [PubMed] [Google Scholar]
- 38.Pappenberger G, Schurig H, Jaenicke R. Disruption of an ionic network leads to accelerated thermal denaturation of d-glyceraldehyde-3-phosphate dehydrogenase from the hyperthermophilic bacterium Thermotoga maritima. J Mol Biol. 1997;274:676–683. doi: 10.1006/jmbi.1997.1421. [DOI] [PubMed] [Google Scholar]
- 39.Parthasarathy L, Vadnal R E, Ramesh T G, Shyamaladevi C S, Parthasarathy R. myo-Inositol monophosphatase from rat testes: purification and properties. Arch Biochem Biophys. 1993;304:94–101. doi: 10.1006/abbi.1993.1326. [DOI] [PubMed] [Google Scholar]
- 40.Parthasarathy R, Parthasarathy L, Vadnal R. Brain inositol monophosphatase identified as a galactose 1-phosphatase. Brain Res. 1997;778:99–106. doi: 10.1016/s0006-8993(97)01042-1. [DOI] [PubMed] [Google Scholar]
- 41.Pollack S J, Atack J R, Knowles M R, McAllister G, Ragan C I, Baker R, Fletcher S R, Iversen L L, Broughton H B. Mechanism of inositol monophosphatase, the putative target of lithium therapy. Proc Natl Acad Sci USA. 1994;91:5766–5770. doi: 10.1073/pnas.91.13.5766. [DOI] [PMC free article] [PubMed] [Google Scholar]
- 42.Ramakrishnan V, Verhagen M F J M, Adams M W W. Characterization of di-inositol-1,1′-phosphate in the hyperthermophilic bacterium Thermotoga maritima. Appl Environ Microbiol. 1997;63:347–350. doi: 10.1128/aem.63.1.347-350.1997. [DOI] [PMC free article] [PubMed] [Google Scholar]
- 43.Rana R S, Hokin L E. Role of phosphoinositides in transmembrane signaling. Physiol Rev. 1990;70:115–161. doi: 10.1152/physrev.1990.70.1.115. [DOI] [PubMed] [Google Scholar]
- 44.Saudek V, Vincendon P, Do Q T, Atkinson R A, Sklenar V, Pelton P D, Piriou F, Ganzhorn A J. 7Li nuclear magnetic resonance study of lithium binding to myo-inositol monophosphatase. Eur J Biochem. 1996;240:288–291. doi: 10.1111/j.1432-1033.1996.0288h.x. [DOI] [PubMed] [Google Scholar]
- 45.Shiba K, Ito K, Yura T. Mutation that suppresses the protein export defect of the secY mutation and causes cold-sensitive growth of Escherichia coli. J Bacteriol. 1984;160:696–701. doi: 10.1128/jb.160.2.696-701.1984. [DOI] [PMC free article] [PubMed] [Google Scholar]
- 46.Szilagyi A, Zavodszky P. Structure basis for the extreme thermostability of d-glyceraldehyde-3-phosphate dehydrogenase from Thermotoga maritima: analysis based on homology modeling. Protein Sci. 1995;8:779–789. doi: 10.1093/protein/8.8.779. [DOI] [PubMed] [Google Scholar]
- 47.Takimoto K, Okada M, Matsuda Y, Nakagawa H. Purification and properties of myo-inositol-1-phosphatase from rat brain. J Biochem. 1985;98:363–370. doi: 10.1093/oxfordjournals.jbchem.a135290. [DOI] [PubMed] [Google Scholar]
- 48.Tanner J J, Hecht R M, Krause K L. Determinations of enzyme thermostability observed in the molecular structure of Thermus aquaticusd-glyceraldehyde-3-phosphate dehydrogenase at 2.5 Å resolution. Biochemistry. 1996;35:2597–2609. doi: 10.1021/bi951988q. [DOI] [PubMed] [Google Scholar]
- 49.Van Leeuwen S H, van der Marel G A, Hensel R, van Boom J H. Synthesis of l,l-di-myo-inositol-1,1′-phosphate: a novel inositol phosphate from Pyrococcus woesei. Recl Trav Chim Pays-Bas Belg. 1994;113:335–336. [Google Scholar]
- 50.Woese C R, Kandler O, Wheelis M L. Towards a natural system of organisms: proposal for the domains Archaea, Bacteria and Eucarya. Proc Natl Acad Sci USA. 1990;87:4576–4579. doi: 10.1073/pnas.87.12.4576. [DOI] [PMC free article] [PubMed] [Google Scholar]
- 51.Yano R, Nagai H, Shiba K, Yura T. A mutation that enhances synthesis of sigma 32 and suppresses temperature-sensitive growth of the rpoH15 mutant of Escherichia coli. J Bacteriol. 1990;172:2124–2130. doi: 10.1128/jb.172.4.2124-2130.1990. [DOI] [PMC free article] [PubMed] [Google Scholar]


