

Abstract
In mammals, telomere protection is mediated by the essential protein TRF2, which binds chromosome ends and ensures genome integrity1,2. TRF2 depletion results in end-to-end chromosome fusions in all cell types that have been tested so far. Here we find that TRF2 is dispensable for the proliferation and survival of mouse embryonic stem (ES) cells. Trf2−/− (also known as Terf2) ES cells do not exhibit telomere fusions and can be expanded indefinitely. In response to the deletion of TRF2, ES cells exhibit a muted DNA damage response that is characterized by the recruitment of γH2AX—but not 53BP1—to telomeres. To define the mechanisms that control this unique DNA damage response in ES cells, we performed a CRISPR–Cas9-knockout screen. We found a strong dependency of TRF2-null ES cells on the telomere-associated protein POT1B and on the chromatin remodelling factor BRD2. Co-depletion of POT1B or BRD2 with TRF2 restores a canonical DNA damage response at telomeres, resulting in frequent telomere fusions. We found that TRF2 depletion in ES cells activates a totipotent-like two-cell-stage transcriptional program that includes high levels of ZSCAN4. We show that the upregulation of ZSCAN4 contributes to telomere protection in the absence of TRF2. Together, our results uncover a unique response to telomere deprotection during early development.
The protection of chromosome ends is essential for cellular proliferation and organismal homeostasis. This protection is carried out by the shelterin complex, which binds terminal telomeric repeats2 and prevents end-to-end chromosome fusions—an unstable chromosomal arrangement that curbs cellular viability and induces genome instability3. In mammals, TRF2 protects telomere ends by promoting the formation of a T-loop structure4,5 and by suppressing canonical non-homologous end joining (NHEJ) that would otherwise lead to chromosome end-to end fusions1,6. TRF2 (also known as TERF2) is a common essential gene required for proliferation across all cell lines tested to date (more than 700 cell lines; https://depmap.org), and depletion of Trf2 is lethal in mice1. The ubiquitous role of TRF2 derives from the fact that tissue-specific deletion of this protein results in rampant telomere fusions in a variety of settings, including proliferating epithelial cells and terminally differentiated neurons7,8. Given that all the studies to date have been confined to somatic cell types, we aimed to test whether the role of TRF2 is conserved in pluripotent stem cells. We generated mouse ES cells from TRF2 conditional knockout (Trf2f/f-creER) embryos that express a 4-hydroxytamoxifen (OHT)-inducible cre allele under the control of the ubiquitous Rosa26 promoter, in a manner similar to that previously described for mouse embryonic fibroblasts6.
The ES cells express the pluripotency marker OCT4 and can be differentiated in vitro (Extended Data Fig. 1a–d). As an isogenic control, we established an immortalized differentiated cell line from the TRF2-conditional ES cells (Extended Data Fig. 1a, b). We term the resulting cell line fibroblasts-like induced cells (FLICs), on the basis of their phenotypic similarity to fibroblasts. We treated ES cells and FLICs in parallel with OHT to induce Cre-mediated TRF2 deletion and assayed both cell types for cell growth. The differentiated cells showed the expected growth arrest in response to TRF2 deletion, whereas the ES cells continued to proliferate (Fig. 1a). We performed a colony formation assay on OHT-treated ES cells and FLICs (see schematics in Extended Data Fig. 1e) and—notably—we could not recover any TRF2-null FLICs, but TRF2 depletion had no effect on the colony formation capacity of ES cells (Extended Data Fig. 1e). Furthermore, genotyping PCRs confirmed that the surviving ES cells were knockout for TRF2 (Extended Data Fig. 1e). Although the isolated Trf2−/− ES cell clones are viable and can be propagated indefinitely, we noticed a consistent growth defect when compared to TRF2-proficient ES cells (Extended Data Fig. 1f), in agreement with the phenotype seen upon treatment with OHT (Fig. 1a). TRF2-null ES cells can form embryoid bodies, but they lose viability immediately upon differentiation (Extended Data Fig. 1b, c).
Fig. 1 |. Trf2−/− ES cells are viable and do not exhibit end-to-end chromosome fusions.
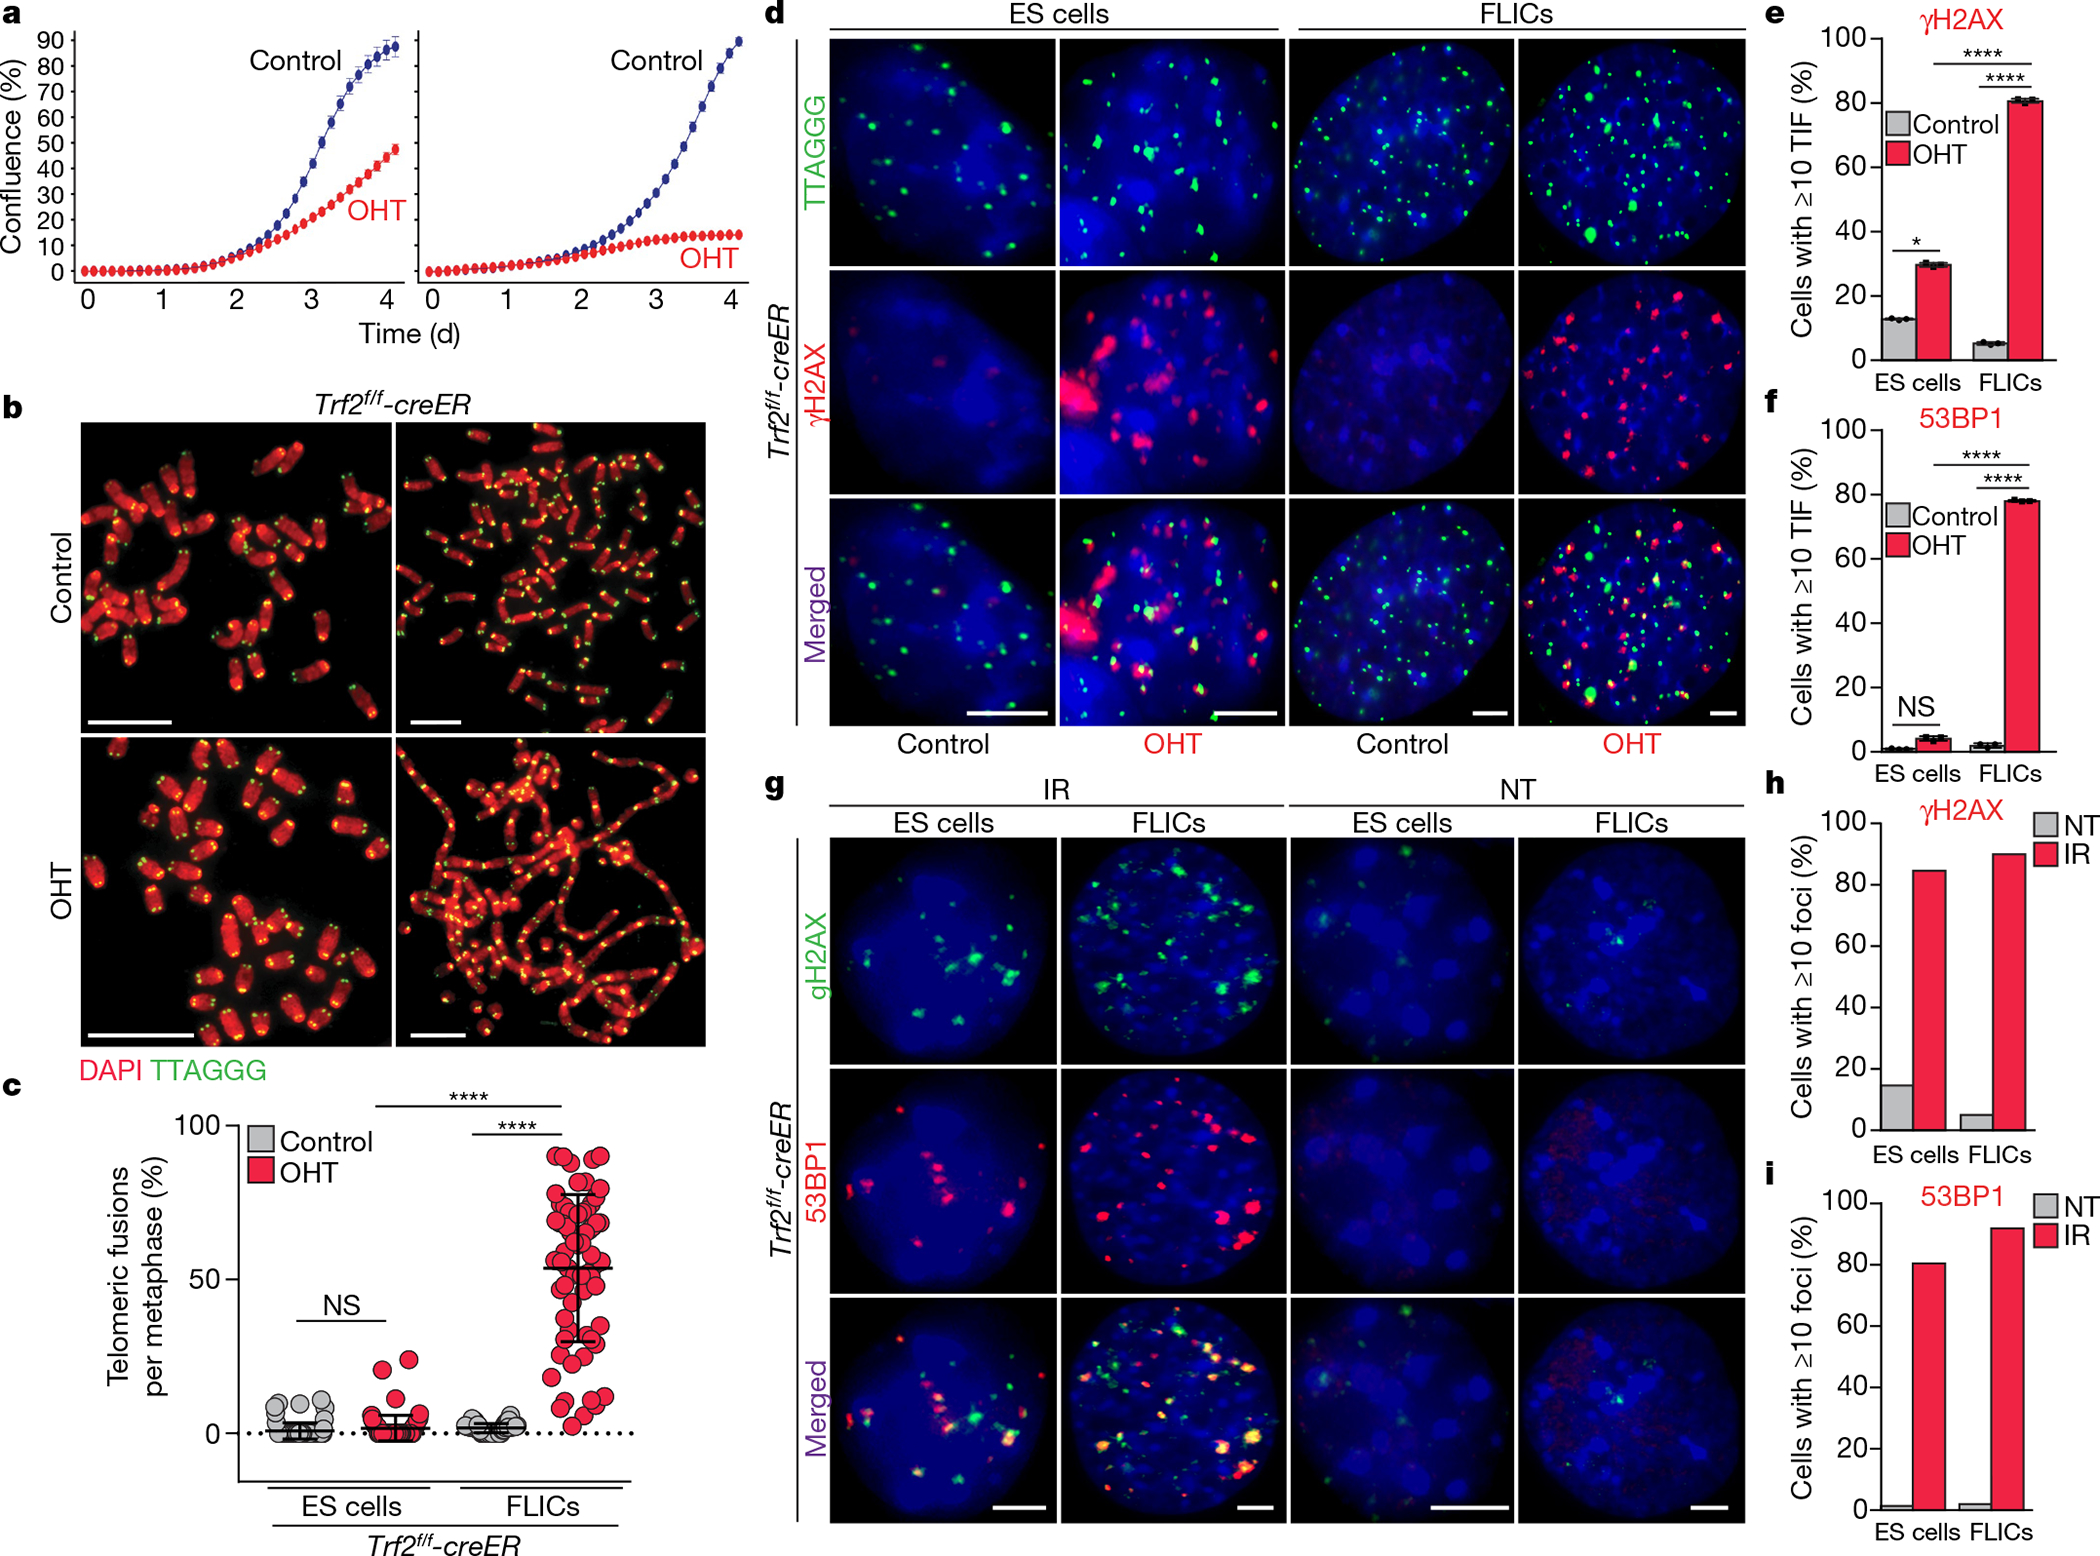
a, Growth of Trf2f/f ES cells (left) and FLICs (right) before (control) or after Cre induction (OHT). Mean and s.d. are derived from the analysis of 25 images per condition. b, Metaphases derived from TRF2-proficient (control) or TRF2-deficient (OHT) ES cells (left panels) and FLICs (right panels). Scale bars, 10 μm. c, Scatter plot representing the distribution of telomeric fusions. Each dot represents the percentage of telomeres fused in one metaphase spread; for detailed information, see Supplementary Table 1, Source Data for Fig. 1 (n = 3 independent experiments). d, Representative immunofluorescence and fluorescence in situ hybridization (IF–FISH) for γH2AX (red) and telomeres (green) in Trf2f/f ES cells and FLICs treated as indicated. Scale bar, 4 μm. e, f, Quantification of the percentage of cells with more than 10 γH2AX (e) or 53BP1 (f) foci colocalizing with telomeres, detected as in d. Representative images of IF–FISH for 53BP1 are reported in Extended Data Fig. 2e. TIF, telomere- dysfunction-induced foci. g, Representative immunofluorescence images for 53BP1 (red) and γH2AX (green) in ES cells and FLICs before (not treated (NT)) or after irradiation (IR) (2.5 Gy). Scale bar, 4 μm. h, i, Percentages of cells with more than 10 γH2AX (h) or 53BP1 (i) foci are shown. In all panels, mean is indicated with centre bars and s.d. with error bars. NS, non-significant (P ≥ 0.05), *P < 0.05, ****P < 0.0001, one-way analysis of variance (ANOVA).
To understand why the viability of ES cells was not affected by loss of TRF2, we analysed metaphase spreads derived from TRF2-null ES cells and FLICs. We found that TRF2-null ES cells did not accumulate significant levels of telomere fusions, whereas the isogenic Trf2−/− FLICs showed high levels of fusion (Fig. 1b, c, Supplementary Table 1). The notable absence of telomere fusions in TRF2-null ES cells provides an explanation for the viability of these cells, and suggests that TRF2 may not be essential for telomere protection in ES cells. To test this hypothesis, we assessed whether ES cells form telomere-dysfunction-induced foci in response to TRF2 depletion1. We found that Trf2−/− ES cells have a significant increase in the accumulation of γH2AX at telomeres (Fig. 1d, e), showing that TRF2-depleted telomeres are detected as sites of DNA damage in ES cells. Notably, the percentage of ES cells positive for γH2AX telomere-dysfunction-induced foci is about 2.5× lower than that seen in FLICs, which suggests that the response to TRF2 deletion in ES cells might be restricted to a subpopulation of cells. Consistent with this observation, we found that only a fraction of Trf2−/− ES cells accumulates phosphorylated KAP1, a well-established marker of activation of the DNA damage response (DDR)9 (Extended Data Fig. 2a, b). Colocalization analysis further confirmed that—in response to TRF2 deletion—approximately 25% of cells accumulate γH2AX and phosphorylated KAP1 at telomeres (Extended Data Fig. 2c). Notably, localization of 53BP1 to TRF2-depleted telomeres in ES cells was almost completely abolished (Fig. 1f, Extended Data Fig. 2e). Collectively, these data show that, in response to TRF2 deletion, only about 30% of TRF2-depleted ES cells activate a detectable DDR (Fig. 1d–f, Extended Data Fig. 2a–c). Given the established role for 53BP1 in promoting NHEJ-mediated telomere fusions, it is likely that the failure to recruit this DDR factor in ES cells explains the lack of end-to-end fusions10. Inhibition of ATM in ES cells does not significantly abolish the mild DDR activated by TRF2 depletion, which differs from what we observed in differentiated FLICs (Extended Data Fig. 2d, g). To test whether the incomplete DDR observed upon TRF2 depletion is an intrinsic property of pluripotent cells, we introduced double-strand breaks by gamma irradiation in ES cells and isogeneic FLICs. Both cell types showed similar levels of activated DDR, as shown by the formation of irradiation-induced γH2AX and 53BP1 foci, and the phosphorylation of KAP1 (Fig. 1g–i, Extended Data Fig. 2f, g). Furthermore, despite a slight delay in the kinetics of damage foci dissipation in ES cells, the kinetics of DNA repair is similar between FLICs and ES cells (Extended Data Fig. 2h). We conclude that the lack of telomere fusions in TRF2-depleted ES cells is not caused by an intrinsic defect in the response of ES cells to DNA damage.
To identify factors that may have a key role in telomere protection in Trf2−/− ES cells, we performed a genome-wide synthetic lethal CRISPR–Cas9-knockout screen (Fig. 2a, Extended Data Fig. 3a). To ensure the efficiency of the screen, we verified that guide RNAs (gRNAs) targeting genes that are essential for the proliferation of ES cells were depleted at a similar rate between TRF2-proficient and TRF2-deficient cells (Fig. 2a, Extended Data Fig. 3b). Next, we selected genes that are essential (β-score < −0.75) for TRF2-null ES cells but do not affect the growth of TRF2-proficient cells (β-score > −0.25). We found a small subset of genes (13) that were synthetically lethal with TRF2-deficient cells in 3 independent experiments (Fig. 2b, Extended Data Fig. 3a, b, Source Data for Fig. 2, Supplementary Table 3). In this list we found Pot1b, which encodes a telomere-binding protein that is dispensable for telomere protection in somatic cells11,12. Additionally, we identified Brd2, which encodes a bromodomain and extra terminal domain (BET) transcriptional regulator13 that has previously been shown to be involved in the control of the ATM signalling pathway14. We generated Pot1b−/− and Brd2−/− TRF2-conditional ES cells (Extended Data Fig. 3c) and, as anticipated, found that these genes are not essential for the proliferation of ES cells11 (Fig. 2c, d). However, upon TRF2 depletion, a severe growth inhibition was observed that confirmed that both Pot1b and Brd2 are synthetically lethal with Trf2 in ES cells (Fig. 2c, d).
Fig. 2 |. A synthetic lethality CRISPR screen in TRF2-deficient ES cells.

a, Experimental outline of the CRISPR–Cas9 screen we performed. Trf2f/f-creER ES cells were infected with a genome-wide gRNA library; a portion of the cells was collected after selection (day 0); and the remaining cells were either treated with OHT to induce TRF2 deletion (OHT) or left untreated (control), and collected two weeks later (day 14). Cells infected with gRNAs targeting essential genes are depicted in magenta; cells infected with gRNA against genes that are synthetically lethal with TRF2 are shown in blue; and the remaining cells are shown in black. b, Scatter plot showing the average essentiality scores (β-score) in OHT-treated (y axis) and control (x axis) ES cells for all the genes targeted (about 23,000). Genes with a β-score below −0.75 are considered essential. Genes that have previously been reported as essential in ES cells are labelled in magenta, and genes that we found to be synthetically lethal with TRF2 are labelled in blue. Oct4 is also known as Pou5fl. c, Growth of ES cells with the indicated genotypes was monitored by confluence in an Incucyte S3. Cells were monitored starting from time of OHT-mediated TRF2 deletion (day 0). Plots show the time between day 4 and day 11. Mean and s.d. are derived from the analysis of 49 images per condition. d, Clonogenic survival assay by crystal violet was performed on cells of the indicated genotypes and treatment.
To define the role of POT1B in promoting the survival of TRF2-null ES cells, we analysed the chromosomes of Trf2−/−Pot1b−/− codepleted ES cells. Pot1b−/− ES cells did not show telomeric defects, consistent what has previously been reported in fibroblasts11. However, codepletion of POT1B and TRF2 in ES cells resulted in frequent (12%) telomere fusions (Fig. 3a, b, Supplementary Table 1). Importantly, Pot1b−/− ES cells do not show any alteration in pluripotency or cell-cycle distribution (Fig. 3c, Extended Data Fig. 4a), which excludes the possibility that artefacts arose owing to alterations in differentiation or proliferation status. Moreover, the telomere fusions that occur in Trf2−/−Pot1b−/− ES cells are mediated by the classical NHEJ pathway, as codepletion of ligase IV in this genetic background suppresses the fusion formation (Extended Data Fig. 4b, c, Supplementary Table 1). TRF2 depletion in Pot1b−/− ES cells resulted in a significant increase in the fraction of cells that display telomere-dysfunction-induced foci (Fig. 3d–f, Extended Data Fig. 5a). In particular, we noticed a significant accumulation of 53BP1 at Trf2−/−Pot1b−/− telomeres (Fig. 3d–f). This led us to speculate that the essential role of POT1B in TRF2-null ES cells could either be a result of its ability to suppress the ATR-dependent signalling pathway (a function that it shares with its paralogue, POT1A11,15) or the result of a unique function of POT1B. To distinguish between these hypotheses, we generated Pot1a−/− ES cells and found that in these cells—similarly to Pot1b−/− ES cells—TRF2 depletion results in frequent (9%) telomere fusions (Extended Data Fig. 5b, Supplementary Table 1). Collectively, these data show that POT1A and POT1B are required to protect telomeres in the absence of TRF2 in ES cells, and point to the suppression of ATR as the potential mechanism by which this protection is achieved15,16. To test this hypothesis, we treated Trf2−/−Pot1b−/− and Trf2−/−Pot1a−/− ES cells with an ATR kinase inhibitor. We noticed complete suppression of telomere fusions by ATR inhibition (Extended Data Fig. 5c–e, Supplementary Table 1), which further confirmed our hypothesis. By contrast, ATM inhibition in the same settings had only a limited effect on fusion suppression (Extended Data Fig. 5d).
Fig. 3 |. POT1B and BRD2 are required for telomere protection in the absence of TRF2.

a, Representative images of metaphases from TRF2-depleted and control ES cells of indicated genotypes; percentages of telomeres fused for each genotype are shown in the top right corner. Scale bars, 10 μm. b, Scatter plot representing the distribution of telomeric fusions. Each dot represents the percentage of telomeres fused in one metaphase spread; for detailed information, see Supplementary Table 1, Source Data for Fig. 3. c, Representative fluorescence-activated cell sorting (FACS) plots (y axes, number of cells detected; x axes, intensity of propidium iodide (PI) staining), showing the cell-cycle profiles of ES cells of indicated genotypes. The G1 phase of the cell cycle is marked in blue. d, Representative IF–FISH for 53BP1 (red) and telomeres (green) in ES cells of the indicated genotype and treatment. Scale bar, 4 μm. e, Quantification of the percentage of cells with more than 10 53BP1 foci colocalizing with telomeres, detected as in d. f, Quantification of the percentage of cells with more than 10 γH2AX foci colocalizing with telomeres, detected as in d. g, Representative western blotting analysis of ES cells untreated (−) or treated with OHT (+) and collected 4 days after treatment. Where indicated, cells were treated with an ATM inhibitor (ATMi). All data panels in the figure are representative of three experiments. NS, non-significant (P ≥ 0.05), *P < 0.05, **P < 0.01, ***P < 0.001, ****P < 0.0001, one-way ANOVA.
BRD2 has previously been shown to suppress activation of the DDR in cancer cell lines at the level of ATM activation14,17. We found that Brd2−/− ES cells have a high level of basal DDR, as shown by KAP1 phosphorylation (Fig. 3g, Extended Data Fig. 5f, g). Therefore, we speculated that the synthetic lethality observed in Trf2−/−Brd2−/− cells (Fig. 2c, d) could be explained by an increased DDR activation. In agreement with this hypothesis, we found that when TRF2 is depleted in Brd2−/− ES cells, there is a strong activation of the DDR (Fig. 3g, Extended Data Fig. 5f, g) that is mediated—at least in part—by ATM (Fig. 3g). On the basis of these data, we conclude that BRD2 depletion results in increased basal activation of the DDR that, when coupled with TRF2 depletion, results in end-to-end chromosomal fusions and loss of viability (Fig. 3a, Supplementary Table 1). These data suggest that genetic perturbations that trigger either ATR activation (Pot1b−/−) or potentiate the ATM signalling pathway (Brd2−/−) can restore a ‘canonical’ response to TRF2 depletion in ES cells.
The identification of Pot1b−/− and Brd2−/− as synthetically lethal with TRF2 knockout does not address the fundamental question of why TRF2 deletion in ES cells is well-tolerated, particularly because this is in stark contrast to all cell lines tested to date (>700; https://depmap.org). Both Pot1b and Brd2 are ubiquitously expressed and their function is not restricted to ES cells. To identify potential ES-cell-specific factors that might modulate the response to telomere dysfunction, we performed transcriptional profiling of ES cells and isogenic FLICs in the presence or absence of TRF2. To minimize secondary effects induced by growth inhibition or end-to-end chromosome fusions, we performed these experiments three days after OHT-mediated deletion of TRF2. At this time point, differentiated cells display high levels of DNA damage at telomeres, but minimal levels of telomere fusions1. We detected 73 deregulated genes (>2 fold change and P < 0.005) in ES cells, including the expected loss of TRF2 expression (Fig. 4a, Extended Data Fig. 6a). Notably, apart from TRF2, we found no overlap between genes with altered expression in ES cells and FLICs (Extended Data Fig. 6a). The vast majority of differentially expressed genes in TRF2-depleted ES cells are genes expressed in totipotent two-cell-stage embryos18 (Fig. 4a, Supplementary Table 4), a transcriptional signature that has previously been detected in a subpopulation of two-cell-like ES cells18–20. These data suggest that upon TRF2 deletion there is an expansion of two-cell-like cells or a direct upregulation of genes that are usually expressed in two-cell-stage embryos.
Fig. 4 |. Two-cell-signature genes are involved in telomere protection of ES cells.
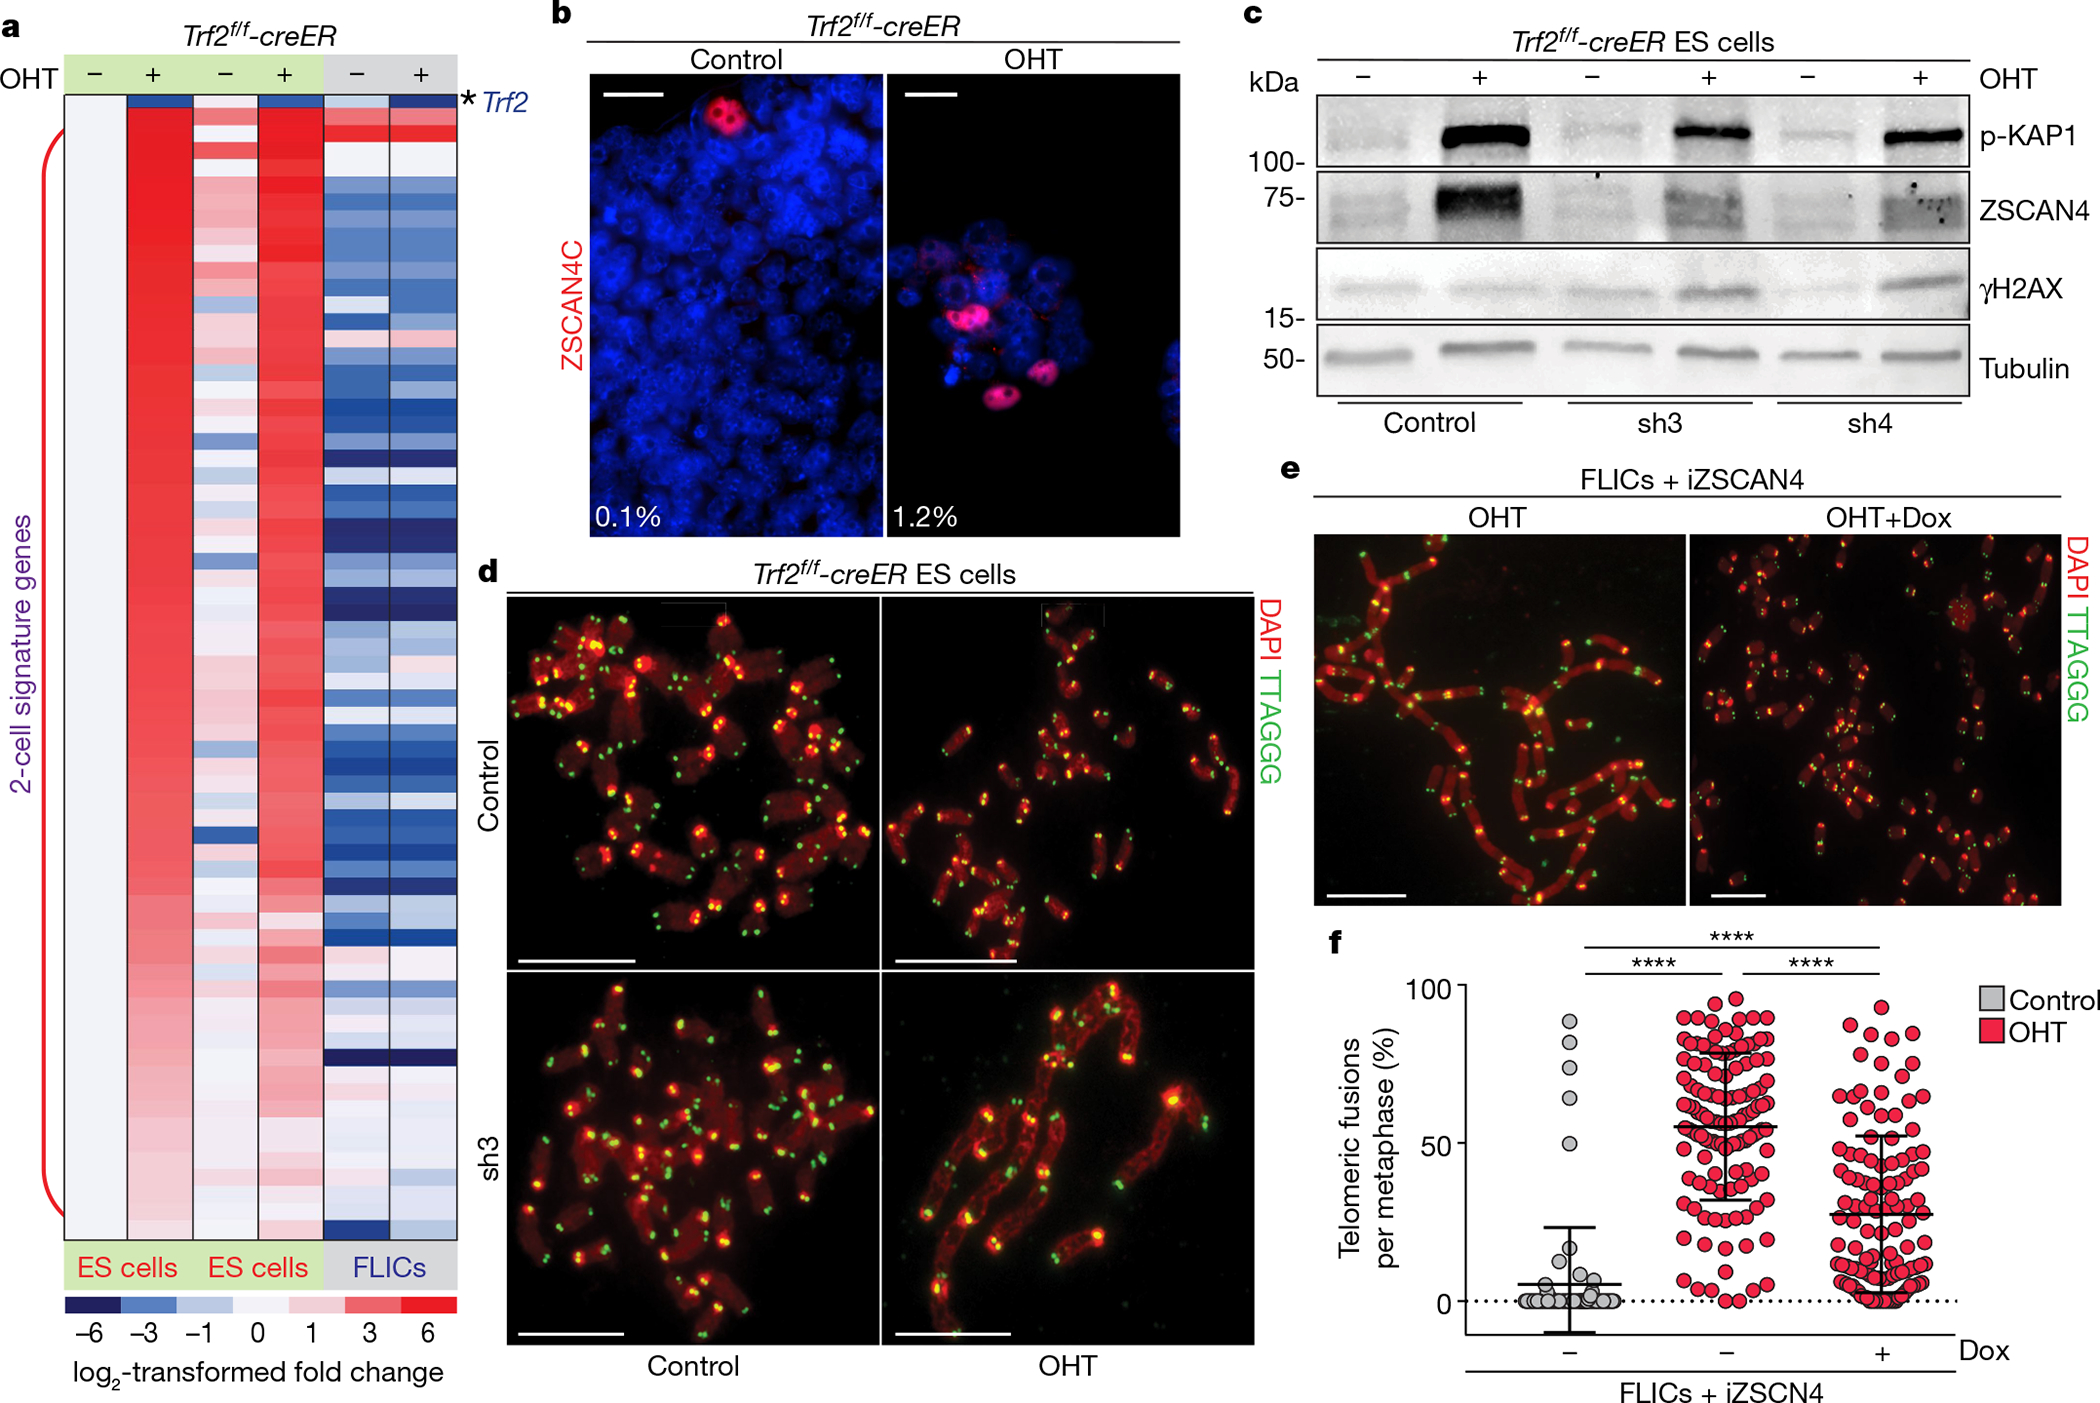
a, Heat map displaying the expression levels of 2-cell-signature genes between control and OHT-treated ES cells (two independent cell lines) and FLICs (one cell line). Expression levels are normalized to the values of the control ES cell line. b, Representative immunofluorescence staining for ZSCAN4C in control and OHT-treated ES cells. Percentages of ZSCAN4-positive cells are shown in bottom left corner. c, Western blotting analysis of control and OHT-treated ES cells expressing either a control shRNA or two independent shRNAs against Zscan4c (sh3 and sh4). d, Metaphase spreads derived from ES cells of the indicated genotypes and treatment. Additional information is provided in Supplementary Table 1, Source Data for Fig. 4. e, Representative metaphases derived from doxycycline-inducible-ZSCAN4 (iZSCAN4) FLICs, treated with doxycycline (+Dox) or not, were collected 4 days after treatment with OHT. f, Scatter plot representing the distribution of telomeric fusions. Each dot represents the percentage of telomeres fused in one metaphase spread; for detailed information, see Supplementary Table 1 and Source Data for Fig. 4. All data panels in the figure are representative of at least three experiments. NS, non-significant (P ≥ 0.05), P < 0.05, ****P < 0.0001, one-way ANOVA.
Among the most-upregulated genes in TRF2-null ES cells, we found the zinc finger and SCAN domain-containing protein 4 (Zscan4) gene cluster—which comprises six paralogous genes (Zscan4a, Zscan4b, Zscan4c, Zscan4d, Zscan4e and Zscan4f; collectively called Zscan421)—with an 18-fold induction in expression for all the isoforms detected (Extended Data Fig. 6a). The Zscan4 cluster is essential in ES cells, and promotes telomere lengthening and genome stability18,21–23. Zscan4 is expressed in only a small fraction of ES cells at any given time, but within nine passages every cell in culture displays transient expression of Zscan422. To monitor the expression level of Zscan4 in TRF2-depleted ES cells, we used an antibody against ZSCAN4C and observed a tenfold induction in the fraction of cells expressing Zscan4 (Fig. 4b). Given the transient nature of expression of Zscan4 in ES cells, a tenfold induction of ZSCAN4-positive cells could have an effect on the vast majority of cells in culture. By contrast, TRF2 depletion in FLICs does not result in increased expression of Zscan4, as seen by RNA sequencing and western blotting (Extended Data Fig. 6a, e). To test whether the induction of Zscan4c has a functional role in TRF2-depleted ES cells, we used two independent short hairpin (sh) RNAs to reduce its expression (Fig. 4c). We found that downregulation of Zscan4c expression resulted in telomere fusions (approximately 8%) when combined with TRF2 depletion (Fig. 4d, Extended Data Fig. 6b, Supplementary Table 1). These data show that the partial depletion of one of the Zscan4 paralogues (Zscan4c) is sufficient to trigger telomere fusions in TRF2-deleted ES cells that are still pluripotent (Extended Data Fig. 6c), which suggests that induction of the Zscan4 gene cluster is involved in telomere protection in ES cells. Next, we tested whether expression of Zscan4 in differentiated cells could mitigate the telomere-dysfunction phenotypes induced by TRF2 deletion. To this end, we generated FLICs in which the expression of Zscan4c is under the control of a doxycycline-inducible promoter (Extended Data Fig. 6d). We found that induced ZSCAN4C is sufficient to reduce the levels of telomere fusions by approximately 50% (Fig. 4e, f, Supplementary Table 1). These data show that expression of Zscan4 in differentiated cells can significantly suppress the levels of telomere fusion triggered by TRF2 loss. The reduction in telomere fusions in FLICs was not associated with a reduction in the DDR, as seen by levels of phosphorylated KAP1 and γH2AX (Extended Data Fig. 6e), and 53BP1 telomere-dysfunction-induced foci (Extended Data Fig. 6g, h). Moreover, Zscan4c induction in FLICs did not affect cell proliferation (Extended Data Fig. 6f) or cell cycle progression (Extended Data Fig. 7a). We observed a substantial upregulation of the levels of exogenous Zscan4C upon TRF2 depletion in differentiated cells (Extended Data Fig. 6e), which suggests a role for post-transcriptional mechanism(s) in the expression of this gene. A possible mechanism by which the ZSCAN4 proteins could be involved in telomere protection is through their previously described role in promoting DNA demethylation and recombination-based telomere elongation22,23. In this scenario, rather than engaging in NHEJ-mediated telomere fusions, Trf2−/− ES cells would engage in telomere elongation22,23. In support of this hypothesis, we found that Trf2−/− clonal isolates show telomere elongation when compared to TRF2-proficient (Trf2f/−) clones isolated in the same experiment and subjected to quantitative fluorescent in situ hybridization (Q-FISH) and flow cytometry with FISH (Flow-FISH) analyses (Extended Data Fig. 7b, c). Altogether, these data suggest that the induction of the Zscan4 genes—and potentially of additional genes that are normally expressed in totipotent two-cell-stage cells—is involved in telomere protection in ES cells.
In conclusion, our study shows that telomere protection in ES cells is not exclusively dependent on TRF2 but is instead mediated by attenuation of the ATM and/or ATR signalling pathways at chromosome ends, and by the expression of a specific set of totipotent genes (including the Zscan4 cluster). We suggest that expression of Zscan4, and potentially of additional genes that are associated with two-cell-stage embryos, provides ES cells with a unique mechanism of telomere protection. We propose that in ES cells that express Zscan4, TRF2-depleted telomeres are elongated rather than being processed as sites of DNA damage (see model in Extended Data Fig. 8). Given that specific cancer cells can adapt to high levels of telomere dysfunction, it is possible that mechanisms analogous to the ones we uncovered here in ES cells might be hijacked in pathological conditions. The finding that ES cells transition towards a totipotent two-cell-embryo-like state in response to TRF2 depletion raises the possibility that a similar mechanism might be involved in the induction of phenotypes associated with critically short telomeres. Consistent with this hypothesis, ES cells with critically short telomeres show genome-wide epigenetic changes and have impaired differentiation potentials24–26. Therefore, our discovery of a link between telomere protection and the cellular differentiation program provides a platform from which to further our understanding of disorders in telomere biology.
Online content
Any methods, additional references, Nature Research reporting summaries, source data, extended data, supplementary information, acknowledgements, peer review information; details of author contributions and competing interests; and statements of data and code availability are available at https://doi.org/10.1038/s41586-020-2959-4
Methods
No statistical methods were used to predetermine sample size. The experiments were not randomized, but investigators were blinded to allocation during experiments and outcome assessment. All cells were authenticated by morphology and genomic sequencing following PCR reactions.
ES cell derivation and culture
ES cells were derived from Trf2f/+-Rosa26-creER crosses (C57BL/6 × 129F1 genetic background)27, mice were housed and analysed according to protocols approved by the TSRI Institutional Animal Care and Use Committee (The Scripps Research Institute). Female mice were super-ovulated using pregnant mare serum and human choriogonadotropin. Embryos at 0.5 days post coitum were isolated and cultured in KSOM (Sigma-Aldrich) for 3 days to isolate blastocysts. ES cells were derived in 2i-containing medium (1 μM PD03259010 and 3 μM CHIR99021, Sigma Aldrich) (PMID: 18497825) and once established, were grown on 0.1% gelatin at 37 °C and 5% CO2 in ES medium (DMEM (Gibco) supplemented with 15% FBS (Omega Scientific), 1,000 U/ml LIF (Millipore Sigma), 2i (1 μM PD03259010, 3 μM CHIR99021, Sigma Aldrich), 0.1 mM non-essential amino acids (Gibco), 1 mM sodium pyruvate (Gibco), 0.143 mM 2-β-mercaptoethanol (Millipore Sigma) and 0.5 mg/ml penicillin, streptomycin and l-glutamine (Gibco)). When indicated, cells were exposed to 2.5 Gy ionizing radiation and—unless indicated otherwise—collected 30 min after irradiation. Induction of Cre activity was achieved by supplementing cells with OHT (Sigma) (5 μM) 96 h before cell collection, unless stated otherwise. Where indicated cells were treated 48 h before collection with ATM inhibitor (KU-60019, Selleckchem) or ATR inhibitor (AZ20, Selleckchem) at a final concentration of 1μM, unless stated otherwise. To generate knockout cell lines, ES cells were transfected with gRNAs and a Cas9-expressing plasmid (pX330, 73171, Addgene) by nucleofection (Mouse Embryonic Stem Cell Nucleofector Kit, Lonza). Sequences of the single-guide RNAs are available upon request to the corresponding author. Single-cell-derived cultures were screened by PCR for the desired genomic deletion and verified by Sanger sequencing. At least two independent clones were derived lines were tested, and at least one of each genotype was used for further analyses. All cell lines were tested for mycoplasma contamination.
Generation of embryoid bodies and FLICs
ES cells were cultured in drops for 2 days in ES medium without LIF. The resulting spheroids were collected and cultured for an additional 3 days in suspension in non-treated plates in ES medium without 2i and without LIF. Embryoid bodies were transferred to gelatin-coated plates to induce differentiation and imaged using an IncuCyte S3 2018C.
To establish FLICs, differentiated embryoid bodies were trypsinized and cultured in gelatin-coated plates in mouse embryonic fibroblast medium (DMEM supplemented with 10% FBS) for 4 passages before immortalization with SV40-LargeT antigen, as previously described1.
Live-cell imaging and cell growth analysis
Cell growth analysis was determined using an IncuCyte S3 live-cell system (Essen Bioscience) based on confluency. Imaging was performed as follows: ES cells and FLICs at 3-h intervals using a 10× objective; and embryoid bodies (≤100 per genotype) at 4-h intervals with a 4× objective. At least two biologically independent experiments per condition were analysed for each genotype.
Lentiviral infections
ES cells were infected with lentiviruses expressing shRNAs targeting Zscan4c (Millipore Sigma) or a control empty vector (PLKO). The following shRNA target sites were used: Zscan4c-sh1: 5′-CCAGATAATGAGCAGATGCC ACTCGAGTGGCATCTGCTCATTATCT GG-3′; Zscan4c-sh3: 5′-GAATGCAACAACTCTTGTAATCTCGAGAT TACAAGAGTTGTTGCATTCT-3′; and Zscan4c-sh4: 5′-CGCCAATC ATCCACTTACCAT CTCGAGATGGTAAGTGGATGATTGGCG-3′.
Doxycycline-inducible Zscan4c expression
The PiggyBac PB-TRE-Zscan4c was cloned from the PB-TRE-dCas9-VPR plasmid (63800, Addegene)28. To generate stable integration, FLICs were co-transfected PB-TRE-Zscan4c and a transposase-containing plasmid using Lipofectamine 2000 Transfection Reagent (Thermo Fisher Scientific).
FACS analysis
For cell cycle analysis fixed cells were stained with PI, analysed on a FACSCanto II flow cytometer (BD Biosciences) and cell-cycle profile was performed using the Watson pragmatic algorithm (FlowJo v.10.6). Telomere length by Flow-FISH was performed as previously described29, using an AlexaFluor 488-TelC (TAACCC) PNA probe (PNA Bio Inc.). FACS sequential gating strategies are provided in Source Data for Fig. 3c, Extended Data Fig. 7a, c.
Western blotting
Cells lysates resuspended in Laemmli buffer (100 mM Tris-HCl, pH 6.8, 200 mM dithiothreitol, 3% SDS, 20% glycerol and 0.05% bromophenol blue) were separated on a Mini-PROTEAN TGX Stain-Free Precast Gel (Bio-Rad), transferred to a nitrocellulose membrane and incubated with the following primary antibodies: p-KAP1 (1:1,000 dilution, A300-767A, Bethyl); CHK2 (1:250 dilution; 611570, BD Transduction Laboratories); γH2AX (1:1,000 dilution, 05–636, Millipore); ZSCAN4C (1:1,000 dilution, AB4340, Millipore Sigma); and tubulin (1:5,000 dilution, T5168, Millipore Sigma). Protein signals were visualized on a ChemiDoc MP Imaging System (Bio-Rad) using the following secondary antibodies: mouse DyLight-680 or rabbit DyLight-800 antibodies (1:5,000 dilution, Invitrogen). Imaging processing to remove non-relevant portions was performed using Adobe Photoshop CC 2020. Uncropped and unprocessed images are provided in the Source Data for Figs. 3g, 4c, Extended Data Figs. 2f, g, 6e.
Immunofluorescence and IF–FISH
Immunofluorescence and IF–FISH were performed as previously described6. In brief, cells fixed with 2% paraformaldehyde were incubated with the following primary antibodies, all at 1:1,000 dilution: OCT3/4 (sc-5279, Santa Cruz Biotechnology), p-KAP1 (A300-767A, Bethyl) or ZSCAN4C (AB4340, Millipore Sigma), γH2AX (05–636, Millipore), 53BP1 (NB100-304, Novus Biological). For IF–FISH, following secondary antibody staining, cells were fixed, denatured at 72 °C and hybridized with the AlexaFluor 488-TelC (TAACCC) PNA probe (PNA Bio). Slides were then mounted using ProLong Gold antifade reagent (Life Technologies), and images were acquired using a Zeiss Axio Imager M2 and an Axiocam 702 camera and ZEN 2.6 (blue edition) software. For ES cells, Z-stack images were acquired and displayed as maximum intensity projections. Final figures were assembled using Adobe Photoshop CC 2020 versions 21.0.1.47 and 21.2.1.265 and Adobe Illustrator 2020 24.2. Complete details regarding the number of cells analysed for each figure are provided in Supplementary Table 2.
FISH on metaphase spreads
Telomeric FISH on metaphase spreads were performed as previously described1. In brief, cells were treated with colcemid (0.2 μg/ml) 2 h before collection, swelled in KCl (75 mM), fixed in methanol:acetic acid (3:1) solution, and metaphases were spread on glass slides. Following hybridization with an AlexaFluor 488-TelC (TAACCC) PNA probe (PNA Bio) and DNA counterstain (DAPI) images were captured on a Zeiss Axio Imager. For Q-FISH, telomere images were taken with fixed exposure parameters, and fluorescence intensity was measured with the ImageJ quantification module, version: Java 1.8.0 112 (64-bit). Images were processed using Adobe Photoshop CC 2020. Details on the number of chromosomes and fusions scored in each experiment are provided in Supplementary Table 1 and Source Data for Figs. 1c, 3b, 4f, Extended Data Figs. 5b, c, 6b.
Statistical analysis
Statistical analyses were performed using GraphPad PRISM version 7.0 software (GraphPad). Data represent mean ± s.d. of three independent experiments, unless stated otherwise. P < 0.05 was considered statistically significant, and P values were assessed by one-way ANOVA, multiple comparisons. Sample size was not predetermined.
CRISPR–Cas9 screen
Three independent genome-wide CRISPR screens were performed using a genome-wide CRISPR Knockout Library (73633-LVC, Addgene) in ES cells expressing Cas9 (no. 52962, Addgene). Following selection, a portion of cells was collected as initial time point (T0) and the rest of the cells were either treated with OHT to induce CRE activity or left untreated and cultured for 14 days before collection for the final time point (T14). Genomic DNA was isolated using a DNeasy Blood and Tissue Kit (Qiagen), and sgRNAs were PCR-amplified using primers containing Illumina adapters. Samples were sequenced on an Illumina NextSeq platform and the resulting reads were analysed using MAGeCK30. An essentiality score (β-score) for each gene was calculated using the MAGeCK -mle module. Average β-scores were calculated from three independent experiments. Potential synthetically lethal genes were defined as follows31: (1) having a negative (<−0.75) β-scores in the OHT samples in all the experiments; (2) having a ‘neutral’ β-score (> −0.25 and lower than 1) in the control samples in all the experiments; and (3) having a difference in β-scores (control – OHT) greater than 1 in all the experiments. Data were plotted using ggplot2.
RNA sequencing
RNA extraction of control and OHT-treated Trf2f/f ES cells and FLICs was performed using RNeasy Plus Mini Kit (Qiagen) following the manufacturer’s protocol. RNA was then prepared for sequencing using a TruSeq Stranded Total RNA kit (Illumina). Sequence reads (20 million) from each cDNA library were mapped using Salmon (https://combine-lab.github.io/salmon/) and differentially expressed genes were identified using DEseq2 (version 1.27). Genes with more than a twofold change and a P value (Wald test) lower than 0.005 were designated as differentially expressed. Data were plotted using ggplot2.
Reporting summary
Further information on research design is available in the Nature Research Reporting Summary linked to this paper.
Data availability
All raw sequencing reads for RNA-seq are available on NCBI Gene Expression Omnibus under accession number GSE156534. Source data are provided with this paper.
Extended Data
Extended Data Fig. 1 |. Trf2−/− ES cells are not viable upon differentiation.
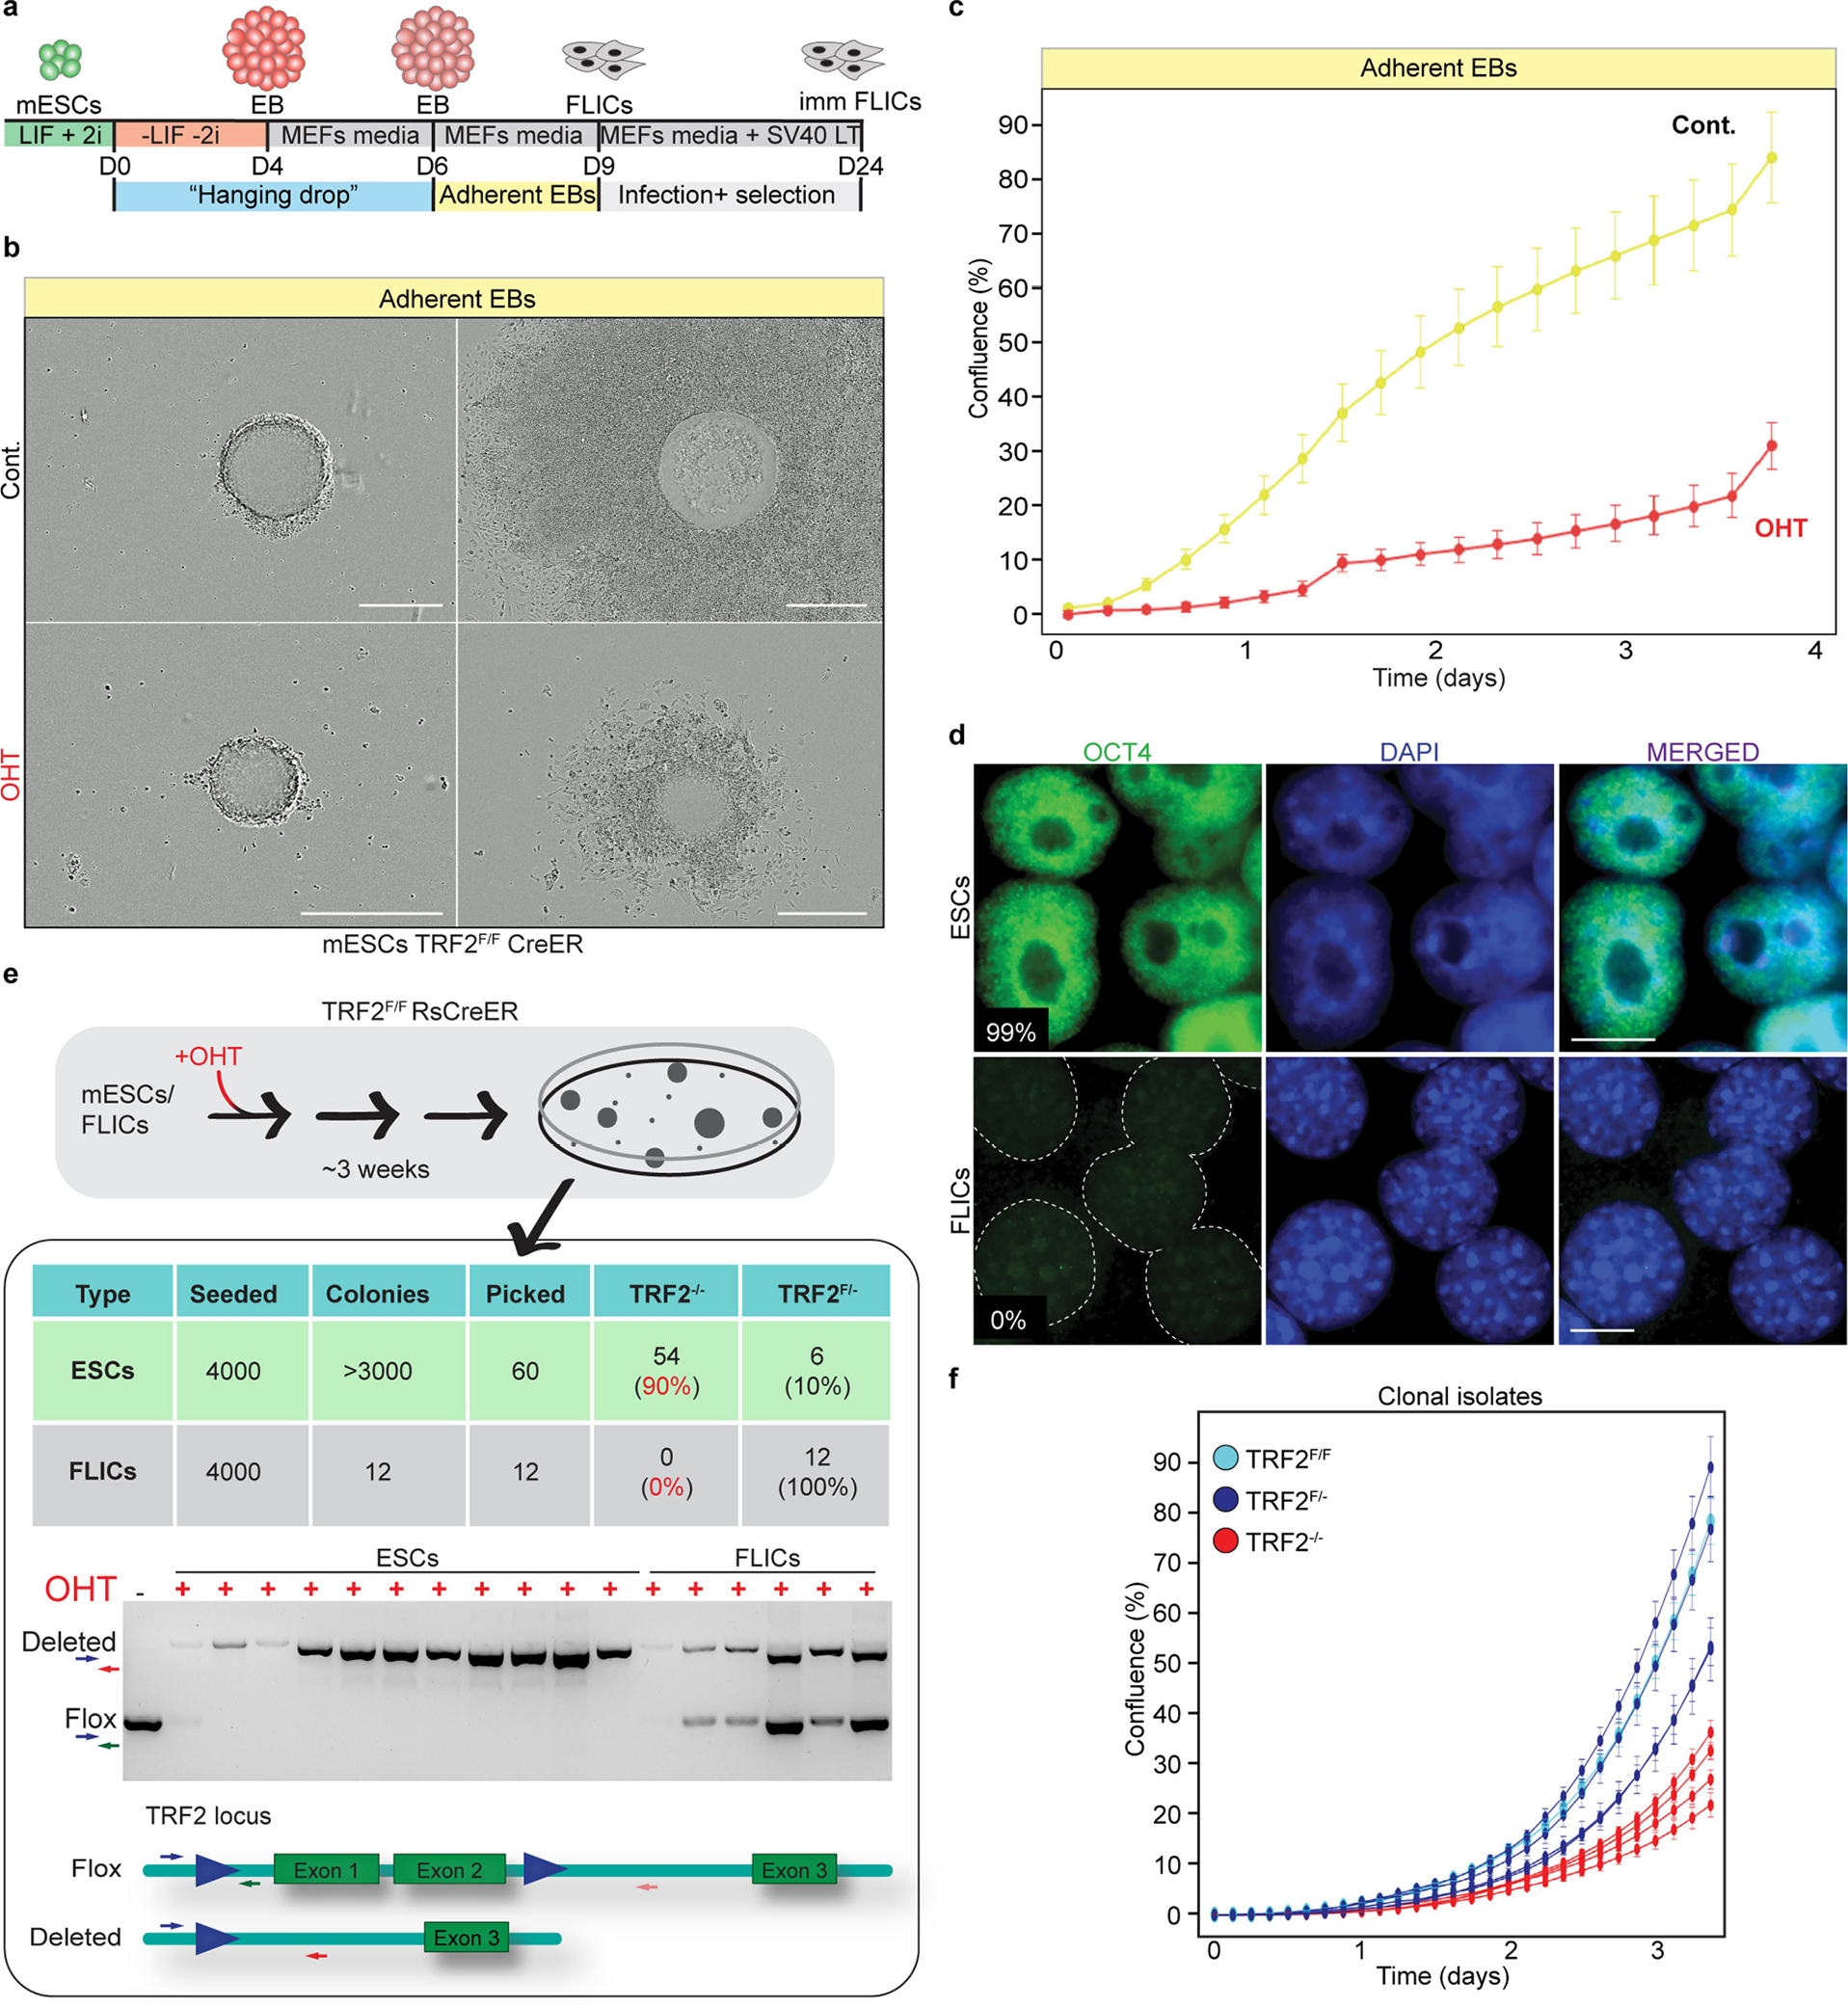
a, Schematic showing the hanging drops protocol used to generate embryoid bodies (EBs) and differentiated FLICs. b, Representative images of embryoid bodies derived from control and TRF2-depleted ES cells before adhesion (left) and 3 days after induction of differentiation (right). The experiment was performed three times with similar results. Scale bar, 400 μm. c, Growth properties of embryoid bodies derived from TRF2-proficient (control (cont.)) or TRF2-depleted ES cells (OHT) undergoing differentiation measured by confluence. Mean and s.d. are derived from the analysis of 47 images per condition. d, Immunofluorescence staining for the pluripotency marker OCT4 in ES cells and FLICs. The percentage of positive cells is shown. The experiment was performed three times with similar results. Scale bar, 10 μm. e, Schematics of the experimental approach used to derive single-cell isolates 3 weeks after OHT-mediated TRF2 deletion in ES cells and FLICs. The table summarizes the number of cells seeded, the number of colonies obtained and the TRF2 genotype of the isolated colonies. An example of a genotyping PCR performed on the resulting clones and the representation of the Trf2-floxed and Trf2-null alleles1 is shown below. The unprocessed image is provided in the Source Data for Extended Data Fig. 1. f, Growth property measured by confluency of 4 heterozygous ES cells clones (Trf2f/−) (dark blue) and 4 knockout clones (Trf2−/−) (red) derived from the experiment described in e, and the parental ES cells (Trf2f/f) (light blue). Mean and s.d. are derived from the analysis of 36 images per condition.
Extended Data Fig. 2 |. Reduced activation of DDR in ES cells following telomere deprotection.
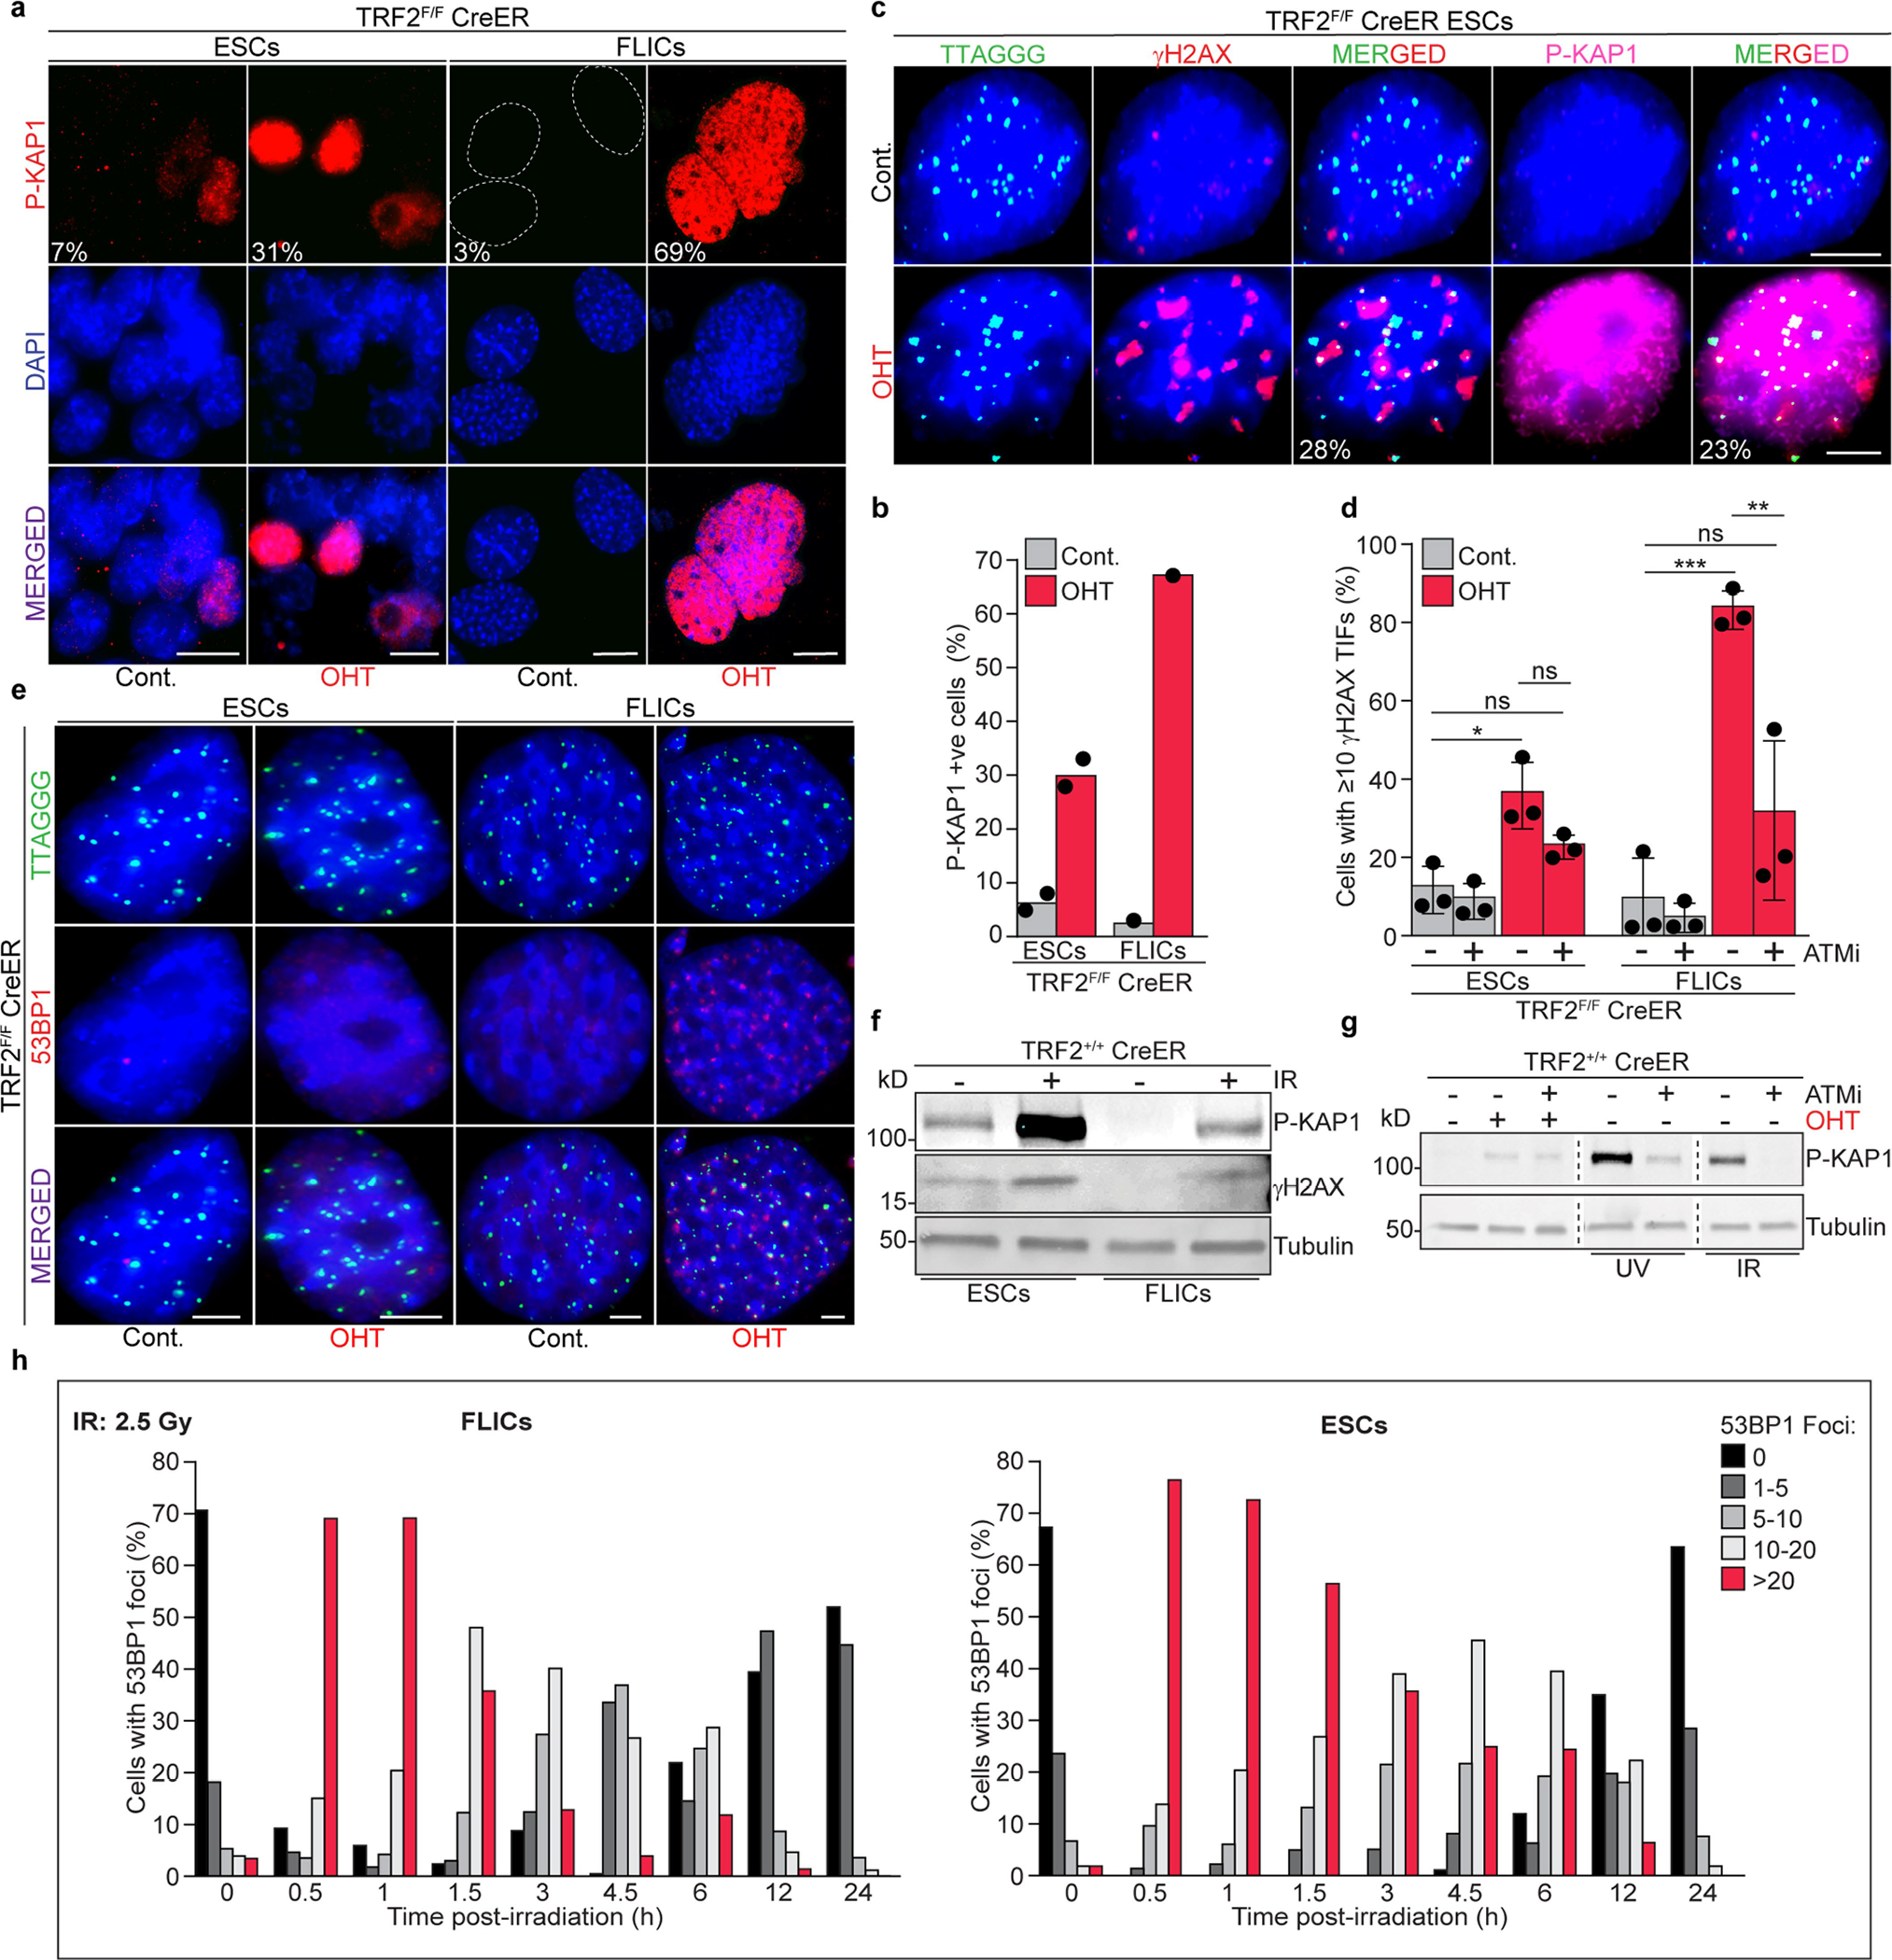
a, Representative immunofluorescence for KAP1 phosphorylated at S824 (p-KAP1) in ES cells and FLICs either before (cont.) or after Cre induction (OHT). Scale bar, 10 μm. Percentages of p-KAP1-positive cells are indicated in the figure as well as in b. The experiment was performed twice for ES cells with similar results and once for FLICs. c, Representative immunofluorescence staining for γH2AX (red), p-KAP1 (pink) and FISH staining for telomeric DNA (green) of TRF2-proficient (cont.) and TRF2-deficient (OHT) ES cells. Percentage of TIF-positive cells (third panel from left) and percentage of cells with TIF and positive for p-KAP1 (last panel from left) are shown. Scale bar, 4 μm. d, Percentage of ES cells and FLICs with more than 10 γH2AX TIF. Where indicated, TRF2-proficient (cont.) or TRF2-deficient (OHT) cells were treated with an ATM inhibitor. Data panels in the figure are representative of three experiments. ns, non-significant (P ≥ 0.05), *P < 0.05, **P < 0.01, ***P < 0.001, one-way ANOVA. e, 53BP1 (red) localization at telomeric DNA (green) in TRF2-proficient (cont.) and TRF2-deficient (OHT) ES cells and FLICs. Quantification of these data are reported in Fig. 1f. Scale bar, 4 μm. f, Western blotting analysis for p-KAP1, γH2AX and—as a loading control—tubulin. Protein lysates were isolated from ES cells or FLICs either mock-treated or gamma irradiated (2.5 Gy) 30 min before collection. g, Western blotting analysis for the expression of p-KAP1 or—as loading control—tubulin. Protein lysates were derived from ES cells that were either untreated or treated with the ATM inhibitor, as indicated. Where indicated, cells were treated with OHT to induce TRF2 depletion, with UV (1,200 J per m2) or with gamma irradiation (2.5 Gy). h, Dissipation of 53BP1 DNA damage foci following IR-induced damage in FLICs (left) and ES cells (right). Cells were treated with gamma irradiation (2.5 Gy) and fixed at the indicated time points. 0, non-treated control samples. For each time point, at least 140 nuclei were scored and the percentage of cells with the indicated number of 53BP1 foci at any given time point is indicated; additional details can be found in Supplementary Table 2.
Extended Data Fig. 3 |. Identification of synthetically lethal genes in TRF2-deficient ES cells.
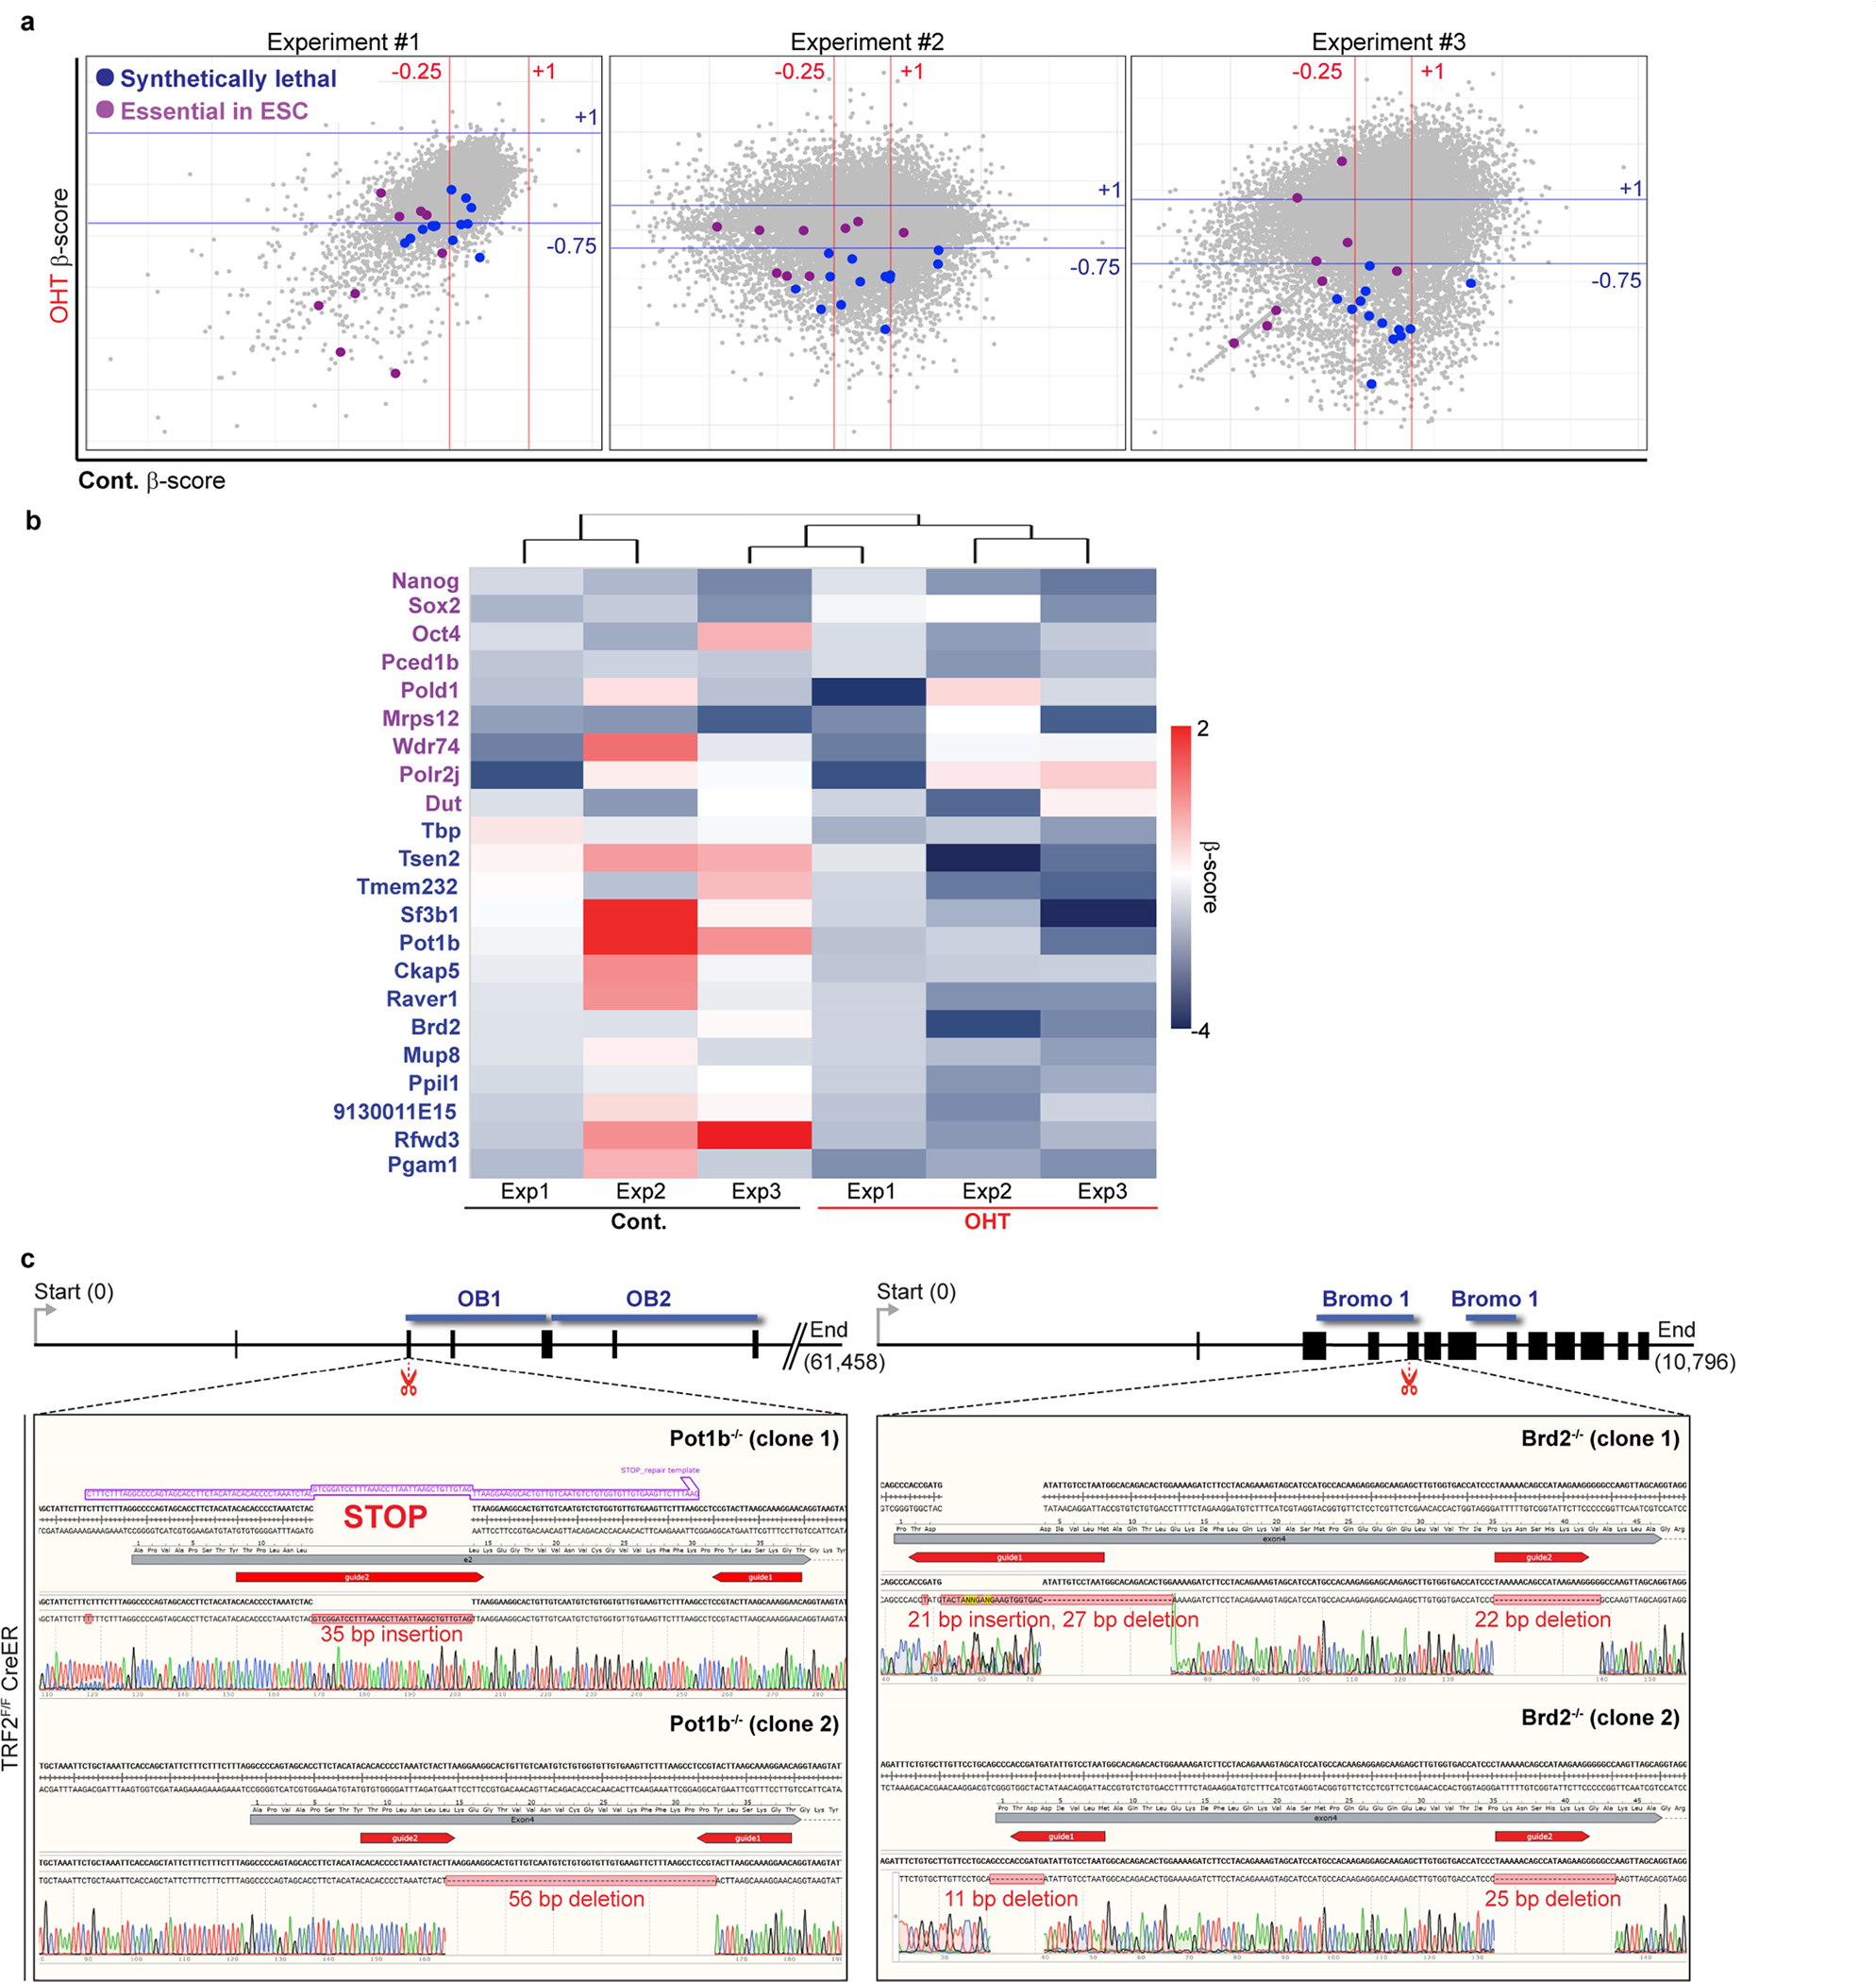
a, Scatter plots from three independent CRISPR–Cas9 screens from Fig. 2b. Genes that are synthetically lethal with TRF2 knockout are labelled with dark blue dots. Genes that are essential for ES cells are labelled with magenta dots. b, Heat map displaying the essentiality score (β-score) of the 13 candidate synthetically lethal genes (dark blue), and for 8 genes that have previously been described as essential in ES cells31 (purple), across 3 independent experiments. c, Schematic of the Pot1b and Brd2 genomic loci showing genome organization, the predicted CRISPR–Cas9 cut site (scissors, red) and key domains required for protein function (blue). Sanger sequencing of Pot1b−/− (exon 2) and Brd2−/− (exon 4) for different clones isolated is shown. For Pot1b, a repair template cassette containing multiple STOP codons was used. gRNA sequences are highlighted in red.
Extended Data Fig. 4 |. Codepletion of TRF2 and POT1A or POT1B result in LIG4-dependent end-to-end fusions.
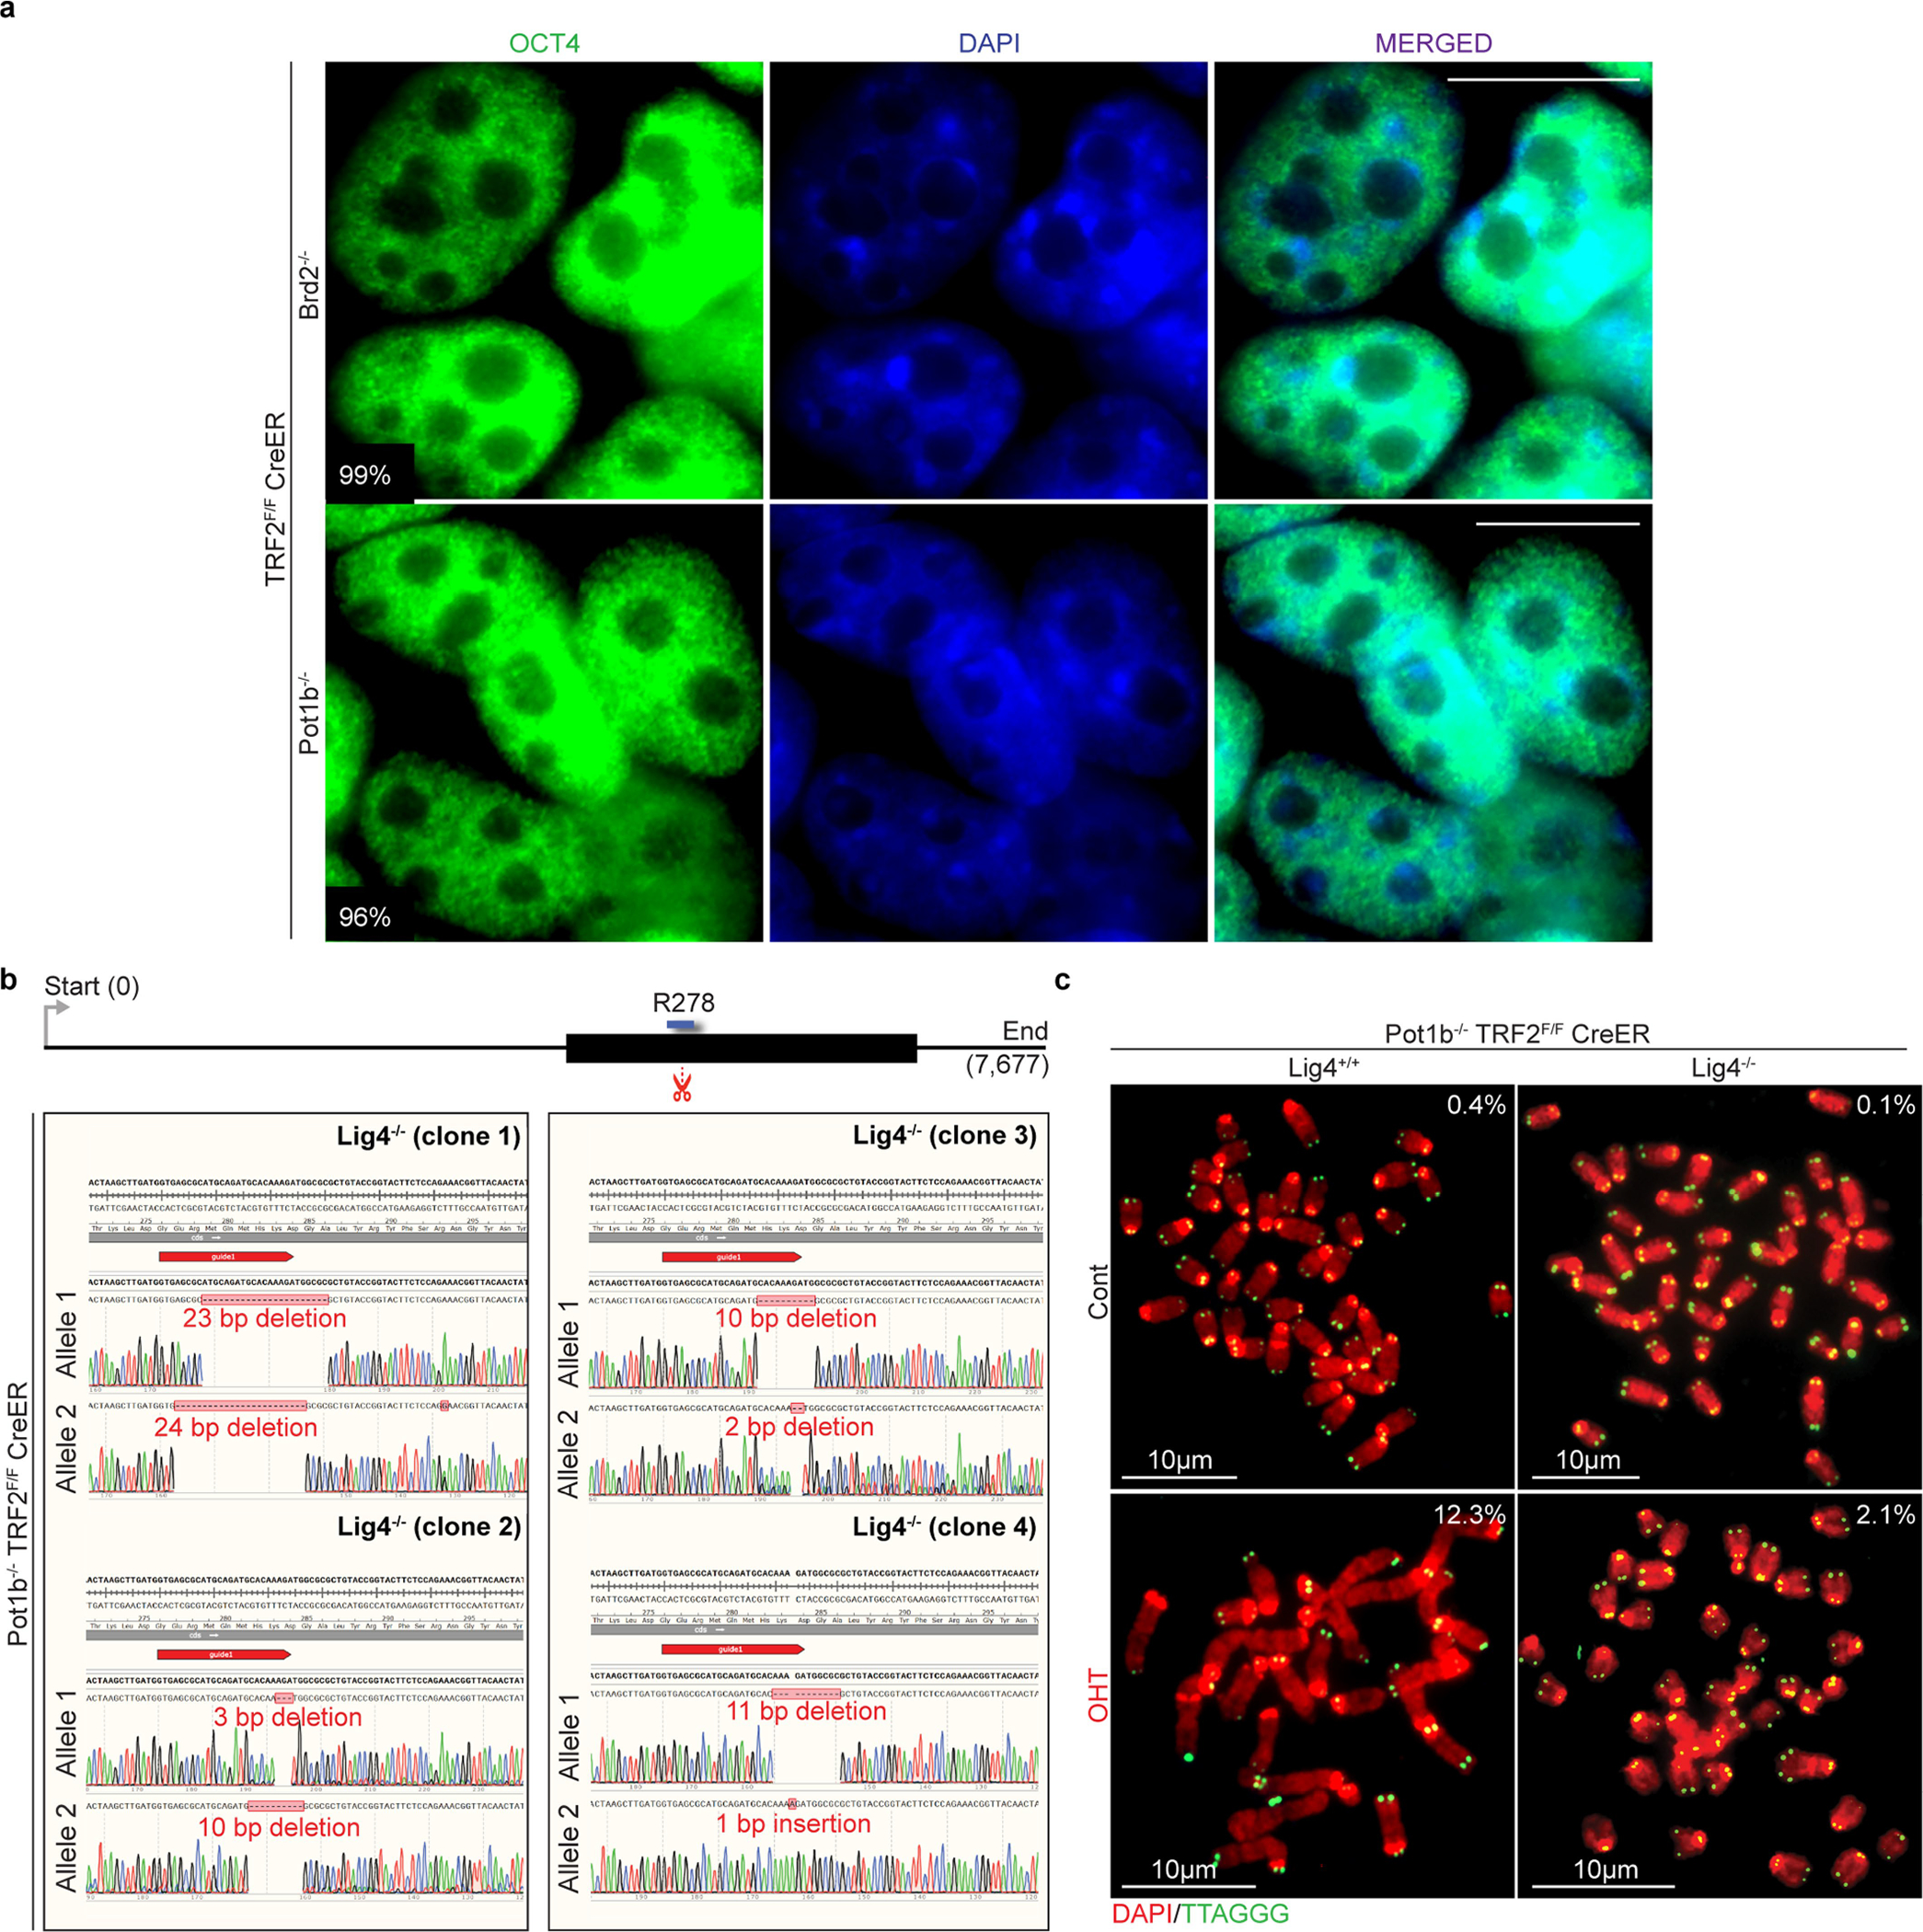
a, Immunofluorescence staining for the pluripotency marker OCT4 (green) in Pot1b−/− and Brd2−/− ES cells. The percentage of positive cells is shown. Scale bar, 10 μm. b, Schematic of the Lig4 genomic locus, showing the predicted CRISPR–Cas9 cut site (scissors, red), and the sequence coding the essential R278 residue32 (blue). Sanger sequencing results showing successful gene editing of the Lig4 locus in four independent clones; the gRNA sequence is highlighted in red. c, Metaphases from ES cells of indicated genotypes. The percentage of telomeres engaging in telomere fusions are shown. In total, three independent experiments were performed. For a detailed summary of the data, see Supplementary Table 1 and Source Data for Extended Data Fig. 4.
Extended Data Fig. 5 |. Pot1b, Pot1a and Brd2 depletion in TRF2-null cells induce the DDR pathway.
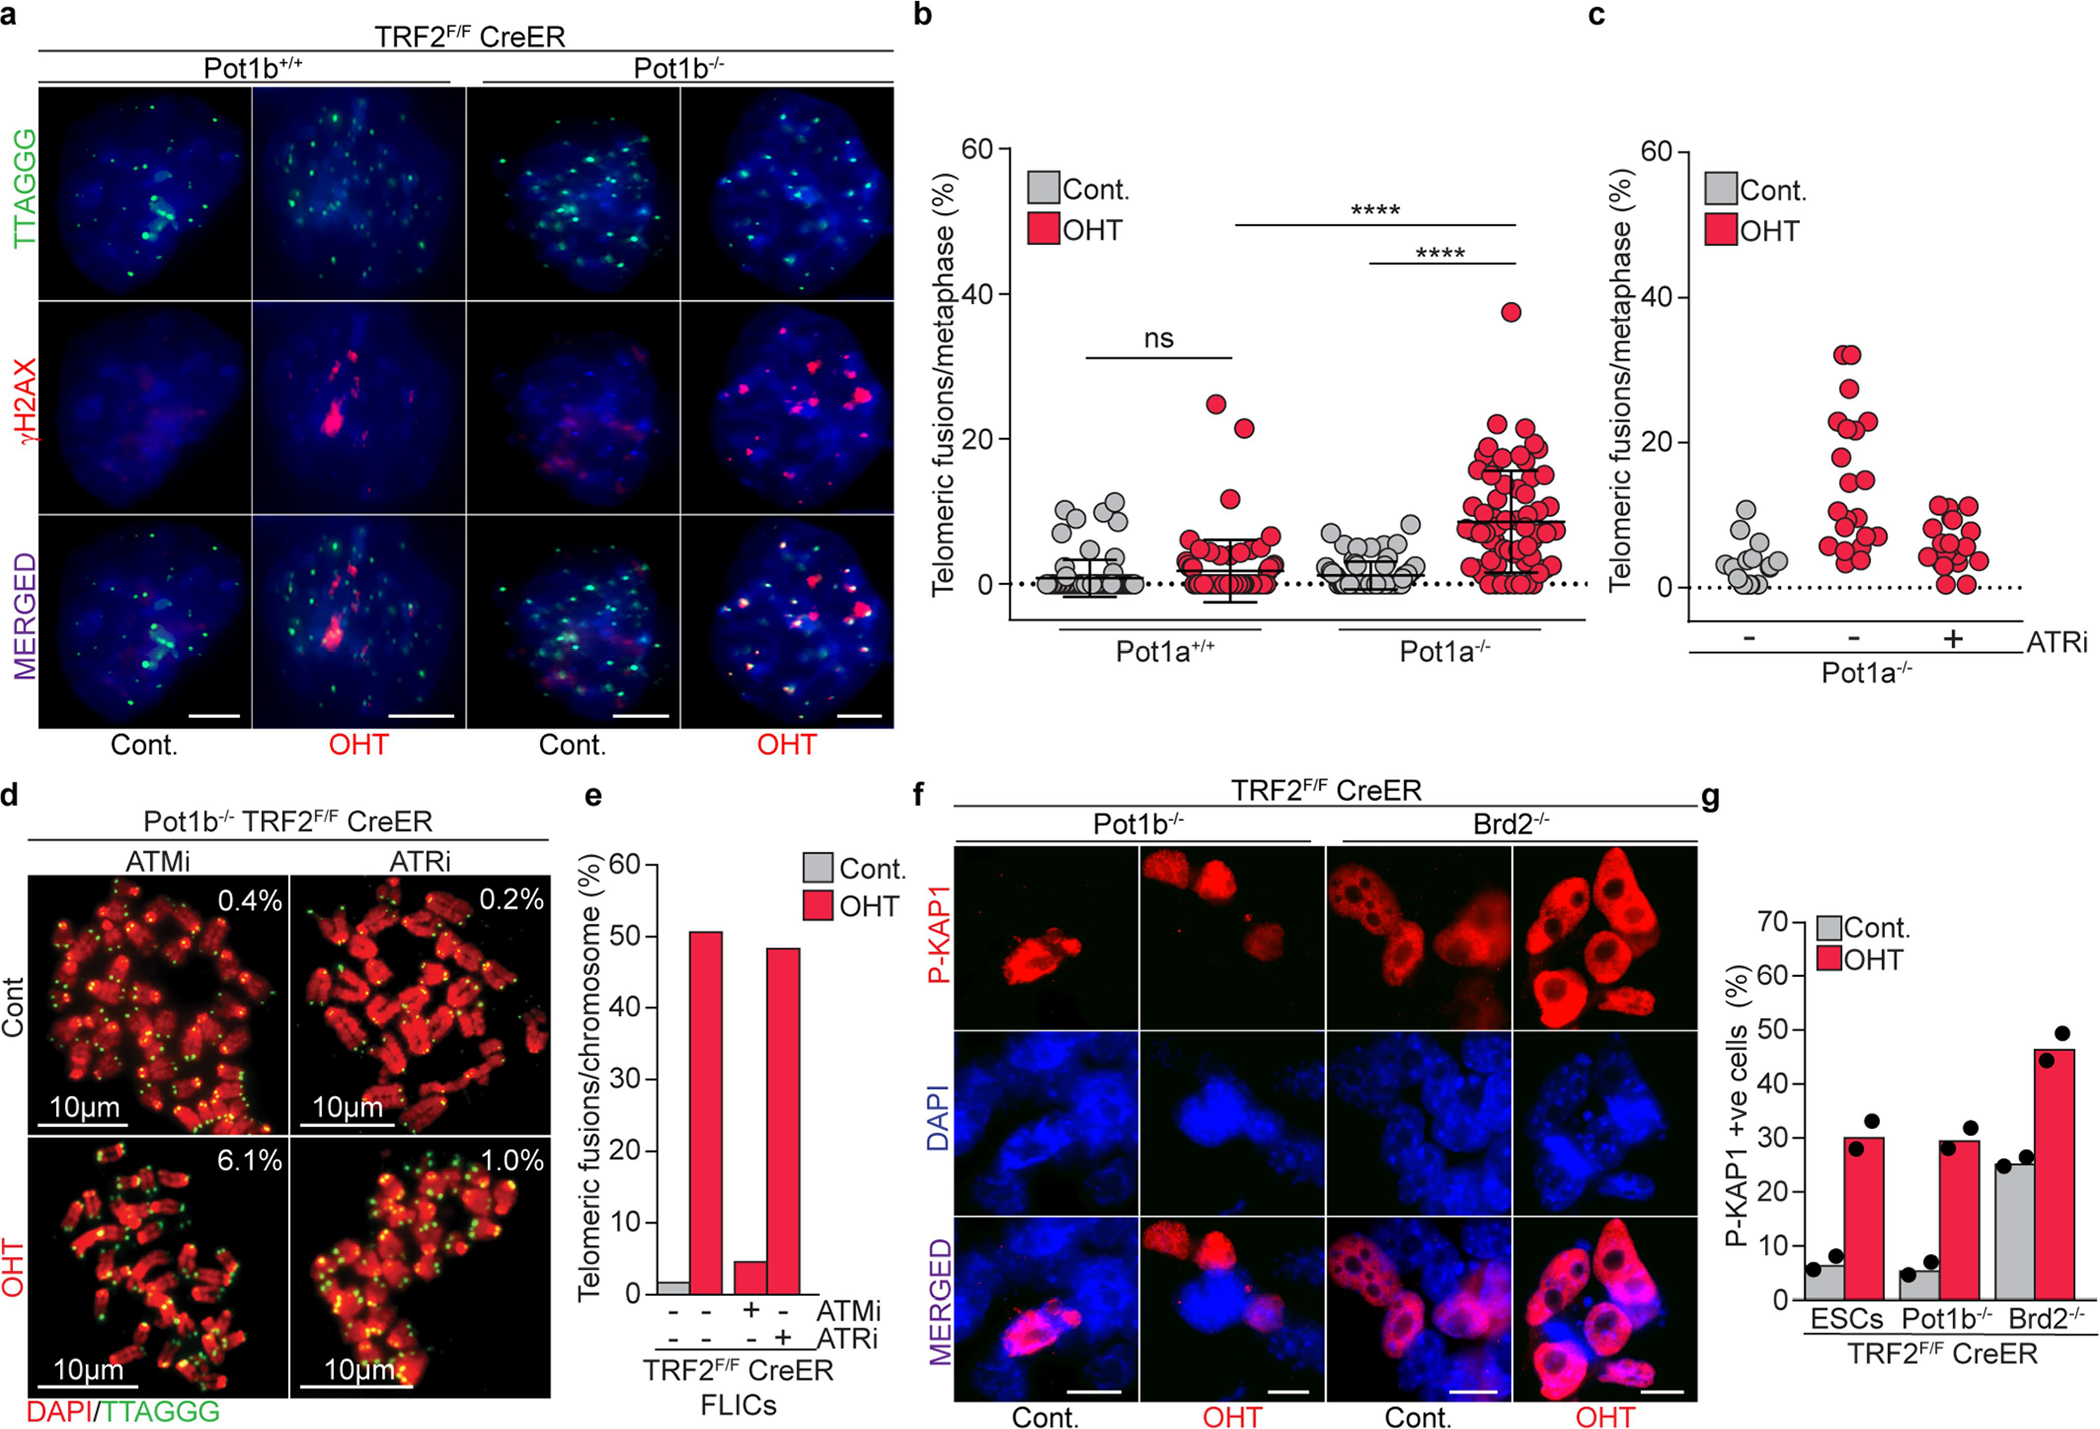
a, Representative IF–FISH for γH2AX (red) and telomeres (green) of control (cont.) and TRF2-depleted (OHT) ES cells with the indicated Pot1b genotype. Quantifications are provided in Fig. 3e. Scale bar, 4 μm. b, Scatter plot representing the distribution of telomeric fusions in control (cont.) and TRF2-depleted (OHT) ES cells of the indicated Pot1a genotype. Each dot represents the percentage of telomeres fused in one metaphase spread. For detailed information, see Supplementary Table 1 and Source Data for Extended Data Fig. 5 (n = 3 independent experiments). c, Scatter plot representing the distribution of telomeric fusions in control (cont.) and TRF2-depleted (OHT) Pot1a−/− ES cells that were either left untreated or treated with the ATR inhibitor (ATRi). Each dot represents the percentage of telomeres fused in one metaphase spread. For detailed information, see Supplementary Table 1 and Source Data for Extended Data Fig. 5. d, Metaphases derived from TRF2-proficient (cont.) or TRF2-deficient (OHT) Pot1b−/− ES cells treated with ATMi (left) or ATRi (right). Percentage of telomere fusions were calculated from a total of >19 metaphases per genotype. e, Graph representing the percentage of telomeric fusions in FLICs of the indicated genotype and treatment. In total, >30 metaphases per genotype and treatment were analysed. f, Representative immunofluorescence for p-KAP1 (red) in ES cells of the indicated genotype in the presence (cont.) or absence of TRF2 (OHT). Scale bar, 10 μm. g, Percentage of p-KAP1-positive cells in response to TRF2 depletion (OHT) in ES cells of indicated genotype and in control cells. Additional information for b–e is provided in Supplementary Table 1 and Source Data for Extended Data Fig. 5.
Extended Data Fig. 6 |. ZSCAN4 contributes to end protection in TRF2-depleted cells.

a, Differentially expressed genes in response to TRF2 depletion in ES cells (left) and differentiated cells (FLICs) (right). Volcano plots represent the log2-transformed fold change (FC) (x axis) and the −log2(P value) (y axis). Transcriptional profiling was performed three days after OHT-mediated TRF2 deletion. In the top panels, genes downregulated (P < 0.005 and FC < −2) upon OHT treatment are labelled with dark blue dots, and upregulated (P < 0.005 and FC >2) are labelled with red dots. Bottom panels, genes expressed in the 2-cell stage are labelled in purple, shelterin components are labelled in green. b, Quantifications of telomeric fusions detected in ES cells following ZSCAN4C downregulation (relative to Fig. 4d). Scatter plot representing the distribution of telomeric fusions. Each dot represents the percentage of telomeres fused in one metaphase spread. For detailed analysis information, see Supplementary Table 1 and Source Data for Extended Data Fig. 6. c, ZSCAN4C downregulation does not induce ES cell differentiation. Representative immunofluorescence staining for the pluripotency marker OCT4 in control and OHT-treated ES cells following ZSCAN4C downregulation. The percentage of OCT4-positive cells is shown. Scale bar, 10 μm. d, Representative immunofluorescence staining for ZSCAN4 in FLICs with stable integration of a doxycycline-inducible ZSCAN4C expression construct (iZSCAN4). Cells were either left untreated (top) or treated with doxycycline to induce Zscan4c expression (bottom) for two days before collection. e, The FLICs described in d either induced with doxycycline (+) or not (−) were treated with OHT and collected 4 days later for western blot analysis. As a control (cont.), FLICs lacking the inducible cassette were used. f, Growth of Trf2f/f FLICs before (cont.) or after Cre induction (OHT), untreated (circle) or treated (inverted triangle) with doxycycline to induce Zscan4c. Mean and s.d. are derived from the analysis of 49 images per condition. g, Representative IF–FISH staining for 53BP1 (red) and telomeric DNA (green) in TRF2-proficient (cont.) or TRF2-deficient FLICs. Where indicated, cells were treated with doxycycline (Dox) 7 days before collection to induce expression of exogenous Zscan4c. Scale bar, 4 μm. h, Quantification of data shown in g, cells with more than 10 53BP1 foci at telomeres were scored as positive for TIF.
Extended Data Fig. 7 |. TRF2-depleted cells show increased telomere length.
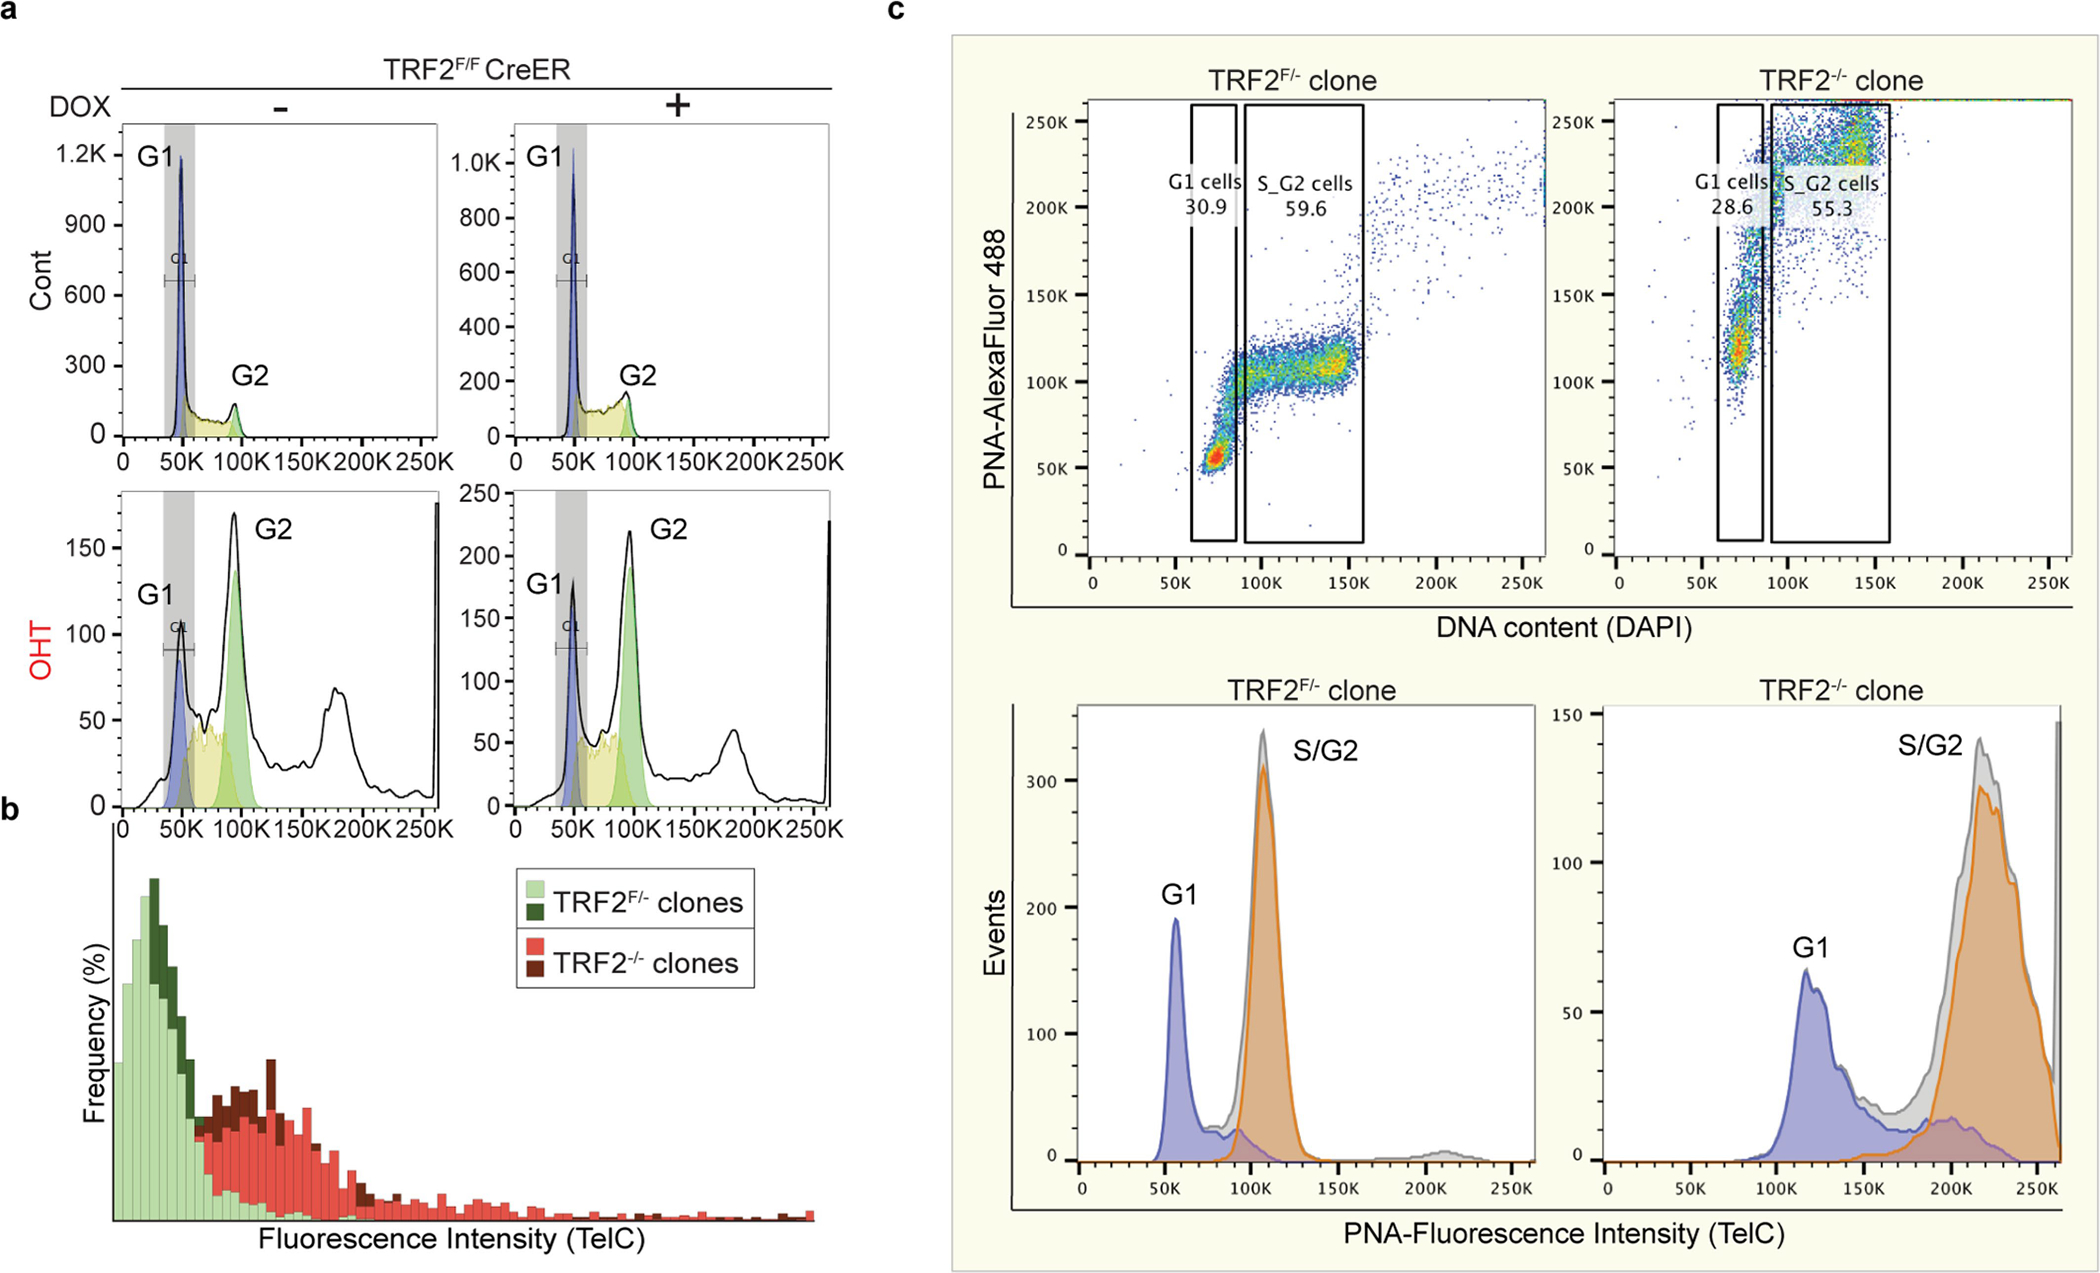
a, Representative FACS plots (y axes, cell count; x axes, PI staining) showing the cell-cycle profiles of TRF2-proficient (cont.) and TRF2-deficient (OHT) FLICs. Where indicated, cells were treated with doxycycline (Dox) for 7 days before collection to induce expression of exogenous Zscan4c. G1 phase of the cell cycle is marked in blue; S phase in yellow; G2 phase in green. The unmarked peak indicates presence of polyploid cells. b, Q-FISH histograms of telomere length distributions of chromosomes derived from TRF2-proficient (Trf2f/−) and TRF2-deficient (Trf2−/−) ES cells clones, derived as described in Extended Data Fig. 1e. Telomere length was calculated on the basis of the florescence intensity of a telomeric FISH probe (PNA-TelC). c, Flow-FISH quantification of telomere length was performed on TRF2-proficient (Trf2f/−) and TRF2-deficient (Trf2−/−) ES cells clones. Top panels show the distribution of telomeric signal intensity (PNA-TelC) (y axis) and the DNA content (DAPI) (x axis). The bottom panels show the distribution of cells (y axis) on the basis of telomeric signal intensity (x axis). Cells were gated on the basis of DNA content into G1 (light blue) and S/G2 (orange). Note the shift in telomere length between the TRF2-proficient and TRF2-deficient cells.
Extended Data Fig. 8 |. Model of the unique telomere protection mechanism in ES cells.
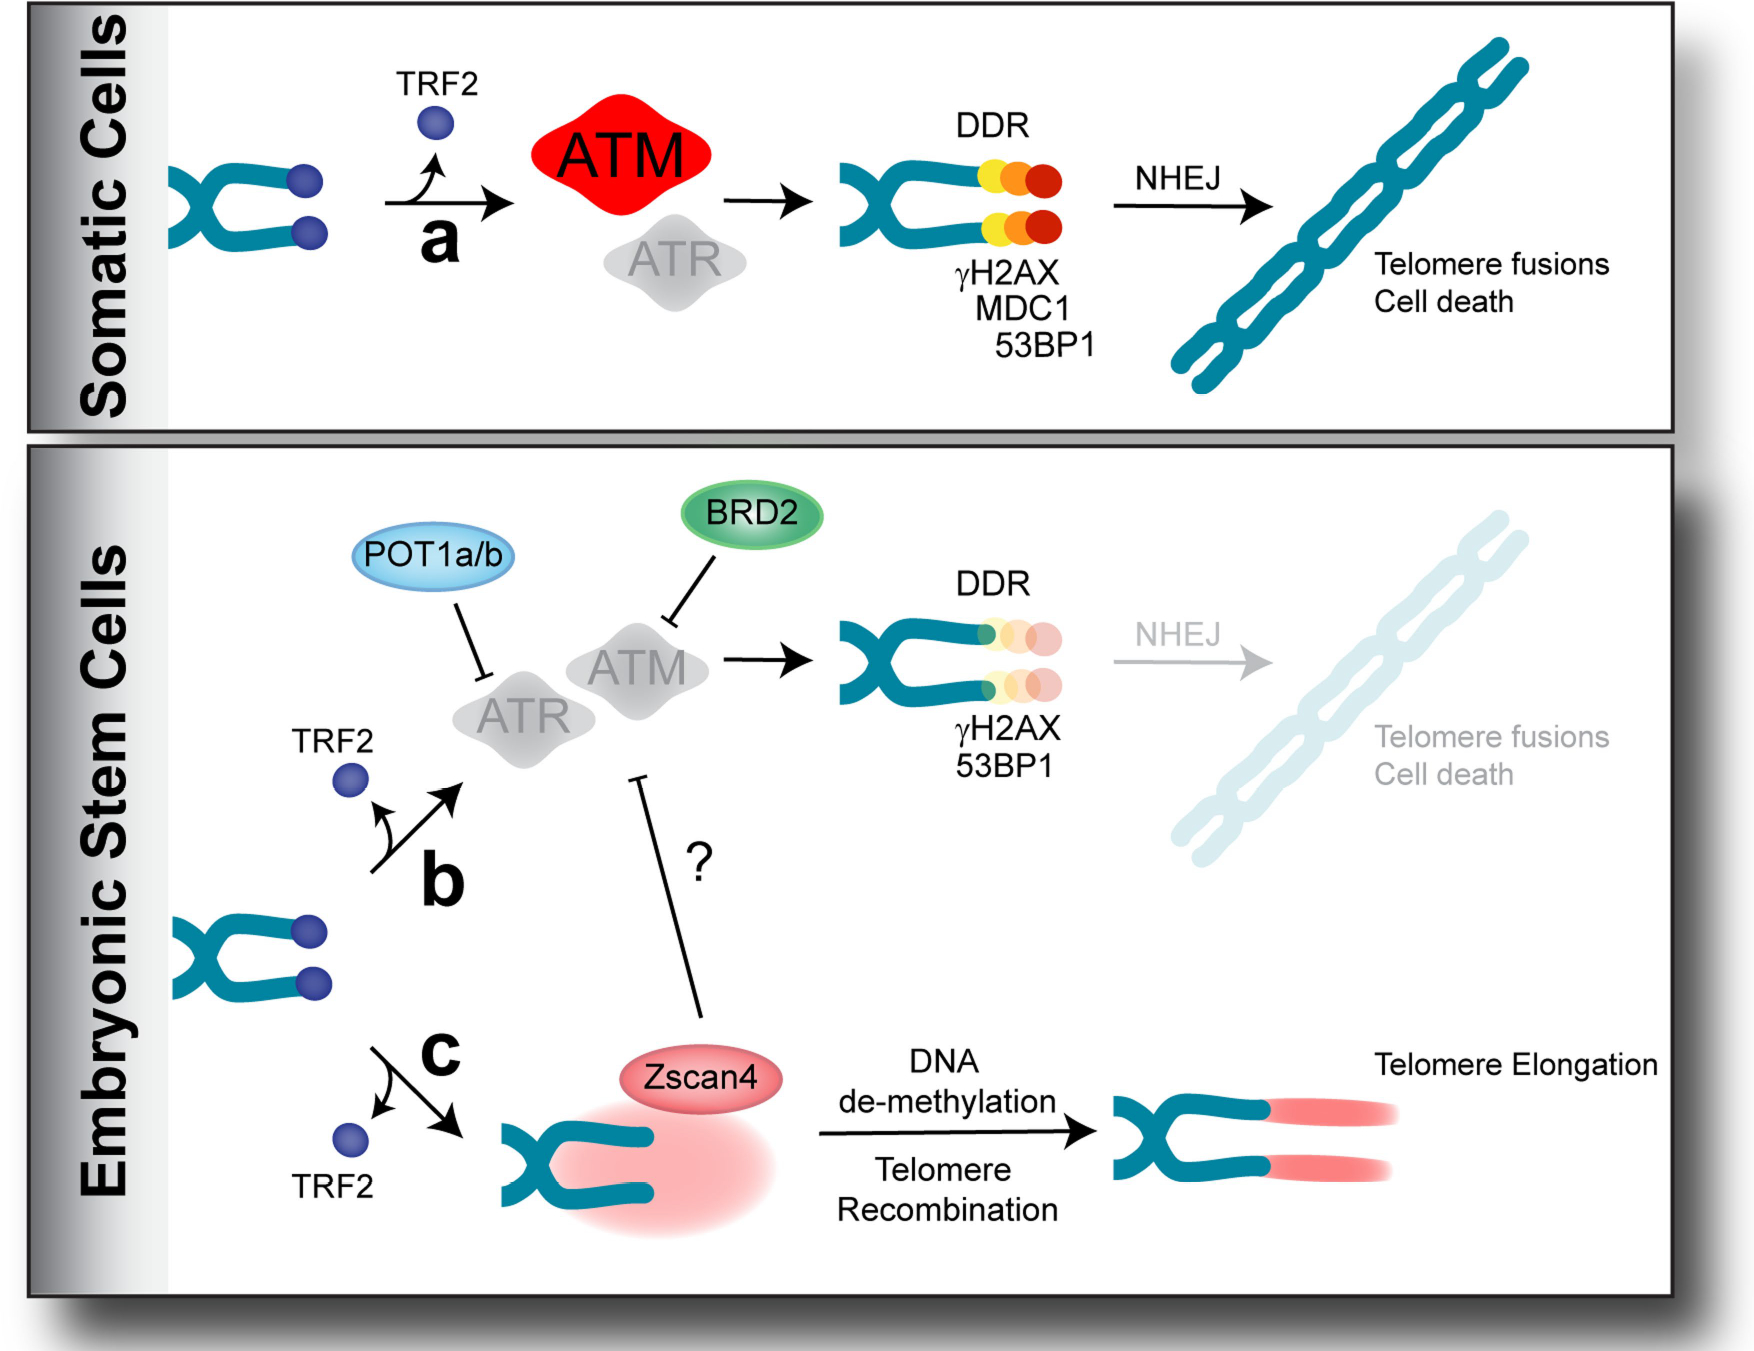
a, Overview of the DDR in response to TRF2 depletion in somatic cells. In response to uncapped telomeres, ATM kinase initiates DDR, leading to end-to-end fusions via the NHEJ pathway. b, POT1A, POT1B and BRD2ensure genomic stability in pluripotent mouse ES cells by inhibiting the activities of ATM and ATR kinases. As a result, mild DDR is not enough to cause end-to-end fusions. c, Increased expression of Zscan4—a cluster of two-cell-signature genes—might result in recombination-based telomere elongation. Alternatively, the ZSCAN4 -dependent inhibition of the ATM and ATR kinases at TRF2-depleted telomeres of ES cells ensures telomere stability.
Supplementary Material
Acknowledgements
We thank A. Nussenzweig, A. Sfeir, C. Attwooll and members of the Lazzerini Denchi laboratory for discussions and critical reading of the manuscript; F. Livak and the NCI Flow Cytometry Core Facility FACS for assistance with FACS analysis; and S. Shema and the CCR Genomics Core for assistance with next-generation sequencing experiments. M.M.-P. is a recipient of the William Guy Forbeck Research Foundation Award; T.O. is a recipient of the Helen Hay Whitney Postdoctoral Fellowship.
Footnotes
Competing interests The authors declare no competing interests.
Additional information
Supplementary information is available for this paper at https://doi.org/10.1038/s41586-020-2959-4.
Peer review information Nature thanks Ylli Doksani and the other, anonymous, reviewer(s) for their contribution to the peer review of this work.
Reprints and permissions information is available at http://www.nature.com/reprints.
References
- 1.Celli GB & de Lange T DNA processing is not required for ATM-mediated telomere damage response after TRF2 deletion. Nat. Cell Biol. 7, 712–718 (2005). [DOI] [PubMed] [Google Scholar]
- 2.de Lange T Shelterin: the protein complex that shapes and safeguards human telomeres. Genes Dev. 19, 2100–2110 (2005). [DOI] [PubMed] [Google Scholar]
- 3.Artandi SE et al. Telomere dysfunction promotes non-reciprocal translocations and epithelial cancers in mice. Nature 406, 641–645 (2000). [DOI] [PubMed] [Google Scholar]
- 4.Griffith JD et al. Mammalian telomeres end in a large duplex loop. Cell 97, 503–514 (1999). [DOI] [PubMed] [Google Scholar]
- 5.Doksani Y, Wu JY, de Lange T & Zhuang X Super-resolution fluorescence imaging of telomeres reveals TRF2-dependent T-loop formation. Cell 155, 345–356 (2013). [DOI] [PMC free article] [PubMed] [Google Scholar]
- 6.Okamoto K et al. A two-step mechanism for TRF2-mediated chromosome-end protection. Nature 494, 502–505 (2013). [DOI] [PMC free article] [PubMed] [Google Scholar]
- 7.Martínez P, Ferrara-Romeo I, Flores JM & Blasco MA Essential role for the TRF2 telomere protein in adult skin homeostasis. Aging Cell 13, 656–668 (2014). [DOI] [PMC free article] [PubMed] [Google Scholar]
- 8.Lobanova A et al. Different requirements of functional telomeres in neural stem cells and terminally differentiated neurons. Genes Dev. 31, 639–647 (2017). [DOI] [PMC free article] [PubMed] [Google Scholar]
- 9.White DE et al. KAP1, a novel substrate for PIKK family members, colocalizes with numerous damage response factors at DNA lesions. Cancer Res. 66, 11594–11599 (2006). [DOI] [PubMed] [Google Scholar]
- 10.Dimitrova N & de Lange T Cell cycle-dependent role of MRN at dysfunctional telomeres: ATM signaling-dependent induction of nonhomologous end joining (NHEJ) in G1 and resection-mediated inhibition of NHEJ in G2. Mol. Cell Biol. 29, 5552–5563 (2009). [DOI] [PMC free article] [PubMed] [Google Scholar]
- 11.Hockemeyer D, Daniels JP, Takai H & de Lange T Recent expansion of the telomeric complex in rodents: two distinct POT1 proteins protect mouse telomeres. Cell 126, 63–77 (2006). [DOI] [PubMed] [Google Scholar]
- 12.Wu L et al. Pot1 deficiency initiates DNA damage checkpoint activation and aberrant homologous recombination at telomeres. Cell 126, 49–62 (2006). [DOI] [PubMed] [Google Scholar]
- 13.Gyuris A et al. The chromatin-targeting protein Brd2 is required for neural tube closure and embryogenesis. Biochim. Biophys. Acta 1789, 413–421 (2009). [DOI] [PMC free article] [PubMed] [Google Scholar]
- 14.Kim JJ et al. Systematic bromodomain protein screens identify homologous recombination and R-loop suppression pathways involved in genome integrity. Genes Dev. 33, 1751–1774 (2019). [DOI] [PMC free article] [PubMed] [Google Scholar]
- 15.Kratz K & de Lange T Protection of telomeres 1 proteins POT1a and POT1b can repress ATR signaling by RPA exclusion, but binding to CST limits ATR repression by POT1b. J. Biol. Chem. 293, 14384–14392 (2018). [DOI] [PMC free article] [PubMed] [Google Scholar]
- 16.Denchi EL & de Lange T Protection of telomeres through independent control of ATM and ATR by TRF2 and POT1. Nature 448, 1068–1071 (2007). [DOI] [PubMed] [Google Scholar]
- 17.Gursoy-Yuzugullu O, Carman C & Price BD Spatially restricted loading of BRD2 at DNA double-strand breaks protects H4 acetylation domains and promotes DNA repair. Sci. Rep. 7, 12921 (2017). [DOI] [PMC free article] [PubMed] [Google Scholar]
- 18.Eckersley-Maslin MA et al. MERVL/Zscan4 network activation results in transient genome-wide DNA demethylation of mESCs. Cell Rep. 17, 179–192 (2016). [DOI] [PMC free article] [PubMed] [Google Scholar]
- 19.Zhang W et al. Zscan4c activates endogenous retrovirus MERVL and cleavage embryo genes. Nucleic Acids Res. 47, 8485–8501 (2019). [DOI] [PMC free article] [PubMed] [Google Scholar]
- 20.Macfarlan TS et al. Embryonic stem cell potency fluctuates with endogenous retrovirus activity. Nature 487, 57–63 (2012). [DOI] [PMC free article] [PubMed] [Google Scholar]
- 21.Falco G et al. Zscan4: a novel gene expressed exclusively in late 2-cell embryos and embryonic stem cells. Dev. Biol. 307, 539–550 (2007). [DOI] [PMC free article] [PubMed] [Google Scholar]
- 22.Zalzman M et al. Zscan4 regulates telomere elongation and genomic stability in ES cells. Nature 464, 858–863 (2010). [DOI] [PMC free article] [PubMed] [Google Scholar]
- 23.Dan J et al. Zscan4 inhibits maintenance DNA methylation to facilitate telomere elongation in mouse embryonic stem cells. Cell Rep. 20, 1936–1949 (2017). [DOI] [PMC free article] [PubMed] [Google Scholar]
- 24.Pucci F, Gardano L & Harrington L Short telomeres in ESCs lead to unstable differentiation. Cell Stem Cell 12, 479–486 (2013). [DOI] [PMC free article] [PubMed] [Google Scholar]
- 25.Colla S et al. Telomere dysfunction drives aberrant hematopoietic differentiation and myelodysplastic syndrome. Cancer Cell 27, 644–657 (2015). [DOI] [PMC free article] [PubMed] [Google Scholar]
- 26.Ferron SR et al. Telomere shortening in neural stem cells disrupts neuronal differentiation and neuritogenesis. J. Neurosci. 29, 14394–14407 (2009). [DOI] [PMC free article] [PubMed] [Google Scholar]
- 27.Vooijs M, Jonkers J & Berns A A highly efficient ligand-regulated Cre recombinase mouse line shows that LoxP recombination is position dependent. EMBO Rep. 2, 292–297 (2001). [DOI] [PMC free article] [PubMed] [Google Scholar]
- 28.Chavez A, George V, Agrawal V & Johnson FB Sumoylation and the structural maintenance of chromosomes (Smc) 5/6 complex slow senescence through recombination intermediate resolution. J. Biol. Chem. 285, 11922–11930 (2010). [DOI] [PMC free article] [PubMed] [Google Scholar]
- 29.Baerlocher GM, Vulto I, de Jong G & Lansdorp PM Flow cytometry and FISH to measure the average length of telomeres (flow FISH). Nat. Protoc. 1, 2365–2376 (2006). [DOI] [PubMed] [Google Scholar]
- 30.Li W et al. MAGeCK enables robust identification of essential genes from genome-scale CRISPR/Cas9 knockout screens. Genome Biol. 15, 554 (2014). [DOI] [PMC free article] [PubMed] [Google Scholar]
- 31.Tzelepis K et al. A CRISPR dropout screen identifies genetic vulnerabilities and therapeutic targets in acute myeloid leukemia. Cell Rep. 17, 1193–1205 (2016). [DOI] [PMC free article] [PubMed] [Google Scholar]
- 32.Rucci F et al. Homozygous DNA ligase IV R278H mutation in mice leads to leaky SCID and represents a model for human LIG4 syndrome. Proc. Natl Acad. Sci. USA 107, 3024–3029 (2010). [DOI] [PMC free article] [PubMed] [Google Scholar]
Associated Data
This section collects any data citations, data availability statements, or supplementary materials included in this article.
Supplementary Materials
Data Availability Statement
All raw sequencing reads for RNA-seq are available on NCBI Gene Expression Omnibus under accession number GSE156534. Source data are provided with this paper.