

Abstract
Electrostatic flocking, a textile engineering technique, uses Coulombic driving forces to propel conductive microfibers towards an adhesive-coated substrate, leaving a forest of aligned fibers. Though an easy way to induce anisotropy along a surface, this technique is limited to microfibers capable of charge transfer and accumulation from charging surfaces to microfibers. This study reports a novel method, utilizing principles from the percolation theory, to make electrically-insulative polymeric microfibers flockable. A variety of well-mixed conductive materials are added to multiple insulative and biodegradable polymer microfibers during wet spinning, which enables nearly all types of polymer microfibers to accumulate sufficient charges required for flocking. Biphasic, biodegradable scaffolds are fabricated by flocking silver nanoparticle (AgNP)-filled poly(ε-caprolactone) (PCL) microfibers onto substrates made from three-dimensional (3D) printing, electrospinning, and thin-film casting. The incorporation of AgNP into PCL fibers and use of chitosan-based adhesive enables antimicrobial activity against methicillin-resistant Staphylococcus aureus. The fabricated scaffolds demonstrated both favorable in vitro cell response and new tissue formation after subcutaneous implantation in rats as evidenct by new blood vessels and infiltrated cells. This technology opens many doors for using once unflockable polymer microfibers as surface modifiers or standalone structures in many engineering fields.
Keywords: electrostatic flocking, percolation theory, biphasic scaffold, wet spinning, microfibers
1. Introduction
Electrostatic flocking, a textile engineering technique that consists of three main components, flock fibers, an adhesive, and a substrate, uses an electrostatic field to launch short microfibers (flock fibers) towards an adhesive-covered substrate, creating a layer of vertically-aligned fibers perpendicular to the substrate.[1,2] Generally, flocking can be regarded as a surface modification technique used to decorate object surfaces or planar textiles. Application of flock fibers (short polymeric microfibers with proprietary electrostatic surface finishes) to an object increases regional mechanical strength, generates anisotropic surfaces with high surface areas and porosities, and allows for surface functionalization based on the type of fiber used. For example, flocking has been used to create marine antifouling surfaces[3,4], solar-driven steam generators[5,6], microfluidic chips for self-coalescing flow[7], elastomeric thermal interface and composite materials[8,9], stretchable fabric-based electrodes[10], shock-absorbing materials[11,12], diagnostic swabs[13–15], and tissue engineering scaffolds[16–21]. Though introduced to tissue engineering more than a decade ago, progress with flocked scaffolds has been limited due to restrictive electrical conductivity requirements required for flocking, inability to generate individual flock fibers, and a lack of understanding in approach and synthesis.
Previous studies using flocked scaffolds in tissue engineering have exclusively investigated their use as osteochondral scaffolds. Though some progress has been made towards using fully biodegradable flocked scaffolds, flocking in tissue engineering remains underdeveloped.[17–19] For example, flocked scaffolds developed by Gossla et al. were fully degradable, entirely composed of chitosan (CHS), and able to sustain cell proliferation.[16] However, the use of CHS only in these scaffolds dramatically limited their practical applications. For instance, it may be favorable to have the substrate or fibers degrade at different rates, particularly in wound regeneration and skin tissue engineering applications.[22] Perhaps one of the most restrictive bottlenecks limiting the use of electrostatic flocking in tissue engineering is the need for fibers to be able to accumulate charges, an uncommon characteristic of some common polymers used in tissue engineering.[23] One method used to induce conductivity in electrostatically insulative materials is based on the percolation theory, which establishes a tunneling network of conductive filling particles to achieve bulk material semi-conductivity/conductivity.[24–26] We hypothesized that, by applying principles from the percolation theory, we could create flock fibers by loading polymeric, wet-spun microfibers with conductive nanoparticles to ultimately generate anisotropic and biphasic scaffolds for biomedical applications. In this work, we first established a flexible method to create flocked scaffolds using a variety of biomedical polymers and conductive treatments, generating a first-of-kind biomedical flock fiber toolbox. Second, we demonstrated application flexibility by creating flocked scaffolds with electrospun nanofiber or 3D-printed substrates. Noting the ability to retain anisotropic alignment under substrate deformation, we developed a self-forming, biphasic conduit with nano-/micro- hierarchical structures. Finally, we evaluated the morphological, mechanical, and biological properties (in vitro and in vivo) of novel 0.5% AgNP/PCL flocked scaffolds for regenerative medicine applications.
2. Results and Discussions
Flocked scaffold fabrication consisted of three main steps: (1) wet spinning, (2) cutting and separating wet spun fibers, and (3) electrostatic flocking (Figure 1). First, a designated polymer and conductive filler (e.g., PCL and AgNPs) were blended in organic solvents until homogenous. Next, the mixed solution was wet-spun using a multi-nozzle wet spinning device and collected on a barrel collector (Figure S1a). Optimization of parameters (e.g., ejection rate and take-up rate) during wet spinning provided a framework for consistent synthesis of microfibers with consistently controllable diameters ranging from ~10-65 μm (Figure S1 b–e). Controlling flock fiber diameter is an important consideration when developing flocked scaffolds because fiber diameter significantly influences fiber motility and orientation.[26] Next, fibers were mechanically cut and separated by ultrasonic probe sonication followed by bubbling. After separation and drying, fibers were mechanically sieved onto a charging electrode and either an adhesive-covered substrate was affixed to the ground electrode or an adhesive layer (acting as both adhesive and substrate) was directly coated on the ground electrode. Adhesives varied from those previously reported (20% w/v gelatin (gel), 5% w/v CHS in AcOH + thermal crosslinking) to a 1:1 blend of 20% w/v gel: 5% w/v CHS in AcOH, which was used for all in vitro and in vivo tests (Figure S1 f, g).[16,17,21] A gradually increasing voltage was applied to the charging electrode (0-60 kV) for a specified time (½, 1, 5, 10, or 15 min), or until all of the flocking fibers lifted. Gradually increasing the applied voltage ensured that fibers would flock gradually and avoid interreference while in flight. Finished scaffolds were dried completely and chemically crosslinked in a glutaraldehyde (GA) chamber for 24 h. Resulting scaffolds had velvety appearances with visibly aligned fibers (Figure 1 (bottom right)).
Figure 1. Schematic illustrating the fabrication process of flocked scaffolds.
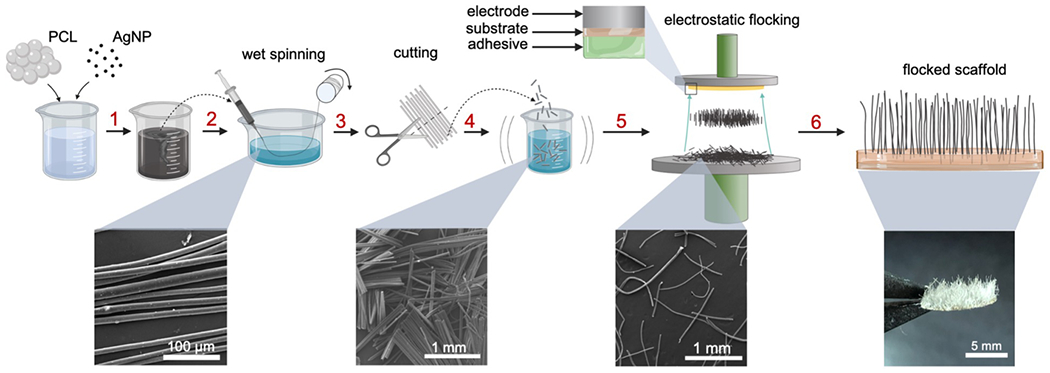
(1) PCL and AgNPs are dissolved/dispersed in the organic solvent. (2) The AgNP/PCL solution is wet spun into a coagulation bath and collected on a take up roller. (3) Fibers are cut and (4) separated with sonication and bubbling. (5) Fibers are sieved onto the charging electrode and electrostatically flocked toward an adhesive-covered substrate. (6) Flocked scaffolds are removed and crosslinked.
The bottom panels are the corresponding SEM images and photograph.
Arguably the most vital step in fabricating flocked scaffolds with insulative polymer fibers is encapsulating a sufficient filler volume to achieve sufficient charging for flocking. In most cases, flock fibers have a surface finish applied and their flock yield is determined by their surface moisture content. Fibers using surface finishes accumulate charge along their surface. In the case of Gossla et al, CHS may have proved to be sufficiently conductive to accumulate charge, but for many materials, such as insulative polymer fibers, sufficient charge accumulation is difficult or impossible. By incorporating conductive fillers in the polymer matrix, charge accumulation throughout the bulk of the fiber is made possible. To demonstrate how this flocking mechanism is fundamentally different than each of those previously reported (utilizing fiber finishes or inherently semi-conductive materials), we flocked 0.5% AgNP/PCL fibers and surface-finished Rayon fibers after incubating at a different relative humidity (RH) for 24 h (Figure S2).[1–8, 16–21] Rayon fibers exhibited a sigmoidal response to RH, while the 0.5% AgNP/PCL fibers were largely unaffected by RH. As surface-finishes increase the moisture content of Rayon fibers, their performance is largely dictated by the humidity at which they are flocked and subsequent moisture content on the fiber surface. The humidity-independent flockability of the 0.5% AgNP/PCL fibers demonstrate a different method for surface charge accumulation. To further investigate the effects of percolation charging on flocking, PCL fibers were created with 0.00%, 0.01%, 0.25%, 0.50%, and 0.75% w/w AgNPs (Figure 2 a). These concentrations were based on estimated conductivities using the percolation theory, which estimates the conductivity of a composite material with conductive fillers.24–26 Using the series of equations25:
| (1.1) |
| (1.2) |
Figure 2. Characterizations of electrical conductivity, morphology, and Ag+ content and release of PCL microfibers with different AgNP loadings.
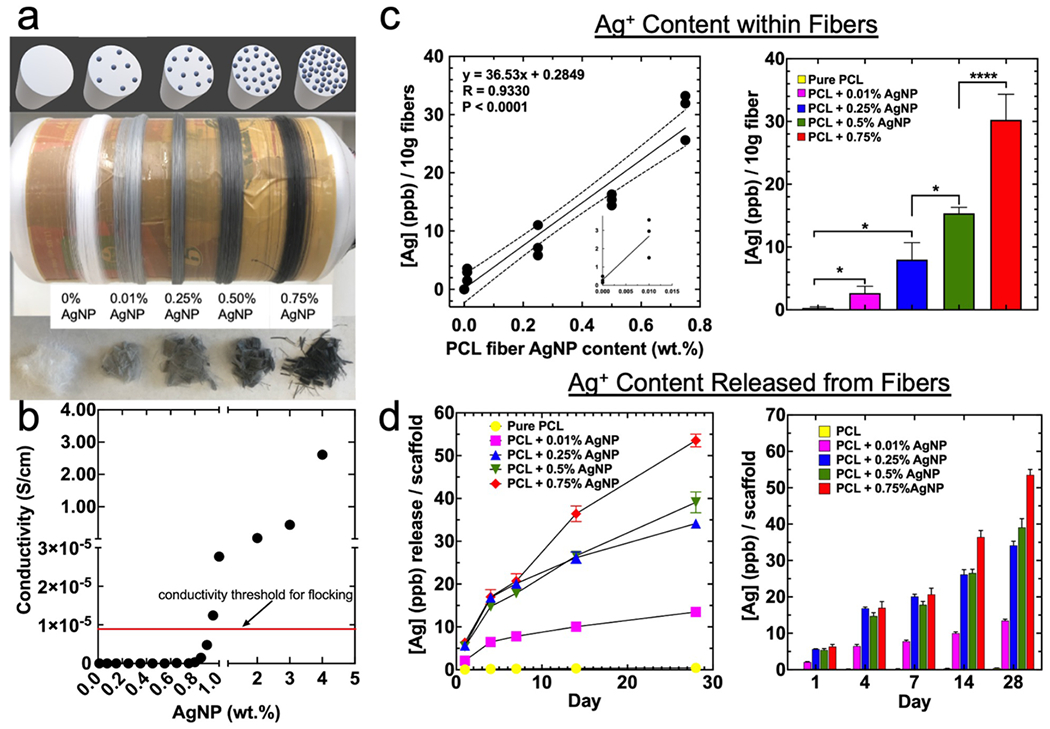
(a) (top) theoretical cross-section view of PCL microfibers at different AgNP concentrations, (middle) photograph of microfibers with increasing (left to right) concentration of AgNPs, and (bottom) different concentration AgNP microfibers after cutting. (b) Estimated conductivities using the Percolation Theory model for PCL microfibers loaded with 70 nm diameter AgNPs (conductivity threshold for flocking indicated with red arrow). (c) Relationship between loaded AgNP and detected Ag+ contained within fibers. Data is presented as mean ± standard deviation (n = 3) curve fit with simple linear regression. Significance was determined using a two-way ANOVA with Tukey’s multiple comparisons post-hoc test. (d) Ag+ release from microfibers with different AgNP concentrations over 28 days incubating in PBS. Data is presented as mean ± standard deviation (line graph and mean + standard deviation (bar graph) (n = 9)) and significance was calculated using a two-way ANOVA with Tukey’s multiple comparison post-hoc test. P value summary table is given in Table S1. Significance was denoted as follows: (*p < 0.05, ****p < 0.0001, no pairwise bar p > 0.05).
Where Vf is the filler volume fraction, Vp is the percolation threshold, is the conductivity of the composite material in S/cm, is the conductivity of the matrix material in S/cm, is the conductivity of the filler in S/cm, s is the critical exponent, and t is the critical index of conductivity. The percolation threshold, Vp, can be calculated as25:
| (1.3) |
Where K is constant and equal to 0.75, Ri is the radius of the matrix or insulating material, and Rc is the radius of the conductive filler. Based on this equation and the use of PCL as insulative fibers with diameter of 20 μm, AgNP with diameter of 70 nm, and critical index, t, of 1.5, fibers should attain a threshold conductivity of 8.97×10⁻⁴ S/cm and thus transition from unflockable insulative microfibers to charged flocking fibers. Equations 1.1–1.3 were used to calculate theoretical conductivity at different AgNP filler concentrations (Figure 2 b). To validate and quantify AgNP encapsulation within PCL microfibers produced by wet spinning, silver was detected using inductively coupled plasma mass spectrometry (ICP-MS) (Figure 2 c). The relationship between loaded and encapsulated AgNP allows for relatively accurate conductive filler loading such that critical conductive filler volumes can be estimated. Notably, silver leaching occurred in a concentration-dependent manner over a 28-day incubation in PBS at 37 °C, with a maximum Ag+ concentration (~55 ppb), falling far under the concentration at which toxicity is expected in vitro (~1250 ppb) (Figure 2 c).[27]
The morphology of scaffolds used for all biological tests (0.5% AgNP/PCL fibers, 1:1 gel:CHS adhesive, flock time = 15 min) appeared as anisotropic forests of microfibers (Figure 3 a). Fibers embedded and adhered well to the 1:1 gel:CHS adhesive, demonstrating stability and gradual degradation under prolonged incubation in simulated body fluid (SBF) (Figure 3 b, Figure 4 c iv).[28] Top and side views of scaffolds revealed high fiber density and alignment (Figure 3 d & e). Fiber densities of scaffolds generated at different time points were calculated by quantifying fibers in a given geometric area and scaling for total scaffold area. Not surprisingly, fiber density increased with flocking time and eventually reached maximum packing density at approximately 100 fibers/mm2 (Figure 3 c v). Similarly, porosity (measured as volume fraction of air) was quantified using a previously reported equation, with porosity linearly decreasing with flock time from roughly 95% to 85% (Figure 3 f).[16,20] Finally, anisotropy was analyzed and quantified using tensor analysis and compared to a control (Rayon with a proprietary flocking finish) used in industrial flocking applications (Figure 3 g & h). Quality of alignment between Rayon and 0.50% AgNP/PCL fibers was extremely similar, with both fibers achieving relatively high alignment (KS D = 0.3860, peak frequency = ns) (Figure 3 g & h).
Figure 3. Characterization of flocked scaffolds made of 0.5% AgNP-loaded PCL microfibers.
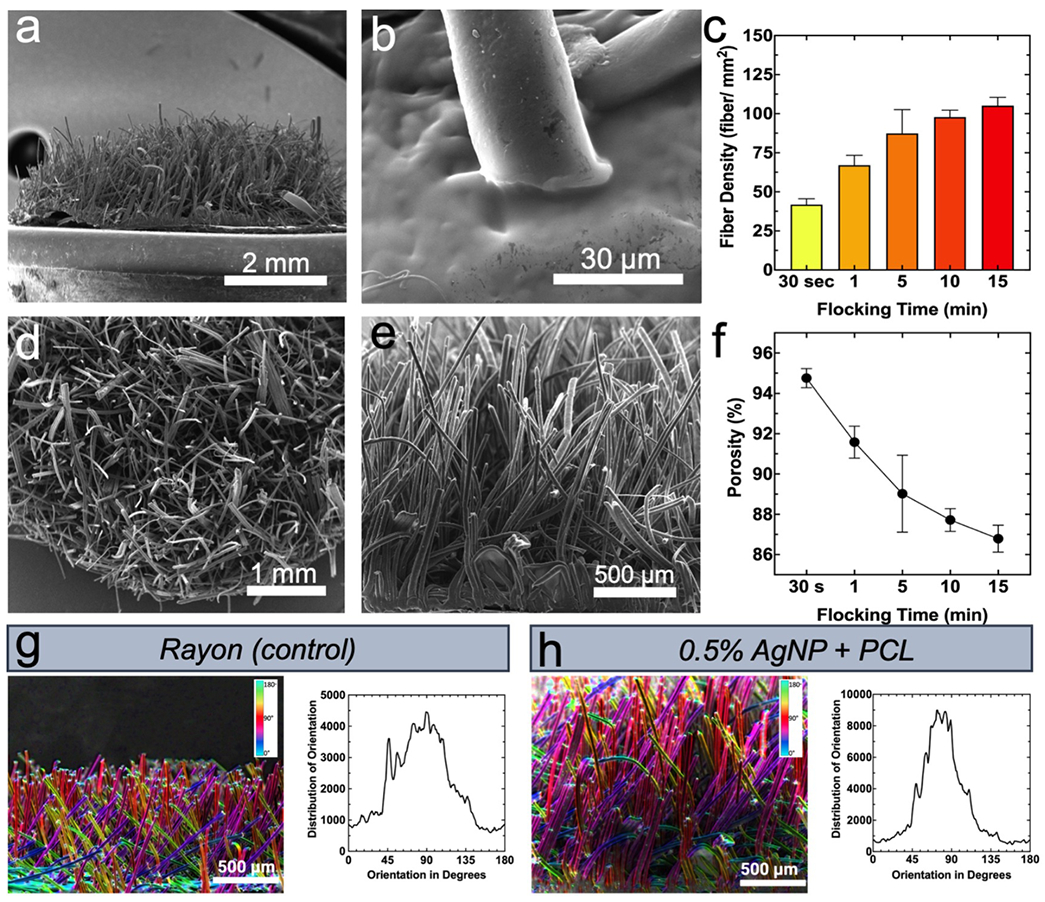
(a) SEM image showing side view, (b) interface between flock fiber and chitosan adhesive, (d) top view, and (e) magnified side view of flocked scaffolds. (c) Relationship between flock time and fiber density. (f) Calculated scaffold porosity. Data in (c) and (f) is presented as the mean ± standard deviation (n = 8) and significance was calculated using a one-way ANOVA with Tukey’s multiple comparison post-hoc test. P value summary tables are given in Table S2. (g, h) Characterization of anisotropy of flocked scaffolds. (g) (right) Colorimetric analysis of Rayon (control) flock fiber orientation and (left) distribution of Rayon flock fiber orientation. (h) (right) Colorimetric analysis of 0.5% AgNP/PCL flock fiber orientation and (left) distribution of 0.5% AgNP/PCL flock fiber orientation. Data for (g) and (h) is presented as a continuous frequency of fiber orientation and distributions were compared using a Kolmogorov-Smirnov test (K-S D = 0.386).
Figure 4. Surface flocked biomedical substrates and self-folding conduit.
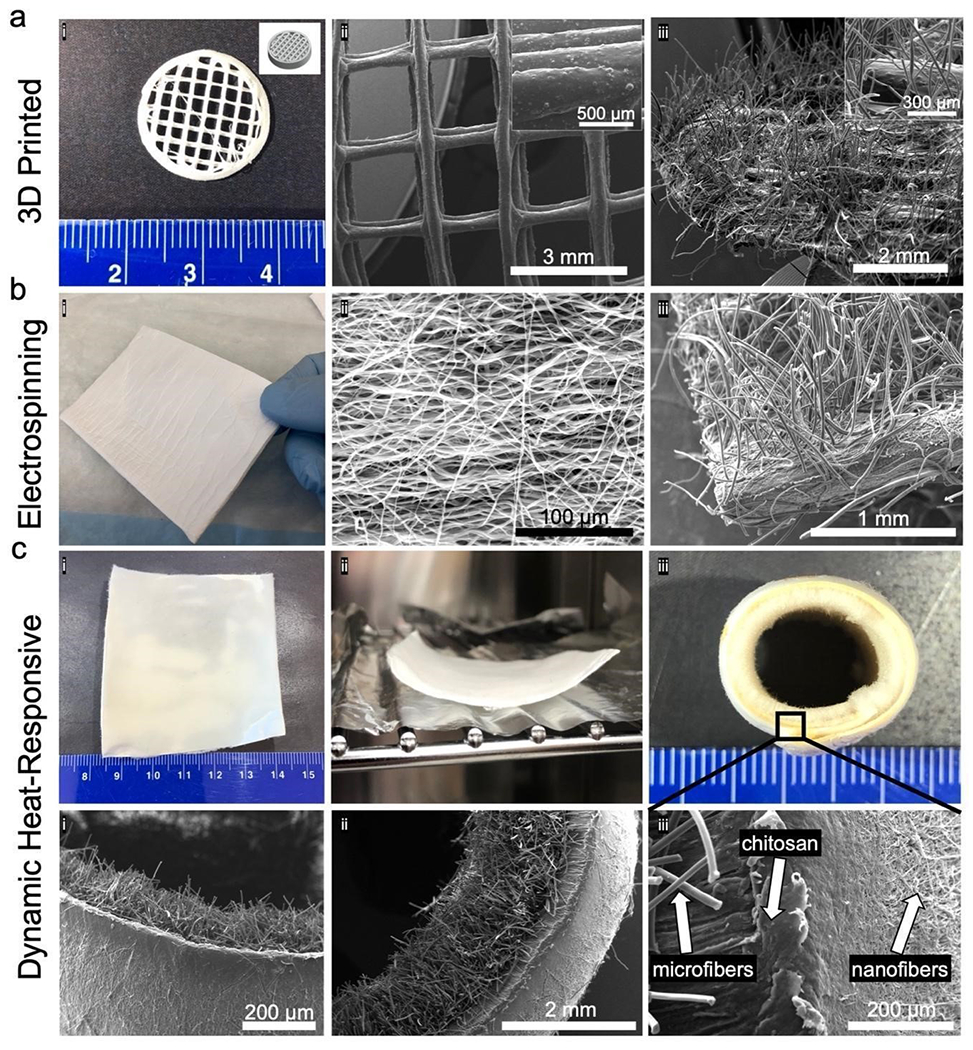
(a) Flocked 3D printed multi-layered meshes. (i) Photograph and CAD file for 3D printed PCL/hydroxyapatite circular mesh substrate. SEM images of mesh substrate before (ii) and after (iii) electrostatic flocking of 0.5% AgNP/PCL microfibers. (b) Flocked electrospun nanofiber membrane. (i) Uncoated PCL nanofiber substrate. SEM image of the PCL mesh before (ii) and after (iii) electrostatic flocking of 0.5% AgNP/PCL microfibers. (c) Heat-responsive triphasic conduit. (i) PCL nanofiber mat after flocking with PLA microfibers. (ii) Heat application to PLA-flocked PCL nanofiber mat to initiate curling. (iii) Photograph of PLA-flocked PCL nanofiber mat after self-curling and fixation. (iv) SEM image of PLA-flocked PCL nanofiber tube edge and (v) cross-section. (vi) SEM image highlighting the micro-to-nanofiber interface separated by an adhesive layer.
To demonstrate flexibility of flocking for biomedical applications, flocked scaffolds utilizing 3D-printed and electrospun nanofiber membranes were generated. Hydroxyapatite (HA)/PCL circular, multi-layer meshes were produced by extrusion-based jet printing (Figure 4 a i, ii). Similar 3D-printed scaffolds have been used in cranial and mandibular bone regeneration.[29,30] Aligned electrospun PCL nanofiber membranes were prepared following previously reported methods, and have broad biomedical applications (Figure 4 b i).[31–34] Both 3D-printed HA/PCL and electrospun PCL scaffolds were used as flocking substrates and subsequently dipped in 1:1 gel:CHS adhesive, affixed to the ground electrode, and coated with flocked 0.50% AgNP/PCL flocking fibers. After flocking, 3D-printed scaffolds retained their original millimeter sized pores while exhibiting a single-faced, anisotropic flock fiber finishing (Figure 4 a iii). In application, flock fibers could act as anchor points for cell proliferation, guiding cells towards the 3D-printed meshes and accelerating proliferation and integration into the bulk 3D-printed substrate. Similarly, the nanofibrous topological morphology of flocked electrospun nanofiber membranes were retained after flocking with 0.50% AgNP/PCL microfibers (Figure 4 ii, iii). Flocked nanofiber scaffolds exhibited a biphasic structure, with microfibers positioned perpendicular to the aligned nanofibers. Objects with biphasic structures are particularly useful in regenerative medicine as they allow for precise directional control over cells at implant sites.[35–37] To demonstrate the literal flexibility of flocking, a self-folding, triphasic, and hierarchical conduit was fabricated using highly-aligned electrospun PCL nanofiber membranes, 1:1 gel:CHS adhesives, and poly(lactide) (PLA) flocking fibers (Figure 4 c i). Since PCL has a lower melting temperature than PLA, gently heating (65 °C, 30 min) the flocked construct initiated folding along the nanofiber direction without melting or deforming PLA flock fibers (Figure 4 c ii). After 24 h, the conduit had formed a cylinder with flock fibers projecting inward (Figure 4 c iii). Scanning electron microscopy (SEM) images revealed three distinct phases: microfibers (core), gel:CHS adhesive (fiber interface), and nanofibers (conduit walls) (Figure 4 c i–iii). Such a device may serve as an skeletal muscle graft/anchoring device or intestine mimicking material, as the outer nanofiber sheath may prevent other cell lineages from infiltrating the conduit, but the interior flocking fibers can serve as anchor points and proliferative guides for designated cell types.[38–40] Finally, to provide a first-of-kind reference for others in material science, a brief, biomedically-relevant library of different polymers and conductive treatments for creating flockable fibers was established (Figure 5). Using the aforementioned methods, fibers made from PCL, PLA, and poly(lactic-co-glycolic acid) (PLGA) and treated with hexadecyltrimethylammonium bromide (HTAB), ferric chloride (FeCl3), AgNPs, zinc powder, sodium chloride (NaCl), and superparamagnetic iron oxide nanoparticles (SPIONS) were used to create flocked scaffolds (Figure 5 a). Fiber alignment and mass lifted during flocking was quantified for reference for future filler/polymer-specific applications (Figure 5 b, c).
Figure 5. Flocked scaffolds assembled from different microfiber compositions.
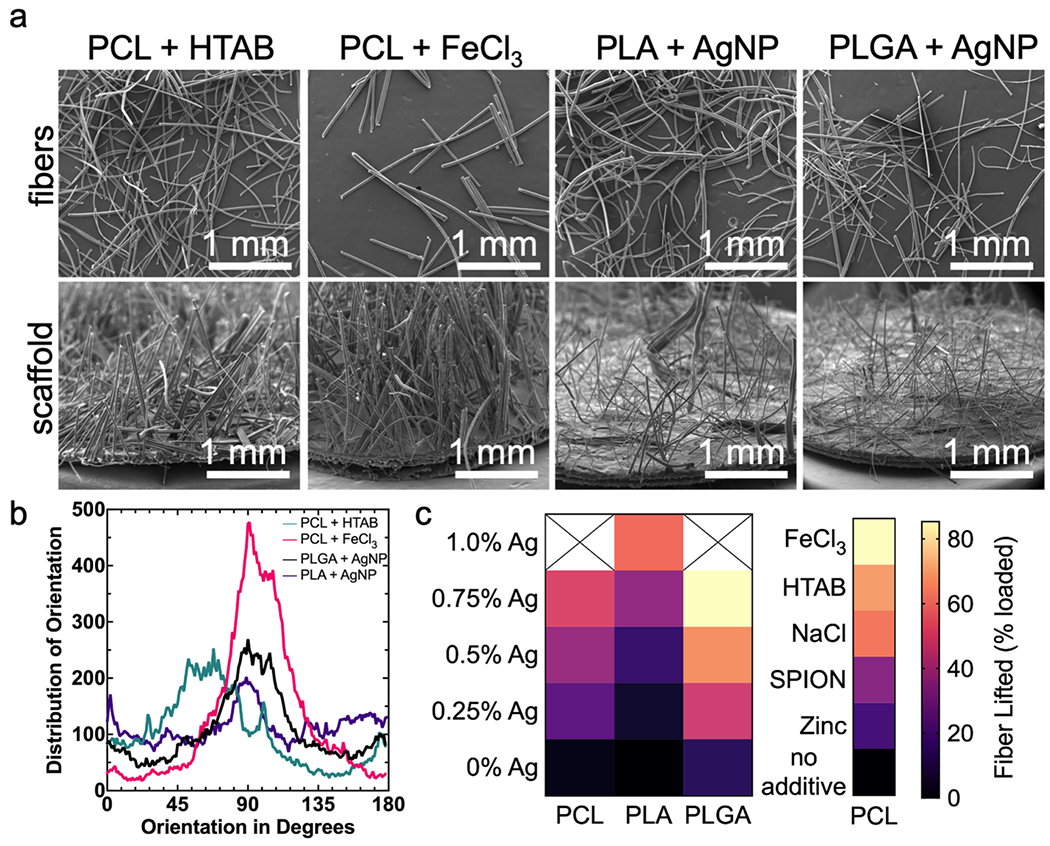
(a) SEM images of (top) individual microfibers of different polymeric/additive compositions and (bottom) flocked scaffolds with each different fiber composition. (b) The quality of anisotropy by distribution of fiber orientation of each kind of fiber. Data is presented as continuous frequencies of fiber orientation (c) A heatmap displaying the percentage of AgNP-loaded PCL, PLA, and PLGA fibers and 1.0% w/v FeCl3, 1% w/v HTAB, 1% w/v NaCl, 0.75% w/v SPION, 1.0% w/v zinc powder, and pure PCL fibers lifted during electrostatic flocking. Data is displayed as the mean value (n = 3) and corresponds with the heat map legend for mean % lifted. Significance was determined using a one-way and two-way (main effects model) ANOVA with Tukey’s multiple comparison post-hoc test. Significance and summary data are reported in Table S3 & S4.
After outlining fabrication, characterization, and flexibility of flocking with percolation theory-induced conductivity, we sought to evaluate biological activity and potential applications of flocked scaffolds. Herein, flocked scaffolds composed of 0.50% AgNP/PCL flock fibers, 1:1 gel:CHS adhesives/substrates were evaluated for mechanical stability, antimicrobial efficacy, cytotoxicity, in vitro cellular response, and in vivo response following subcutaneous implantation.
Mechanical stability of flocked scaffolds is particularly relevant in load-bearing, shearing, or abrasive applications (e.g., cartilage engineering, skin tissue engineering, long bone engineering). Flock fibers should retain elasticity to withstand tissue deformations that could break and fragment brittle fibers. Uniaxial tensile testing on fibers with different AgNP concentrations revealed that small filling loads of AgNP decreased ultimate tensile stress (UTS) up to a certain concentration, and gradually increased UTS at higher filling loads (Figure 6 a i–iv). This disruptive phenomenon is likely explained by high filler fractions that establish necking resistance.[41] Similarly, a trouser tear test with multiple iterations on GA-crosslinked 1:1 gel:CHS substrates revealed that the tear resistance of flocked scaffold adhesive/substrate complexes was approximately double the tear resistance of natural human upper back skin (Figure 6 b i–iv).[42] Stability of the scaffold during linear abrasion was investigated using a ‘thumb test’, a common abrasion resistance test in the flocking industry. Scaffolds showed modest abrasion resistance after 25 cycles and the majority of the mass loss by way of fiber loosening. Degradation of flocked scaffolds using three different adhesives (GA-crosslinked gel, GA-crosslinked gel + CHS, and thermally cured and GA-crosslinked CHS only) was analyzed in BSF, with GA-crosslinked gel + CHS having the most desirable degradation rates (~50% by day 20).
Figure 6. Mechanical characterization of flocked scaffold components.
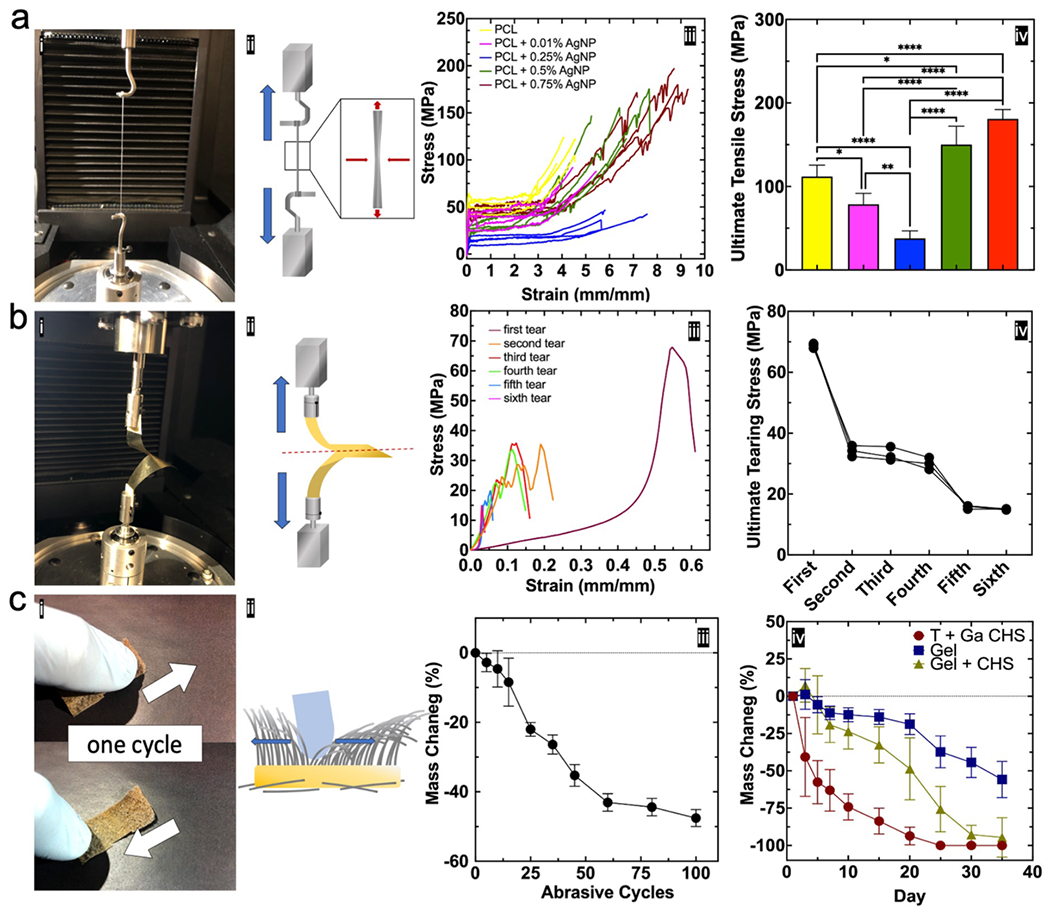
(a) Fiber tensile test. (i) Photograph of tensile testing set up (multiple fibers were loaded onto grips for visibility). (ii) Schematic illustrating tensile test and fiber necking. (iii) Stress-strain curves at different AgNP loading concentrations. Data is presented as non-smoothed stress-strain curves (n = 4). (iv) UTS for PCL microfibers loaded with varying AgNP concentrations. Data is presented as the mean ± standard deviation (n = 4) and significance was determined using one-way ANOVA with Tukey’s multiple comparison post-hoc test. (b) Substrate tear test. (i) Trouser tear test set up and (ii) schematic. (iii) Tear test results following six iterative transverse tears on a chitosan substrate. (iv) Ultimate tearing stress at each transverse tear iteration. Data is presented as the individual values on each continuous tear iteration (n = 3) and significance was determined using one-way ANOVA with Tukey’s multiple comparison post-hoc test. Summary P values are given in Table S5. (c) Abrasion resistance test. (i) Picture and (ii) schematic showing the thumb test for abrasion resistance. (iii) Mass change of 0.5% AgNP/PCL after 100 abrasive cycles. Data is presented as the mean ± standard deviation (n = 3) and significance was determined using one-way ANOVA with Tukey’s multiple comparison post-hoc test. Summary P values are given in Table S6. (iv) Degradation rates of different substrates in simulated body fluid (SBF). (T = thermally crosslinked, Ga = glutaraldehyde crosslinked). Data is represented as the mean ± standard deviation (n = 10) and significance was determined using two-way ANOVA with Tukey’s multiple comparison post-hoc test. Summary P values are given in Table S7. Significance was denoted as follows: (*p < 0.05, **p < 0.01, ****p < 0.0001, no pairwise bar p > 0.05).
Considering the anisotropic nature of flocked scaffolds, we suspected the flock fibers would act as topographic cues for cells, guiding their migration and sustaining proliferation. Ultimately, flocked scaffolds should sustain full tissue formation and increase the rate of cell infiltration in defect sites. To evaluate the biological function of the flocked scaffolds, rat bone marrow-derived mesenchymal stem cells (rBMSCs) were seeded onto ethylene oxide-sterilized flocked scaffolds and allowed to proliferate for 7 days before imaging (Figure S3 a). Cells seeded onto the scaffold showed significant proliferation and retained high viability, with migratory patterns similar to those reported by Gossla et al. (migrating from the substrate base to fiber tips) (Figure S3 b,c).[16] Further, flocked scaffolds had AgNP dose-dependent antimicrobial efficacy against Methicillin-resistant Staphylococcus aureus (MRSA), reducing colonies from approximately 1.5×10⁶ CFU/mL to less than 8 CFU/mL for all scaffolds incorporating AgNPs. Antimicrobial activity appeared imparted by both AgNPs and the natural antimicrobial properties of CHS, though CHS served as the primary source of antibacterial activity (Figure S3 d,e).[33,43,44] Tissue formation on flocked scaffolds was mapped over a 28-day period using actin/DAPI-stained rBMSCs and 3D confocal imaging and average distance migrated was measured. After 28 days of culture, cells migrated away from the base of the substrate, forming successive tissue layers that extended nearly 800 μm from the substrate (Figure 7 a,b). The results from the tissue formation study confirmed that the flock fibers act as migratory guides for proliferative cells.
Figure 7. In vitro and in vivo biological response.
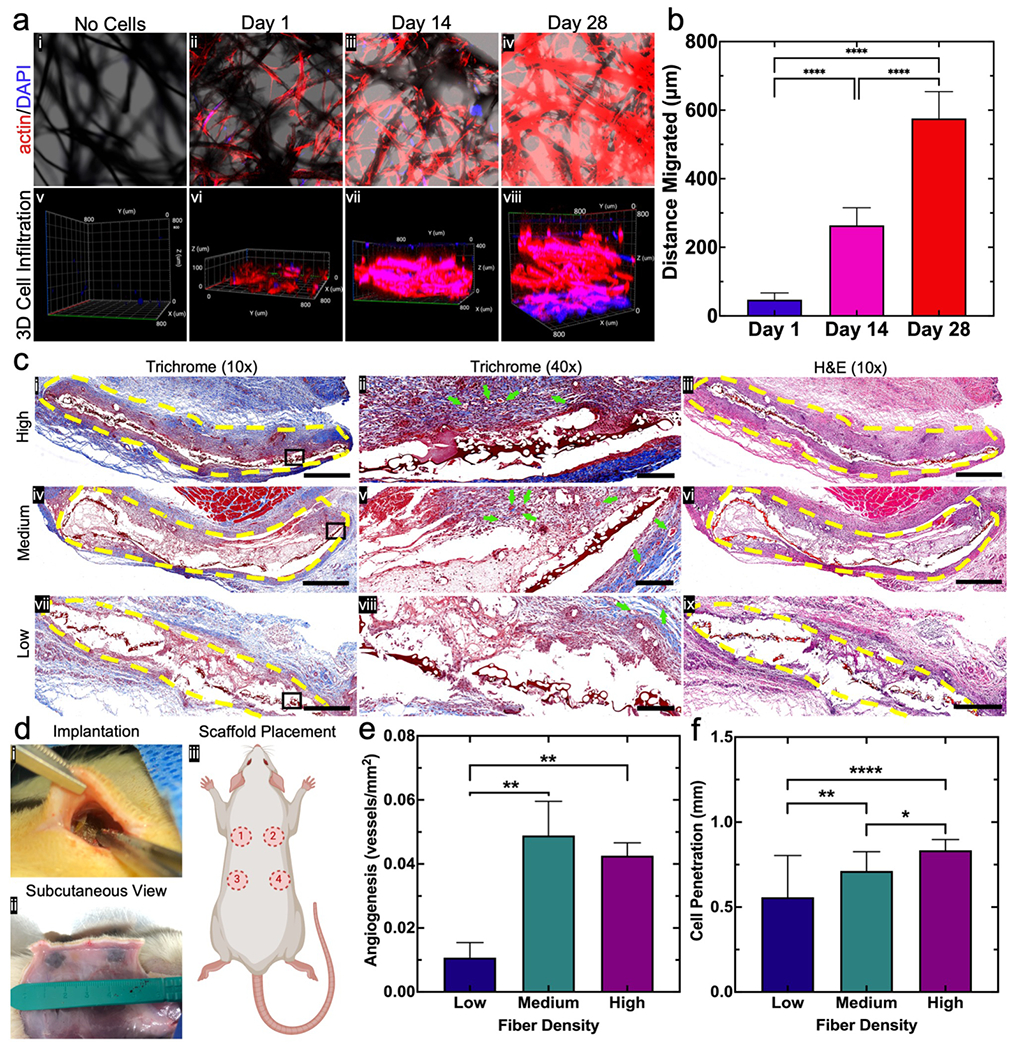
(a) Cell infiltration into 0.5% AgNP/PCL flocked scaffolds. (i-iv) Maximum intensity actin/DAPI confocal microscopy images of rBMSCs seeded onto 0.5% AgNP/PCL flocked scaffolds after 1, 14, and 28 days. (v-viii) 3D orthogonal view of actin/DAPI stained rBMSCs cells after seeding onto 0.5% AgNP/PCL flocked scaffolds and culturing for 1, 14, and 28 days. (b) Average distance of tissue layer migration over 28 days. Data is presented as the mean ± standard deviation (n = 5) and significance was determined using a one-way ANOVA with Tukey’s multiple comparison post-hoc test. (c) Subcutaneous implantation of 0.5% AgNP/PCL scaffolds with low, medium, and high fiber densities in Sprague-Dawley rats (n = 4). (i,iv,vii) (left) Trichome (10x) images of surrounding tissue (yellow lines indicate flocked scaffolds), (ii,v,viii) (middle) Trichome (40×) images indicating newly formed blood vessels (green arrows), and (iii,vi,ix)(right) H&E (10×) staining of surrounding tissues (yellow lines indicate flocked scaffolds). Scale bar = 1 mm and 200 μm for 10× and 40× images, respectively. (d) (i) Scaffold positioning during surgical implantation (fibers facing outward). (ii) Subcutaneous view of flocked scaffolds. (iii) Approximate scaffold placement on rats. (e) Angiogenesis around low-, medium-, and high-density flocked scaffolds. Data is presented as the mean ± standard deviation (n = 4) and significance was determined using a one-way ANOVA with Tukey’s multiple comparison post-hoc test (**p < 0.01). (f) Host cell penetration (measured as average migration from scaffold edge) into low-, medium-, and high-density flocked scaffolds. Data is presented as the mean ± standard deviation (n = 4) and significance was determined using a one-way ANOVA with Tukey’s multiple comparison post-hoc test. Significance was denoted as follows: (*p < 0.05, **p < 0.01, ****p < 0.0001, no pairwise bar p > 0.05).
Noting the salutary in vitro effect on proliferation, viability, antimicrobial efficacy, and tissue-forming capability, we investigated in vivo responses by subcutaneously implanting flocked scaffolds in rats. Scaffolds with varying fiber densities were subcutaneously implanted on rat dorsum, with fibers superficial to the substrate (Figure 7 d i–iii). After 7 days, tissue surrounding the flocked scaffolds (area outlined in yellow) was removed and analyzed for cell infiltration and angiogenesis (green arrows) (Figure 7 c ii,v,viii). Cell penetration and angiogenesis occurred in a fiber density-dependent manner. New vessel formation and improved cell infiltration was greater in tissues with medium and high fiber density scaffolds compared to low fiber density scaffolds (Figure S4 & S5). We postulate that the flock fibers and flocked scaffold served as anchoring points that could promote cellular migration from the surrounding native tissue into the defect (Figure 7 e,f and Figure S4). The results from the in vivo study demonstrated that: (1) implanted flocked scaffolds could withstand local shearing forces under skin; (2) angiogenesis occurred in a fiber density-dependent manner; (3) cell infiltration was accelerated in a fiber density-dependent manner.
3. Conclusions
As demonstrated in this work, electrostatic flocking utilizing charge accumulation based on the percolation theory is a widely-applicable method for creating anisotropic surfaces or standalone objects. In general, electrostatic flocking is quick process that is easy to scale up and is limited only by an objects’ ability to be coated by an adhesive. Compared to other systems, such as freeze-casting or electrospinning, electrostatic flocking is a much faster technique that has increased functionality and broader applicability. However, several limitations exist in utilizing electrostatic flocking. First, uniformly cutting flock fibers is difficult, even on an industrial scale. In particular, cutting thermoplastics is difficult due to their low melting temperatures. Fiber deformity may be common, so sieving or sifting of cut fibers is a necessary step in ensuring only uniform fibers are flocked. Additionally, ensuring uniformity of charge distribution during fiber charging is difficult. Fibers that adhere to one another may be subject to branching during flocking, which leads to non-uniform surface coatings.
In summary, this study supports the use of electrostatic flocking as a broadly-applicable technology by detailing multiple methods for flocking insulative polymer microfibers. For the first time, we documented the fabrication of flocked scaffolds using insulative biopolymers by incorporating conductive filler treatments based on principles from the percolation theory. We generated a working library of different fillers and polymers, as well as estimated necessary AgNP loading content to achieve flockability in PCL microfibers. We highlighted the broad applicability of this technique by surface flocking 3D-printed HA/PCL meshes and PCL nanofiber membranes and creating a novel triphasic, self-folding conduit. In addition to generating data supporting the biocompatibility, mechanical stability, and antimicrobial efficacy of flocked scaffolds, we demonstrated tissue formation in vitro and in vivo, which could be modulated by altering flock fiber densities. Electrostatic flocking may potentially serve as a renewed and highly-applicable shift in biomaterial and surface coatings, as its use is limited only by the size of the substrate/object to be flocked. Flocked fibers can act as forests of cell/tissue anchors in a variety of implantable applications, such as hernia meshes, soft tissue prosthetics, cranial defect scaffolds, and cartilage scaffolds. Outside of biomedical applications, flocked surfaces utilizing our methodology may have applications in adhesives, composite materials, renewable energy, and surface chemistry as a broad field.[6,8,9,45,46] This study offers the groundwork for other researchers to make groundbreaking discoveries and innovative materials utilizing electrostatic flocking.
4. Experimental Section
Wet Spinning Continuous Conductive Microfibers:
To fabricate continuous conductive microfiber tow, PCL pellets and AgNP powder (70 nm) were dissolved in DCM:DMF (4:1) to yield a 20% w/v PCL and 0-0.75% w/v AgNP polymeric solution. The PCL and AgNP solution was allowed to dissolve completely and was subsequently mixed thoroughly under gentle heat (65°C) and stirring. Once the solution was homogenous, it was loaded into a syringe and extruded through a 3D printed 5-emitter extrusion device with 21 ga needles on a benchtop wet spinning device at a rate of 3.0 mL/h into a coagulation bath of 70% room temperature ethanol. The multiple emitter device was designed with five outlets and one inlet and was printed using a digital light processing (DLP) 3D printer (Vida, EnvisionTEC) and Clear Guide material (EnvisionTEC). The base of the emitter is 63 mm long, 8 mm wide, and 8 mm tall, with outlet fittings extruding 7 mm from the base. The inlet is on the end of the base, perpendicular to the five outlet nozzles. The outlets nozzles are arranged in a linear array and are spaced 12 mm from their centers. Fibers were collected by a drum collector approximately 6 inches above the coagulation bath. After the wet spinning process was finished, the fiber tow was allowed to dry completely and was subsequently removed by razor and manually stretched to align the polymer molecules.
Producing Flocking Fibers from Fiber Tow:
In order to convert the fiber tow to flocking fibers, a two-step process was developed. First, the fiber tow was spread out fan-wise and manually cut at approximately 1 mm in length and collected in a collecting bowl or by vacuum. Next, since fiber fusion along cutting lines is inevitable due to PCL’s thermoplastic nature, fibers had to be mechanically separated. All collected fibers were suspended in a 500 mL beaker of ice water and sonicated in successive 1 h intervals until the majority of fibers were separated and appeared as a slurry. Any large remaining fiber clumps were further broken up by vigorous bubbling using an adapted bubbler in a 1 L Erlenmeyer flask. The resulting fiber slurry was strained with a mesh strainer and allowed to dry under vacuum. All fibers were stored in humid (70% conditions until ready for use).
Fabrication of Adhesives:
Both CHS and gel adhesives were prepared as previously reported. Briefly gel adhesives were prepared by dissolving 2 g of gel in 10 mL of H2O at 50 °C under constant stirring for 24 h, yielding a 20% w/v gel solution.[11] CHS adhesive was prepared by dissolving 0.5 g of CHS 95/500 in 10 mL of a 5% w/w AcOH/H2O solution and stirring at 50 °C for 24 h, yielding a 5% w/v CHS adhesive solution.[6] Additionally, a 1:1 gel:CHS blend was prepared by mixing both CHS and gel solutions under gentle heating and stirring. Before flocking, each adhesive was warmed to 50 °C and poured onto the substrate or electrode. A razor blade was used to knife coat the entire surface of the substrate. 3D printed scaffolds were dip-coated in a 50 mL beaker of adhesive and allowed to drip until only a fine coating remained.
Fabrication of Substrates:
Pure CHS substrates were prepared based on a previously reported method.[6,7] Briefly, a 20% CHS solution was poured onto the electrode and dried at 60 °C overnight. Additionally, 3D circular mesh substrates were prepared by 3D-printing a similar material as previously reported.[51,52] Briefly, mesh scaffolds were extrusion 3D-printed using a BioPlotter (EnvisionTEC) using a 22 gauge needle. Meshes are composed of 35% w/v PCL (MW = 80,000, Sigma Aldrich, St. Louis, MO) and 1:2 hydroxyapatite (Hap nanocrystals, avg. 100 nm, Berkeley Advanced Biomaterials, Inc., Berkeley, CA) in 1:1:1 dichloromethane (DCM):dimethylformamide (DMF): tetrahydrofuran (THF). The meshes were printed with an 8 mm-diameter outside border with infill strands 1 mm apart and consist of 3 layers measuring approximately 1.2 mm thick. The layers are stacked with strands perpendicular to the preceding layer and create a porous structure. The scaffolds were lyophilized for 24 h and subsequently plasma treated before use. Electrospun membranes were synthesized as previously reported.[53] Briefly, a 10% w/v solution of pure PCL in 4:1 DCM:DMF was electrospun at a flow rate of 0.8 mL/h, voltage of 14 kV, RH of 40-65%, and collected on a rotation collector until the desired thickness was achieved. Due to the nature of the CHS on the 3D printed and CHS substrates, no additional adhesive was used to fix the substrates to the grounded electrode. For the PCL nanofiber mats, squares slightly larger than the electrode were cut and the corners taped around the electrode.
Flocked Scaffold Assembly:
Prior to flocking, flock fibers were removed from humidity-controlled storage and loaded into a mechanical sieve attached to a motor (MaagFlock, Germany). The fibers were sieved onto the surface of the electrode until the surface of the electrode was completely covered and fibers were uniformly distributed. Next, the ground electrode was affixed roughly 4 in from the charging electrode and a voltage was applied in sweeping cycles. Voltage gradually increased from 30 kV to 60 kV in cycles to avoid cloud formation. Once the fibers were adequately flocked, the electrode was removed and dried in a 60°C oven for 5 min and allowed to thermally cure at ambient conditions for 1-2 h. After curing, scaffolds were removed using a razor blade. Scaffolds were then crosslinked in a 1% glutaraldehyde chamber for 24 h. Finally, finished scaffolds were washed with deionized H2O 5 times to remove any loose fibers and stored at ambient conditions.
Analysis of Flock Time on Scaffold Structure:
Analysis of flocking time was determined by calculating the number of fibers flocked as a function of time. An equivalent (10 g) load of flock fibers were evenly sieved onto the charging electrode and a uniform voltage swinging from 30-60 kV was applied for 30 s, 1 min, 5 min, 10 min, and 15 min. Scaffolds prepared at each time point were imaged by SEM and the fiber density was calculated by taking the average fiber count of 4 representative areas of equivalent size. Fiber counting was carried out using a modified method for counting cells on ImageJ, where the tops of fibers were counted as circles.
Quantification of Porosity:
Scaffold porosity was determined using a previously reported method. Briefly, the volume for total scaffold was derived by assuming a solid cylinder with a diameter (D) the size of the substrate and height (h) as the length of the fibers. Next, the total fiber volume was subtracted from the total scaffold volume, leaving porous volume remaining.
Fiber Flockability Determination:
To determine the quality of flockability, fibers of different compositions and finishes were prepared. After drying, roughly 1 g of each fiber type of sieved and flocked with a swinging voltage from 30-60 kV. After flocking for 1 min, the mass of the remaining fibers was taken. The total fibers lifted was determined as the difference between sieved fiber mass and remaining fiber mass. Similarly, to determine the effect of humidity on flockability, fibers were incubated at 0, 10, 20, 40, and 50% RH for 1 h before flocking in ambient conditions.
Characterization of Flocking Fibers:
Fiber morphology was characterized using a scanning electron microscope (SEI, Germany) and USB microscope at different steps in the flock fiber fabrication process. To quantify diameter and length of fibers, SEM images were analyzed using ImageJ length analysis. To quantify the mechanical properties of the fibers, an ultimate tensile strength test was used (Agilent, Keysight). To determine fiber conductivities, an equation from the percolation theory was derived and served to estimate conductivities as a function of AgNP concentration. ICP-MS was used to determine the AgNP concentration within bulk fibers as previously reported. Briefly, 10 g of fibers were dissolved in DCM and analyzed by ICP-MS. Similarly, the amount of Ag+ eluted from fibers was determined by submerging 10 g of fibers in 300 mL of PBS at 37 °C for 1, 4, 7, 14, and 28 days. At each time point, the PBS was mixed and removed from each well, stored in a 50 mL jar, frozen, and lyophilized. Following freeze-drying, samples were analyzed by ICP-MS using the aforementioned methodology.
Characterization of Flocked Scaffolds:
Scaffolds were mechanically characterized by an abrasion test and by a tearing test. For abrasion resistance analysis, scaffolds were fixed to the bottom of a bowl of deionized H2O with double sided tape. Pressure was applied using the tip of the thumb and a back-and-forth rubbing was carried out under wet conditions. Abrasion resistance was summarized by the change in mass as a function of rubbing cycles. Scaffold masses were taken after 5, 10, 15, 20 25, 35, 45, 60, 80, and 100 cycles. Critical fracture energy was measured using a trouser-tear test, where the substrate was subject to iterative uniaxial tears on a mechanical testing machine (UTM Keysight). All scaffolds were imaged by SEM and camera photographs. Distribution of fiber orientation (quality of alignment or degree of anisotropy) was analyzed using OrientationJ, an open source plugin to use with ImageJ FIJI. Scaffold degradation was measured by submerging scaffolds in a previously reported body simulating fluid (BSF) for 1, 3, 5, 7, 10, 15, 20, 25, 30, and 35 days and recording the change in mass of each scaffold.
Fabrication of Thermo-responsive self-folding flocked biphasic nanofiber tube:
Nanofiber mats were electrospun as previously reported using 10% w/v PCL. Briefly, 10% w/v PCL was dissolved in solvent mixture of 4 parts DCM and 1 part DMF (4:1 DCM:DMF) and the resulting polymer solution was electrospun at 12 kV at 0.8 mL/h and collected on a rotating mandrel. The resulting PCL mats were plasma treated with atmospheric oxygen for 3 min, submerged in water, and a thin layer of CHS adhesive (5% w/v CHS in AcOH) was knife-coated on the surface. Next, the nanofiber mat was fixed to the ground electrode by pushing the wet mat firmly against the surface. Approximately 0.5 g of FeCl3 PLA flock fibers (supplied by Spectro Coating) were mechanically sieved onto the charging electrode and flocked onto the surface of the nanofiber mat by an applied voltage gradually increasing from 30 to 60 kV. The flocked mat was removed and placed a 45 °C oven for 30 min to initiate self-folding. After heating, the flocked mat was placed in a desiccator overnight. A small portion of overlapping nanofiber mat was treated with CHS adhesive (gluing the overlapping edges of the tube) and crosslinked in a GA chamber for 24 h the following day. Before imaging, the tubes were cut into smaller thoroughly washed with deionized water to remove any loose fibers.
Cell Proliferation Assay:
After preparing AgNP/PCL scaffolds, an 8 mm biopsy punch was used to create circular scaffolds that would fit inside a 48 well plate. After punching scaffolds to size, each scaffold was sterilized by ethanol submersion for 24 h and UV sterilization for 12 h. Prior to cell seeding, all scaffolds were rinsed 5 times with PBS and 3 times with cell culture media. Prior to moving each scaffold into the 48 well plate, each well bottom was coated with 1% agarose to prevent cell adhesion to the plate bottom. Rat bone marrow derived stem cells (rBMSCs) were seeded as previously reported. Briefly, 300 μL of cell suspension of 30,000 cells/mL was added dropwise directly onto the flocked scaffold and cultured in complete DMEM cell media at 37°C. After 24 h, the media was replaced, and was replaced every 48 h for the remainder of the experiment. At 1, 3, 5, and 7 days, cells were stained with LIVE/DEAD stain and imaged using confocal microscopy. Additionally, at each time point, cell counts were taken using a cell counter.
Cell Viability:
To assess the cytotoxicity of the AgNP/PCL scaffold with differing amounts of AgNP, PCL fibers were prepared with 0%, 0.01%, 0.25%, 0.5%, and 0.75% AgNP. Fibers were prepared, cut, separated, and sterilized as previously mentioned. However, since fibers with low AgNP concentrations cannot flock, fibers were used to make a small layer on the bottom of each well in a 48 well plate. Exactly 300 μL of a 30,000 cells/mL rBMSC cell suspension was added directly to 1% agarose-covered well of a 48 well plate. Media was changed after the first 24 h, and every 48 h following seeding. After 1, 3, and 5 days, scaffolds with cells were removed and added to a new plate with fresh media and CCK-8 solution and incubated for 4 h. After incubation, absorbance values were measured at 450 nm wavelength on a microplate reader (GenTek).
3D Tissue Culture:
To observe the spatial distribution of cells on flock fibers, rBMSCs were cultured on 0.5% AgNP/PCL scaffolds using the previously described steps. Cells were seeded at 150,000 cells/mL and cultured for 28 days. At 1, 14, and 28 days, scaffolds were removed and stained with actin and DAPI stains. Stained scaffolds were imaged using confocal microscopy. To compile 3D images, z-stack images were taken at 10 μm intervals over a total length of 1 mm and a 3D image was generated using Zeiss 3D image viewer. The average depth of cell penetration was generated by measuring the distance of 20 randomly selected cells from the substrate.
Antibacterial Study:
To assess the potential antibacterial efficacy of the AgNP/PCL flocked scaffolds, two antibacterial assays were carried out as previously reported. First, a zone of inhibition contact study was carried out with 0.5% AgNP/PCL. Briefly, 100 μL Methicillin-resistant Staphylococcus aureus USA 300 (MRSA, ~107 CFU/mL) suspension solution was cultured on an LB-agar coated petri dish. Flocked scaffolds were directly placed onto the surface of the bacterial culture and incubated at 37°C overnight. The following day, the zone of inhibition was recorded via photography. After ascertaining an antibacterial effect, another antibacterial culture study was carried out by directly adding each scaffold component and fibers with 0%, 0.01%, 0.25%, 0.5%, and 0.75% AgNP directly to the ~107 CFU/mL MRSA suspension and incubating overnight. The following bacterial culture was plated directly to an LB-agar coated petri dish and incubated overnight again. The resulting colony forming units (CFUs) were counted at each fiber composition using the open source ImageJ FIJI plugin, ColonyCounter.
Subcutaneous Implantation:
12 male Sprague-Dawley rats (8-10 weeks old) were purchased from Charles Rivers Laboratories and housed in an AAALAC-accredited animal facility at 20.0-26.1 °C with a set point of 22.2 °C, 30–70% humidity with a set point of approximately 40%, and light cycles (12 h on 12 h off). Animals were monitored continuously by Comparative Medicine via the Edstrom Watchdog system at University of Nebraska Medical Center (UNMC) and were pair-housed in each cage with unrestricted access to water and food (#8656 Sterilizable 4%, Envigo). Animals were allowed 3 days for acclimation facilities before the study began. The animals were randomly divided into 3 groups of 4 (Group ‘low flock (LF)’, Group ‘medium flock’ (MF), Group ‘high flock’ (HF)). Carprofen (5 mg/Kg) was administered once subcutaneously prior to surgery and the rats were induced by using 4% isoflurane in oxygen for approximately 2 min and maintained by 2% isoflurane during the procedure. Rats were placed on a circulating warm blanket to maintain their body temperature. An area of 8 × 4 cm2 on the back of each animal was shaved, and povidone-iodine solution and 70% ethanol were applied three times on exposed skin. Flocked scaffolds were sterilized by ethylene oxide for 24 h one day before implantation and rinsed with saline before implanting. Each rat received 4 of the same type of flocked scaffold, with the fibers facing away from the underlying muscle. Each treatment group had 4 rats. There were 16 implants for each group (8 implants/group/each designed ending time point). Subcutaneous pockets were made through 1.5 cm incisions at 4 supraspinal sites on the dorsum. Each sample was inserted into a subcutaneous pocket by a tweezer, and then the skin incisions were closed with a stapler. Rats were euthanized by CO2 at 1 or 2 weeks post-implantation. Each explant with surrounding tissue was gently dissected out of its subcutaneous pocket, and then immersed in formalin for at least 3 days prior to histology analysis. This animal study protocol (#17-103-11-FC) has been approved by IACUC at UNMC.
Statistics & Graphics:
All data was expressed as mean ± standard deviation and a minimum sample size of 3 was used in each experiment. For pairwise columnar comparisons, ordinary one-way ANOVAs with Tukey’s multiple comparisons post-hoc testing were performed. Similarly, for grouped pairwise comparisons, 2-way ANOVAs with Tukey’s multiple comparisons post-hoc testing was performed. In instances where the number of pairwise comparisons exceeded the possible graphable numbers, a table was created p values and included in the supporting information (Tables S1–S8). Estimated conductivities using the Percolation Theory were expressed as single points based on theoretical data following the equation described in the present work. Fiber alignment was interpolated from single points to a continuous line using nonlinear fitting. Normalized (adjusted curves to fall from 0-180 degrees) and smoothed distribution curves were compared using a Kolmogorov-Smirnov test. Flock yields were expressed as heat maps, with each box expressing the average of 3 sample values. The equation for AgNP filler fraction (y = 36.53x + 0.2849) was generated using a simple linear regression. All measurements on photographs/SEM micro photographs were taken using ImageJ after calibrating pixels to mm/μm. Statistical significance was expressed as *p < 0.05, **p < 0.01, ***p < 0.001, ****p < 0.0001, and a lack of pairwise comparison bars implies a lack of significance (p > 0.05). Figures are all original and were created using BioRender and Microsoft PowerPoint. All statistical analysis was performed using GraphPad Prism 9 for macOS (version 9.1.1).
Supplementary Material
Acknowledgements
This work was partially supported by startup funds from University of Nebraska Medical Center (UNMC), National Institute of General Medical Science (NIGMS) of the National Institutes of Health under Award Number R01GM123081 and R01GM138552. We thank the UNMC Nanomaterials Characterization Core Facility and Dr. Svetlana Romanova for assisting with ICP-MS data collection. We thank Rajesh Shah and the American Flock Association for guidance and training on electrostatic flocking processes, Daniel McGoldrick for assisting with ImageJ coding for orientation analysis, and Elise Thayer for proofreading of the manuscript.
Footnotes
Supporting Information
Supporting information is available from the Wiley Online Library or from the author.
Contributor Information
Alec McCarthy, Department of Surgery – Transplant and Mary & Dick Holland Regenerative Medicine Program, University of Nebraska Medical Center, Omaha, NE, 68198, USA.
Johnson V. John, Department of Surgery – Transplant and Mary & Dick Holland Regenerative Medicine Program, University of Nebraska Medical Center, Omaha, NE, 68198, USA
Lorenzo Saldana, Department of Surgery – Transplant and Mary & Dick Holland Regenerative Medicine Program, University of Nebraska Medical Center, Omaha, NE, 68198, USA.
Hongjun Wang, Department of Surgery – Transplant and Mary & Dick Holland Regenerative Medicine Program, University of Nebraska Medical Center, Omaha, NE, 68198, USA.
Matthew Lagerstrom, Department of Surgery – Transplant and Mary & Dick Holland Regenerative Medicine Program, University of Nebraska Medical Center, Omaha, NE, 68198, USA.
Shixuan Chen, Department of Surgery – Transplant and Mary & Dick Holland Regenerative Medicine Program, University of Nebraska Medical Center, Omaha, NE, 68198, USA.
Yajuan Su, Department of Surgery – Transplant and Mary & Dick Holland Regenerative Medicine Program, University of Nebraska Medical Center, Omaha, NE, 68198, USA.
Mitchell Kuss, Department of Surgery – Transplant and Mary & Dick Holland Regenerative Medicine Program, University of Nebraska Medical Center, Omaha, NE, 68198, USA; Division of Cardiology, Department of Internal Medicine, University of Nebraska Medical Center, Omaha, NE, 68198, USA.
Bin Duan, Department of Surgery – Transplant and Mary & Dick Holland Regenerative Medicine Program, University of Nebraska Medical Center, Omaha, NE, 68198, USA; Division of Cardiology, Department of Internal Medicine, University of Nebraska Medical Center, Omaha, NE, 68198, USA.
Mark A. Carlson, Department of Surgery – General Surgery, College of Medicine, University of Nebraska Medical Center, Omaha, NE, 68198, USA
Jingwei Xie, Department of Surgery – Transplant and Mary & Dick Holland Regenerative Medicine Program, University of Nebraska Medical Center, Omaha, NE, 68198, USA; Department of Mechanical and Materials Engineering, University of Nebraska, Lincoln, Lincoln, NE, 68588, USA.
References
- [1].Vellayappan MV, Jaganathan SK, Supriyanto E, RSC Adv. 2015, 21. [Google Scholar]
- [2].Gokarneshan N, Curr. Trends Fashion Technol. Textile Eng 2018, 4. [Google Scholar]
- [3].Phillippi AL, O’Connor NJ, Lewis AF, Kim YK, Aquac. 2001, 225. [Google Scholar]
- [4].Xu X, Wang K, Guo H, Sun G, Chen R, Yu J, Liu J, Lin C, Wang J, J. Colloid Interface Sci 2021, 588, 9. [DOI] [PubMed] [Google Scholar]
- [5].Guo Y, Javed M, Li X, Zhai S, Cai Z, Xu B, Adv. Sustain. Syst 2021, 8. [Google Scholar]
- [6].Tu C, Cai W, Chen X, Ouyang X, Zhang H, Zhang Z, Small 2019, 15. [DOI] [PubMed] [Google Scholar]
- [7].Hitzbleck M, Lovchik RD, Delamarche E, Adv. Mater 2013, 25, 2672. [DOI] [PubMed] [Google Scholar]
- [8].Uetani K, Ata S, Tomonoh S, Yamada T, Yumura M, Hata K, Adv. Mater 2014, 26, 5857. [DOI] [PubMed] [Google Scholar]
- [9].Yu Z, Wei S, Guo J, J. Mater. Sci.: Mater. Electron 2019, 30, 10233. [Google Scholar]
- [10].Li X, Wang J, Wang K, Yao J, Bian H, Song K, Komarneni S, Cai Z, Chem. Eng. J 2020, 390, 124442. [Google Scholar]
- [11].Lewis AF, Matos H, Rice JM, Kim YK, Text. Res. J 2018, 88, 392. [Google Scholar]
- [12].Fodor K, Chalivendra V, Kim Y, Lewis A, Compos. Struct 2018, 207, 1. [Google Scholar]
- [13].Dalmaso G, Bini M, Paroni R, Ferrari M, PDA J. Pharm. Sci. Technol 2008, 62, 191. [PubMed] [Google Scholar]
- [14].McCarthy A, Saldana L, Ackerman DN, Su Y, John JV, Chen S, Weihs S, Reid P, Santarpia JL, Carlson MA, Xie, Nano Lett. 2021. [DOI] [PubMed] [Google Scholar]
- [15].Probst A, Facius R, Wirth R, Moissl-Eichinger C, Appl. Environ. Microbiol 2010, 76, 5148. [DOI] [PMC free article] [PubMed] [Google Scholar]
- [16].Gossla E, Tonndorf R, Bernhardt A, Kirsten M, Hund R-D, Aibibu D, Cherif C, Gelinsky M, Acta Biomater. 2016, 44, 267. [DOI] [PubMed] [Google Scholar]
- [17].Steck E, Bertram H, Walther A, Brohm K, Mrozik B, Rathmann M, Merle C, Gelinsky M, Richter W, Tissue Eng. Part A 2010, 16, 3697. [DOI] [PubMed] [Google Scholar]
- [18].Walther A, Hoyer B, Springer A, Mrozik B, Hanke T, Cherif C, Pompe W, Gelinsky M, Materials 2012, 5, 540. [DOI] [PMC free article] [PubMed] [Google Scholar]
- [19].Walther A, Bernhardt A, Pompe W, Gelinsky M, Mrozik B, Hoffmann G, Cherif C, Bertram H, Richter W, Schmack G, Text. Res. J 2007, 77, 892. [Google Scholar]
- [20].Tonndorf R, Gossla E, Kocaman RT, Kirsten M, Hund R-D, Hoffmann G, Aibibu D, Gelinsky M, Cherif C, Text. Res. J 2018, 88, 1965. [Google Scholar]
- [21].Balasubramanian P, Boccaccini AR, Mater. Lett 2015, 158, 313. [Google Scholar]
- [22].Chang DK, Louis MR, Gimenez A, Reece EM, Semin Plast Surg. 2019, 3, 33. [DOI] [PMC free article] [PubMed] [Google Scholar]
- [23].Żenkiewicz M, Żuk T, Markiewicz E, Polym. Testing 2015, 42, 192. [Google Scholar]
- [24].Kim S, Choi S, Oh E, Byun J, Kim H, Lee B, Lee S, Hong Y, Sci. Rep 2016, 6, 34632. [DOI] [PMC free article] [PubMed] [Google Scholar]
- [25].Gonon P, Boudefel A, J. Appl. Phys 2006, 99, 024308. [Google Scholar]
- [26].Lee D, Kahng B, Cho YS, Goh K-I, Lee D-S, J. Korean Phys. Soc 2018, 73, 152. [Google Scholar]
- [27].Liao C, Li Y, Tjong SC, Int. J. Mol. Sci 2019, 20, 2. [DOI] [PMC free article] [PubMed] [Google Scholar]
- [28].Derakhshandeh H, Aghabaglou F, McCarthy A, Mostafavi A, Wiseman C, Bonick Z, Ghanavati I, Harris S, Kreikemeier-Bower C, Moosavi Basri SM, Rosenbohm J, Yang R, Mostafalu P, Orgill D, Tamayol A, Adv. Funct. Mater 2020, 30, 1905544. [DOI] [PMC free article] [PubMed] [Google Scholar]
- [29].Aldrich A, Kuss MA, Duan B, Kielian T, ACS Appl. Mater. Interfaces 2019, 11, 12298. [DOI] [PMC free article] [PubMed] [Google Scholar]
- [30].Zhang W, Shi W, Wu S, Kuss M, Jiang X, Untrauer JB, Reid SP, Duan B, Biofabrication 2020, 12, 035020. [DOI] [PMC free article] [PubMed] [Google Scholar]
- [31].Chen S, John JV, McCarthy A, Xie J, J. Mater. Chem. B 2018, 6, 393.32254519 [Google Scholar]
- [32].Carter P, Rahman SM, Bhattarai N, J. Biomater. Sci. Poly. Ed 2016, 27, 692. [DOI] [PubMed] [Google Scholar]
- [33].Su Y, Mainardi VL, Wang H, McCarthy A, Zhang YS, Chen S, John JV, Wong SL, Hollins RR, Wang G, Xie J, ACS Nano 2020, 14, 11775. [DOI] [PMC free article] [PubMed] [Google Scholar]
- [34].Sarasam A, Madihally SV, Biomaterials 2005, 26, 5500. [DOI] [PubMed] [Google Scholar]
- [35].Fan L, Li J-L, Cai Z, Wang X, ACS Nano 2018, 12, 5780. [DOI] [PubMed] [Google Scholar]
- [36].Lee E, Zhang H, Jackson JK, James Lim C, Chiao M, RSC Adv. 2016, 6, 79900. [Google Scholar]
- [37].Shah AR, Shah SR, Oh S, Ong JL, Wenke JC, Agrawal CM, Ann. Biomed. Eng 2011, 39, 2501. [DOI] [PMC free article] [PubMed] [Google Scholar]
- [38].Xing Q, Qian Z, Tahtinen M, Yap AH, Yates K, Zhao F, Adv. Healthc. Mater 2017, 6, 1601333. [DOI] [PMC free article] [PubMed] [Google Scholar]
- [39].Ryan AJ, Lackington WA, Hibbitts AJ, Matheson A, Alekseeva T, Stejskalova A, Roche P, O’Brien FJ, Adv. Healthc. Mater. 2017, 6, 1700954. [DOI] [PubMed] [Google Scholar]
- [40].Abdal-hay A, Bartnikowski M, Hamlet S, Ivanovski S, Mater. Sci. Eng. C 2018, 82, 10. [DOI] [PubMed] [Google Scholar]
- [41].Kord B, J. Thermoplast. Compos. Mater 2012, 25, 793. [Google Scholar]
- [42].Annaidh AN, Bruyere K, Destrade M, Gilchrist MD, Ottenio M, J. Mech. Behav. Biomed. Mater 2012, 5, 1. [DOI] [PubMed] [Google Scholar]
- [43].You C, Li Q, Wang X, Wu P, Ho JK, Jin R, Zhang L, Shao H, Han C, Sci. Rep 2017, 7. [DOI] [PMC free article] [PubMed] [Google Scholar]
- [44].Kim JH, Park H, Seo SW, Nano Converg. 2017, 4, 33. [DOI] [PMC free article] [PubMed] [Google Scholar]
- [45].Tamelier J, Chary S, Turner KL, Langmuir 2012, 28, 8746. [DOI] [PubMed] [Google Scholar]
- [46].Zheng Y, Zhou X, Xing Z, Tu T, RSC Adv. 2018, 8, 10719. [DOI] [PMC free article] [PubMed] [Google Scholar]
Associated Data
This section collects any data citations, data availability statements, or supplementary materials included in this article.