Abstract
We examine the value of an active line scan with spatial gating for imaging sub-diffuse, wide-field reflectance microtexture. Line scanning combined with spatial gating and linear translation can be used for localized detection of features in the surface layer of a turbid target. The line scan provides broadband spatial frequency modulation, and the spatial gating effectively high-pass filters the reflectance. The major benefit of this approach is that of high dynamic range (70%–90%) signal preservation and high contrast to noise when imaging at high spatial frequencies. Alternative approaches, such as spatial frequency domain imaging, are degraded by low dynamic range in demodulated images, making it nearly impossible to image over a wide field of view at frequencies over 1.5 mm−1 using commercial technology. As such, active line scanning with spatial gating presents as an inherently high sensitivity and high dynamic range method of imaging microscopic scattering features in only the surface layer of a turbid medium.
Optical structured light imaging, which involves illuminating the target with spatially modulated patterns of light, is used in a range of optical systems and applications. Structured illumination is used in microscopy, for example, to facilitate depth sectioning [1], enable spatially localized fluorophore activation [2], and enhance lateral resolution [3]. Structured light is also used in a wide-field geometry for meso- and macroscale imaging to extract three-dimensional (3D) surface profiles [4], quantify bulk optical properties [5-8], perform tomography [9], and extract surface layer features or textures from turbid samples [10].
A powerful wide-field structured light imaging method is spatial frequency domain imaging (SFDI), through which a turbid target is modulated with one-dimensional (1D) sinusoidal patterns of light at different spatial frequencies (fx) and with different wavelengths of light (λ). At a single fx and λ, the phase of the sinusoidal pattern is shifted and imaged repeatedly (often three phase shifts at Φ = 0°, 120°, and 240° are used). The three phase images provide three-point pixel-by-pixel amplitude demodulation that isolates reflectance from a discrete fx and λ [11]. SFDI systems can be categorized as diffuse or sub-diffuse (sd-SFDI), depending on the length scale and consequent light transport regime of the modulating photon density waves (i.e., the fx of the 1D sinusoidal illumination). Sd-SFDI requires that the modulation be finer than the length scale of diffuse photon propagation. Through demodulation, the photons that undergo highly scattered paths are rejected, whereas photons characterized by few scattering events and singular, large backscattering events are detected. In biologic tissues, for instance, fx values ~≥0.5 mm−1 yield sub-diffuse reflectance [6]. Sd-SFDI senses microscopic surface layer features in turbid media rapidly, without contact, and over a wide field of view. For these reasons, sd-SFDI and wide-field, sub-diffuse imaging in general are of interest to the optics community, particularly for biomedical imaging applications involving surface layer tissue characterization.
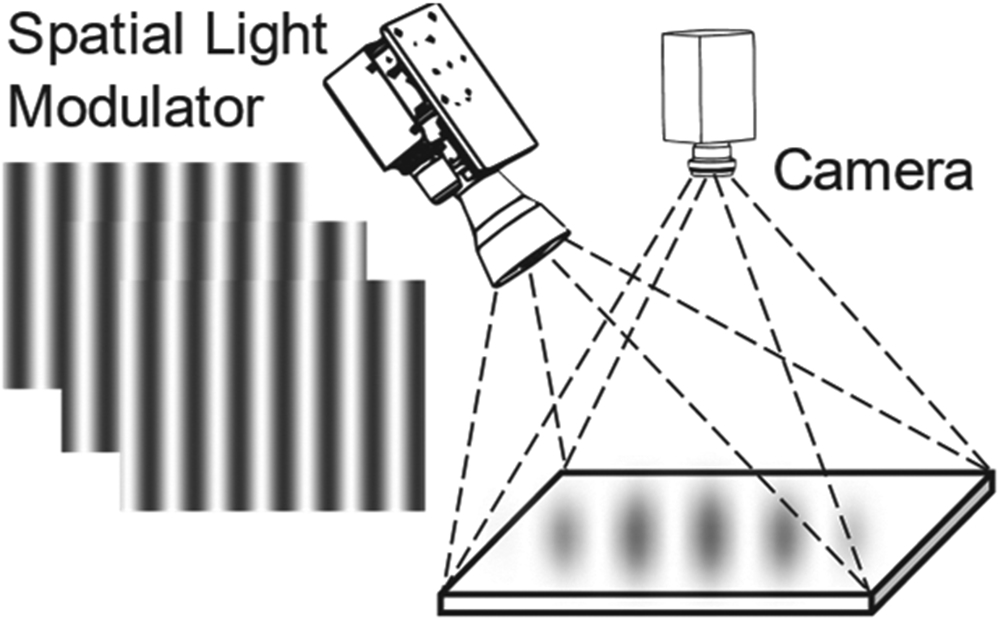
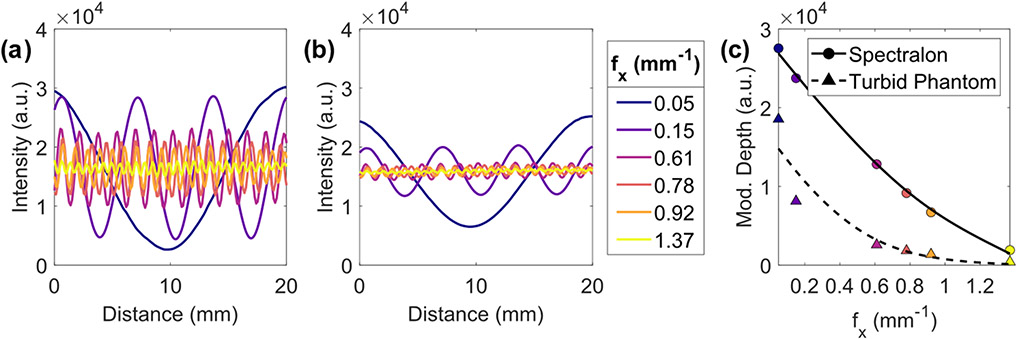
Figure 1 illustrates the standard implementation of SFDI, which is comprised of a source, a spatial light modulator (SLM), and a camera. The SLM technology often used in SFDI is a digital micromirror device (DMD), given the ease of use for projecting arbitrary numbers of sinusoidal frequency patterns. However, SFDI is limited by its low demodulated signal dynamic range at high spatial frequencies of illumination. This phenomenon is first demonstrated by imaging projected sinusoidal modulation patterns on a 99% reflectance, isotropic emission angle Spectralon standard (Labsphere, Inc., North Sutton, NH) using a previously published SFDI system [12]. Sinusoidal patterns at six spatial frequencies were projected from the DMD (CEL5500 Fiber, Digital Light Innovations Inc., Austin, TX) with maximized 8 bit modulation depth. The reflectance cross sections [Fig. 2(a)] show the detected modulating pattern at each fx. The approximated modulation depth (i.e., the difference between the minimum and maximum intensities in the reflected sinusoid) at each fx is plotted in Fig. 2(c) as circles with a fitted curve (solid black). As the fx increases, the modulation depth decreases markedly, which translates to a proportional reduction in demodulated reflectance dynamic range [11]. This limitation is worsened by the low-pass filtering (i.e., highly scattering, diffuse photon transport) effects of turbid media that drastically lower the image modulation depth at higher spatial frequencies of illumination. This compounding effect is demonstrated in Fig. 2(b), which shows the same illumination patterns reflected from a silicone–titanium dioxide (TiO2) turbid or tissue-like phantom (reduced scattering coefficient μ′s = 1.4–0.8 mm−1, absorption coefficient μa < 0.01 mm−1 for λ ∈ 471–851 nm, measured using Reflect RS, Modulim Imaging, Irvine, CA). The depth of modulation at the six fx values is plotted in Fig. 2(c) as triangles with a fitted curve (dashed black). The low-pass filtering effect of the turbid phantom demonstrates a significant limitation of sd-SFDI. As in microscopy, other methods for achieving structured localization can be scanning points or lines [13]. In this study, the relative merits of the latter are explored for wide-field imaging.
Fig. 1.

Reflectance geometry SFDI, with images taken at three phases and demodulated to isolate reflectance from a specific spatial frequency and wavelength of light.
Fig. 2.
Measurements of SFDI modulation patterns at a single illumination phase before demodulation. Modulation patterns (λ = 600 nm) at six discrete spatial frequencies reflected from (a) Spectralon and (b) the turbid phantom. (c) Modulation depth of each pattern shown in (a) as circles and in (b) as triangles with fitted curves, becoming unusable ~fx > 1.5 mm−1.
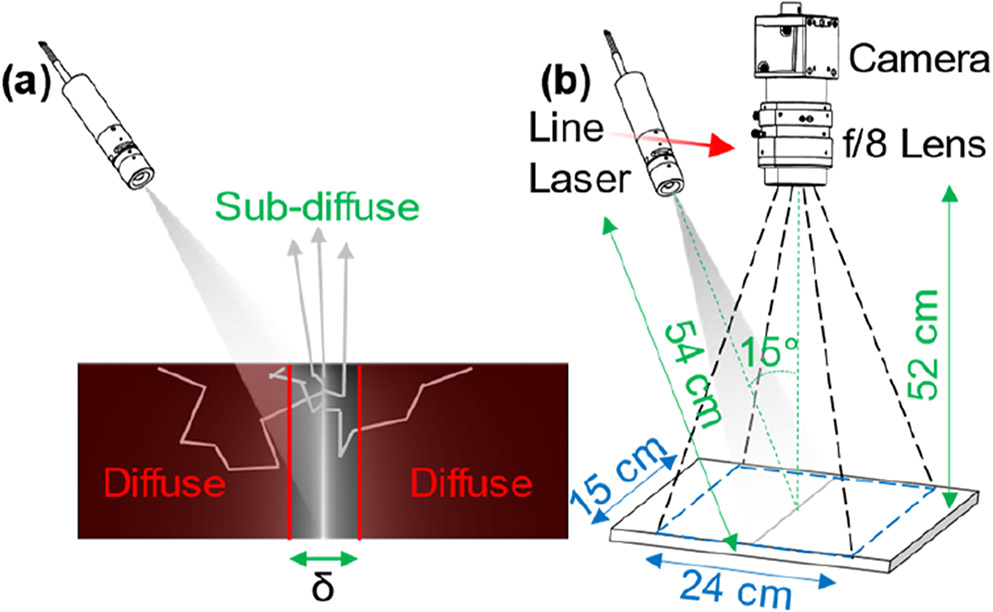
Active line scanning involves orienting a focused line laser source perpendicular to the direction of translation. As the line source is translated, images are captured at a rate such that the distance translated between images is less than the width of the reflected laser line. The spatial gate width in the object plane (δ) defines the digital mask that is applied to all light detector pixels such that only pixels proximal to where light is incident on the target are detected. In effect, reflectance from primarily the shortest source-detector separation distances is collected. Thus, line scanning with a narrow spatial gate is most sensitive to sub-diffusely scattered photons. In this scenario, the technique becomes sub-diffuse line scanning (SDLS). SDLS modulates the target with a focused line of light, providing broadband spatial frequency modulation. After image acquisition, spatial gating effectively high-pass filters the modulation with the cutoff frequency (fc) corresponding to the inverse of one-half the spatial gate width: fc = 2/δ. SDLS is similar in concept to spatially resolved reflectance measurements [14] or single fiber reflectance spectroscopy [15], except that a line source is used, and the objective is to capture high-contrast, high dynamic range images of sub-diffuse scatter microtexture over a wide field, not necessarily to quantify optical properties point-by-point.
Figure 3(a) illustrates reflectance from a line laser and the process of spatially gating the reflected light (i.e., rejected reflectance in red). Figure 3(b) shows a schematic of the line scan setup used in this study with a linearly translated laser line (red arrow). The laser and camera were positioned ~52 cm above the object plane. The laser was angled ~15° off the optical axis to mitigate specular reflections detected by the camera. A fast readout, 16 bit monochromatic CMOS camera (Blackfly S USB 3.0, FLIR, Wilsonville, OR) with a 12 mm focal length, f/8 lens (M1214-MP2, Computar, Cary, NC) imaged light reflected from a 410 nm line laser module (Streamline Laser, Osela Inc., Lachine, QC, Canada) mounted on a linear translation stage (DDSM100, Thorlabs, Newton, NJ). The laser module was externally focusable without removing any optics and had a total optical output power of ~70 mW. It had a fixed fan angle of 18°, intensity variation along the line of <10%, , laser line width (1/e2) of ~260 μm at the working distance of 54 cm, and depth of focus of ~20.5 cm. A detector pixel corresponded to ~125 × 125 μm in the object plane.
Fig. 3.
(a) Laser line with a spatial gate width of δ isolates reflectance from predominantly sub-diffusely scattered photons. (b) Schematic of the line scanning setup used in this study.
Line scan demodulation was accomplished using a custom MATLAB (R2020a) script that performed the following steps on each sequential image (functions listed in parentheses):
Intensity thresholding (imbinarize.m) created a binary map isolating each laser line.
Morphologic skeletonization (bwskel.m) reduced each thresholded line to a one-pixel-thick line.
Morphologic dilation (imdilate.m with a disk structural element) widened each one-pixel-thick line to the desired spatial gate width.
Rejected pixels (zero-valued elements) in the resulting binary mask were converted to Not-a-Number (NAN) datatype elements, and the resulting mask was applied to the image.
The final demodulation step involved pixel-by-pixel averaging across all acquired images while ignoring NAN elements (nanmean.m). Line scanning requires several images for wide-field demodulation, unlike the three phase images needed for SFDI demodulation. However, a line laser can provide optical power densities that are orders of magnitude greater than those projected by DMD-based systems, and a fast readout CMOS camera enables imaging at frame rates that are 10s to >100 fps. With these components, wide-field (i.e., 10–100 s of cm2) SDLS scanning is feasible in 10s of seconds or less. For all demodulated line scanning images in this study (Figs. 4 and 5), the translation stage moved at a constant rate of 0.33 cm/s, triggering the camera every 250 μm, for a total distance of 10 cm. Thus, each scan involved a total of 400 images and took ~30 s. Exposure time was adjusted between 10 ms (for Spectralon in Fig. 4, the paper target in Fig. 5) and 15 ms (for the turbid phantom in Fig. 4).
Fig. 4.
(a) Black board (ROI 1) and Spectralon or turbid phantom (ROI 2) high contrast target with a 5 mm scale bar. Relative dynamic range quantified using (b) SFDI images with respect to fx (λ = 600 nm, shown with fitted curves) and (d) line scanning with respect to fc (λ = 410 nm). In (c), the noise floor of reflectance lines from the Spectralon and turbid phantom (red line) define the maximum gate width (Spectralon, blue lines, δ ≈ 18 mm; turbid phantom, green lines, δ ≈ 22 mm). Corresponding fc values are shown in (d) along left edge with the same coloring.
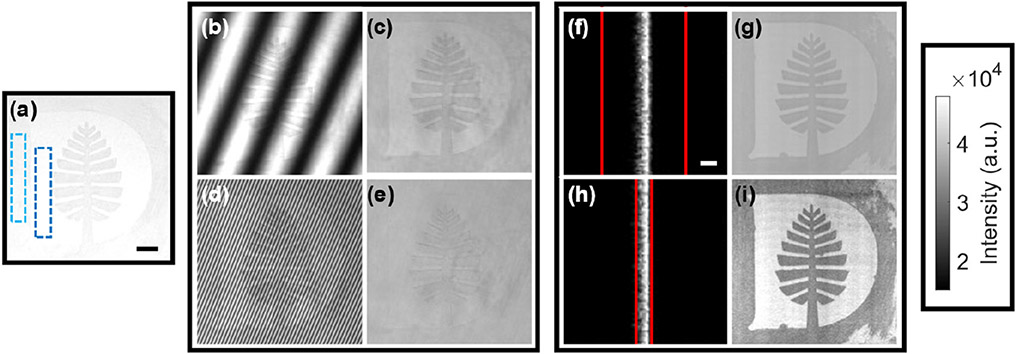
Fig. 5.
A Dartmouth College Pine logo target demonstrates sensitivity to scattering microtexture. (a) The target under room light with a 1 cm scale bar, showing the construction paper (dark blue) and painted (light blue) regions. (b) SFDI at fx = 0.05 mm−1 yields the demodulated reflectance image in (c). (d) SFDI at fx = 0.61 mm−1 yields the demodulated reflectance image in (e). (f) Close-up of a laser line with δ = 5 mm (red lines) and a 1 mm scale bar and (g) corresponding demodulated reflectance image. (h) Close-up of a laser line with δ = 1 mm and (i) corresponding demodulated reflectance image. All images are shown without histogram stretching.
To quantitatively compare SFDI and line scanning, the relative dynamic range of each approach was measured using the 99% reflectance Spectralon standard and the turbid phantom. A piece of highly absorbing ~1 mm thick black board (Thorlabs, Newton, NJ) was set on top of the Spectralon standard and the turbid phantom to make two high-contrast imaging targets. A region of interest (ROI) was defined on each side of each target [Fig. 4(a)]. Relative dynamic range was defined as ΔI/Io, where ΔI was the absolute difference in intensity between the two ROIs at a given fx (or fc), and Io was, in the case of SFDI, the average intensity from the bright region [ROI 2 in Fig. 4(a)] under diffuse (i.e., fx = 0 mm−1) illumination or, in the case of the line scan, the peak line laser intensity reflected from the bright region. SFDI relative dynamic range was measured with respect to discrete spatial frequencies of modulation [Fig. 4(b)]. At the highest frequency (fx = 1.37 mm−1), sd-SFDI yielded a relative dynamic range of ~2% for both the Spectralon standard and the turbid phantom. The relative dynamic range achieved by line scanning was measured with respect to high-pass cutoff frequency [Fig. 4(d)]. As the spatial gate narrowed, the relative dynamic range monotonically increased. At the limit, which corresponded to a δ equal to the width of a single pixel, the relative dynamic range of line scanning reached 91% for the black board/Spectralon standard and 72% for the black board/turbid phantom. The relative dynamic range tended toward zero for the lowest fc values, because the spatial gate was significantly wider than the line reflectance profile, and demodulation was skewed by light detector noise. This trend demonstrates the importance of defining a maximum practical δ depending on the imaging setup and target medium, a process that is demonstrated in Fig. 4(c). The maximum practical δ was defined by three standard deviations above the mean noise floor intensity of a representative image [15 ms exposure time, red horizontal line in Fig. 4(c)]. These maximum practical δ values (and corresponding fc values) are shown as blue vertical lines (for Spectralon) and green vertical lines (for the turbid phantom) in Figs. 4(c) and 4(d). Importantly, the horizontal axes in Figs. 4(b) and 4(d) are not equivalent, given that fx depicts a discrete spatial frequency, and fc represents a high-pass cutoff spatial frequency. The key point is that for high spatial frequencies of modulation, the relative dynamic range achieved by sd-SFDI is low, whereas that achieved by SDLS is quite high. The peak relative dynamic range that SDLS can achieve depends on the light detector resolution in the imaging plane, the focus and λ of the line laser, and the optical properties of the target.
To compare the dynamic range of sd-SFDI and SDLS in the context of wide-field feature detection, an 8 cm2 imaging target was composed of white construction paper with a painted liquid paper outline of the Dartmouth College Pine logo. The target as it appears to the naked eye [Fig. 5(a)] exhibited low contrast. SFDI with modulation at fx = 0.05 mm−1 [Fig. 5(b)] and fx = 0.61 mm−1 [Fig. 5(d)] yield demodulated images with decreasing dynamic range, shown in Fig. 5(c) and Fig. 5(e), respectively. Subplots Figs. 5(f) and 5(h) show close-up (1 cm2) images of a single laser line illustrating spatial gates (red lines) of δ = 5.0 mm and δ = 1.0 mm, respectively. The slight asymmetry of the lines in Figs. 5(f) and 5(h) is due to the off-axis projection of the line laser. The corresponding demodulated line scanning images are shown in Figs. 5(g) and 5(i). All images in Fig. 5 are shown without histogram stretching and using the same intensity range. Line scanning with a narrow spatial gate more effectively picks out scattering microtexture from the liquid paper while maintaining a relatively high dynamic range [Fig. 5(i)]. Finally, to compare image quality between the SFDI and line scanning reflectance images in Fig. 5, the contrast-to-noise ratio (CNR) was quantified between the brighter construction paper background [dark blue ROI in Fig. 5(a)] and the lower intensity painted liquid paper [light blue ROI in Fig. 5(a)]. CNR was defined as ∣Ipaper – Ipaint∣/σpaper, where Ipaper was the average intensity in the paper ROI, Ipaint was the average intensity in the liquid paper ROI, and σpaper was the standard deviation of the paper ROI. The low fx [Fig. 5(c)] and high fx [Fig. 5(e)] SFDI images exhibited CNR values of 0.6 and 0.2, respectively. The wide δ [Fig. 5(g)] and narrow δ [Fig. 5(i)] line scanning reconstructions exhibited CNR values of 2.6 and 3.7, respectively.
SDLS can be used for wide-field, localized scatter imaging of the surface layer of a turbid medium and requires just a few inexpensive components: a line laser source, a translation device, and a light detector. Results here indicate that SDLS provides high relative dynamic range at high spatial frequencies of modulation, superior to that of sd-SFDI. SDLS also exhibits increased CNR at higher spatial frequencies of modulation. In SDLS, a tradeoff exists between the gate width and the resolution of the SDLS scanning. As the gate narrows, the translation distance between sequential images in SDLS should be reduced, and the total number of images in the scan should be increased to maintain demodulated image quality. High frequency noise along the dimension of translation arises in SDLS when very narrow spatial gating is used. This noise can be effectively filtered in the Fourier domain.
This study demonstrated the concept of SDLS using only flat imaging targets. This simple geometry enabled consistent line laser modulation and avoided specular reflection artifacts. In practice, however, the target of interest may have a complex surface profile (e.g., a biologic tissue sample). Recent SFDI studies used optically clear acrylic plates to fix tissue samples, effectively providing a flat object plane to mitigate specular reflections and demodulation artifacts [8,10]. 3D surface imaging is possible using a wide range of optical structured light systems and illumination patterns [4], and optical line scan or laser stripe systems dedicated to 3D surface profilometry are common for industrial applications. In theory, the same principles could be implemented with SDLS to correct for the surface profile of the target.
The goal of this study was to achieve high-contrast, high dynamic range sub-diffuse imaging over a wide field of view. SDLS achieves this goal. SDLS can, in principle, be used to extract quantitative information from turbid media, including μ′s, μa, and a phase function parameter (e.g., psb from Reference [15]). Future work focuses on SDLS optical property quantification based on an approach similar to that used in single fiber reflectance spectroscopy [15], leveraging multi-line laser technology to increase scanning speed, and multispectral SDLS, enabling wide-field, sub-diffuse reflectance color imaging for rapid detection of surface layer features in turbid media.
Funding.
National Cancer Institute (R01CA192803).
Footnotes
Disclosures. The authors declare no conflicts of interest.
REFERENCES
- 1.Neil MAA, Juškaitis R, and Wilson T, Opt. Lett 22, 1905 (1997). [DOI] [PubMed] [Google Scholar]
- 2.Wilson T, J. Microsc 242, 111 (2011). [DOI] [PubMed] [Google Scholar]
- 3.Gustafsson MGL, J. Microsc 198, 82 (2000). [DOI] [PubMed] [Google Scholar]
- 4.Geng J, Adv. Opt. Photon 3, 128 (2011). [Google Scholar]
- 5.Kanick SC, McClatchy DM, Krishnaswamy V, Elliott JT, Paulsen KD, and Pogue BW, Biomed. Opt. Express 5, 3376 (2014). [DOI] [PMC free article] [PubMed] [Google Scholar]
- 6.McClatchy DM, Rizzo EJ, Wells WA, Cheney PP, Hwang JC, Paulsen KD, Pogue BW, and Kanick SC, Optica 3, 613 (2016). [DOI] [PMC free article] [PubMed] [Google Scholar]
- 7.Lin W, Zeng B, Cao Z, Chen X, Yang K, and Xu M, Biomed. Opt. Express 9, 2905 (2018). [DOI] [PMC free article] [PubMed] [Google Scholar]
- 8.Maloney BW, Streeter SS, McClatchy DM, Pogue BW, Rizzo EJ, Wells WA, and Paulsen KD, J. Biomed. Opt 24, 096002 (2019). [DOI] [PMC free article] [PubMed] [Google Scholar]
- 9.Konecky SD, Mazhar A, Cuccia D, Durkin AJ, Schotland JC, and Tromberg BJ, Opt. Express 17, 14780 (2009). [DOI] [PMC free article] [PubMed] [Google Scholar]
- 10.Streeter SS, Maloney BW, McClatchy DM, Jermyn M, Pogue BW, Rizzo EJ, Wells WA, and Paulsen KD, J. Biomed. Opt 24, 096003 (2019). [DOI] [PMC free article] [PubMed] [Google Scholar]
- 11.Cuccia DJ, Bevilacqua F, Durkin AJ, and Tromberg BJ, Opt. Lett 30, 1354 (2005). [DOI] [PubMed] [Google Scholar]
- 12.McClatchy DM, Rizzo EJ, Meganck J, Kempner J, Vicory J, Wells WA, Paulsen KD, and Pogue BW, Phys. Med. Biol 62, 8983 (2017). [DOI] [PMC free article] [PubMed] [Google Scholar]
- 13.Poher V, Kennedy GT, Manning HB, Owen DM, Zhang HX, Gu E, Dawson MD, French PMW, and Neil MAA, Opt. Lett 33, 1813 (2008). [DOI] [PubMed] [Google Scholar]
- 14.Krauter P, Reitzle D, Geiger S, and Kienle A, J. Biomed. Opt 22, 075003 (2017). [DOI] [PubMed] [Google Scholar]
- 15.Post AL, Sterenborg HJCM, Woltjer FG, van Leeuwen TG, and Faber DJ, J. Biomed. Opt 25, 015001 (2020). [DOI] [PMC free article] [PubMed] [Google Scholar]


