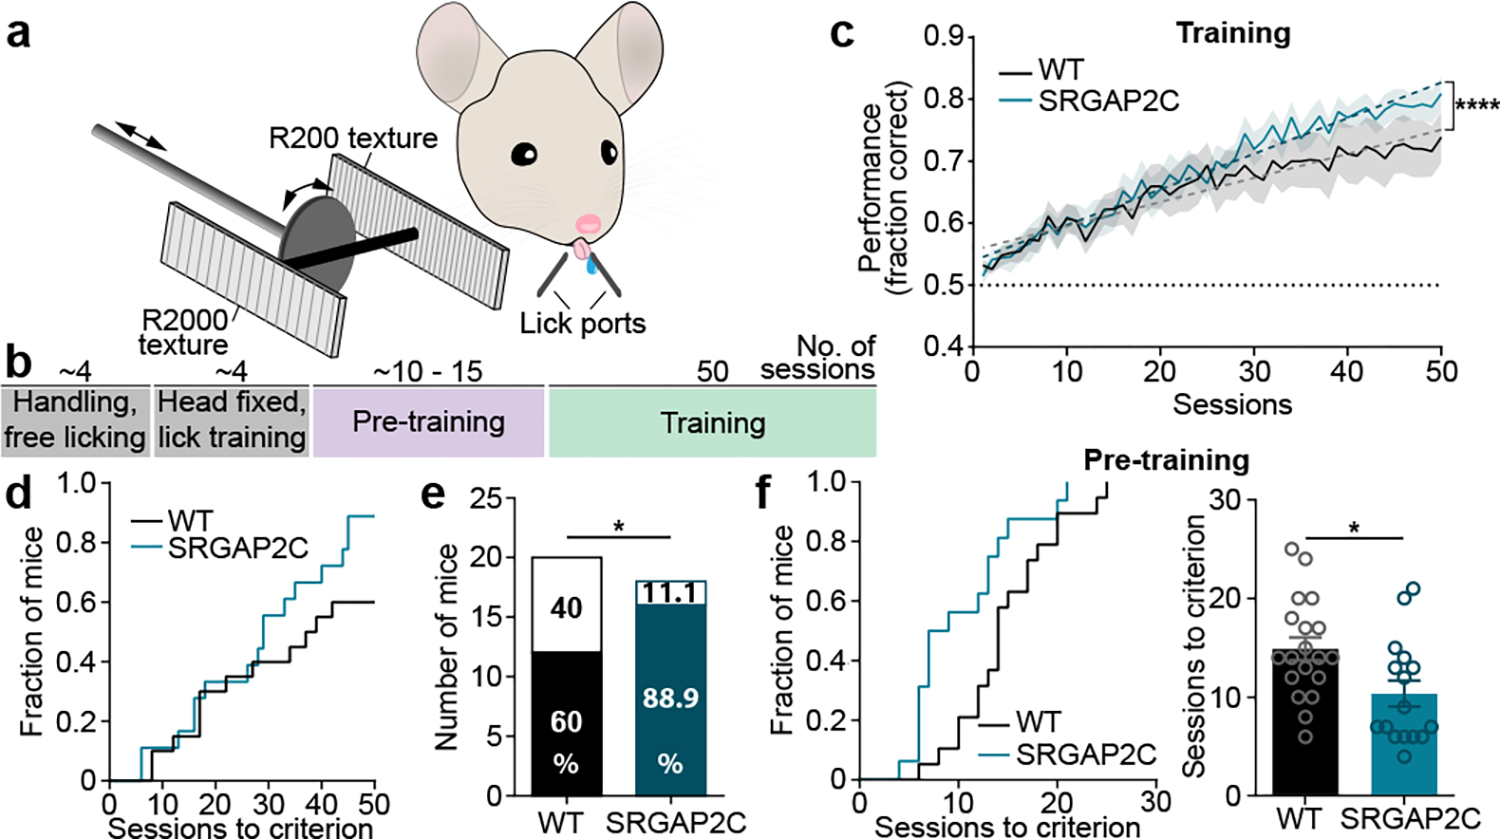
Figure. 4. Humanized SRGAP2C mice display increased ability to learn a texture discrimination task.

(a-b) Schematic of whisker-based texture discrimination task. Distance between laser cut grooves for R200 and R2000 textures is 200 and 2000 μm, respectively. Scale bar, 100 μm. (c) Behavioral performance shown as fraction of correct trials over sessions of training (1 session / day). Shaded area indicates s.e.m. Linear regression indicated by dashed lines. Dotted horizontal line indicates chance level performance (50% correct). Linear regression, slope WT = 0.0039, slope SRGAP2C = 0.0057. ****P < 0.0001, linear regression F-test. (d) Cumulative histogram for number of sessions to learning criterion (75% correct). (e) Number of learners (mice that reached 75% correct responses) and non-learners (mice that never reached 75% correct responses). Numbers in bar graphs indicate percentage of total number of mice tested. P = 0.043, Chi-Square test. (f) Left: cumulative histogram for number of sessions to learning criterion during pre-training (75% correct responses). Right: number of sessions to reach criterion. P=0.0135, two-sided Mann-Whitney test. Bar graphs plotted as mean ± s.e.m. Open circles in bar graphs indicate individual mice (n = 19 for WT and n = 16 for SRGAP2C mice), *P < 0.05.
